

Abstract
Objective:
The construct of participation after traumatic brain injury (TBI) can be difficult to operationalize. Psychometric network analysis offers an empirical approach to visualizing and quantifying the associations between activities that comprise participation, elucidating the relations among the construct’s components without assuming the presence of a latent common cause and generating a model to inform future measurement methods. The current research applied psychometric network analysis to the Participation Assessment with Recombined Tools-Objective (PART-O) within a sample of Service Members and Veterans (SM/Vs) with a history of TBI at 1- and 2-years (T1 and T2) post-injury.
Participants:
Participants (N = 663) were SM/Vs with a history of TBI who completed comprehensive inpatient rehabilitation services at a VA Polytrauma Rehabilitation Center (PRC).
Setting:
Five VA PRCs.
Design:
Cross-sectional, retrospective analysis of data from the Veterans Affairs (VA) TBI Model Systems study.
Main Measures:
Participation Assessment with Recombined Tools-Objective (PART-O)
Results:
Network analysis demonstrated that the PART-O structure was generally consistent over time, but some differences emerged. The greatest difference observed was the association between “spending time with friends” and “giving emotional support” to others. This association was more than twice as strong at T2 as at T1. The “out of the house” item was most central, as demonstrated by dense connections within its own subscale (Out and About) and items in other subscales (i.e., Social Relations and Productivity). When examining items connecting the three subscales, the items related to giving emotional support, Internet use, and getting out of the house emerged as the strongest connectors at T1, and Internet was the strongest connector at T2.
Conclusion:
Providing emotional support to others is associated with greater participation across multiple domains and is an important indicator of recovery. Being out and about, Internet use, and engagement in productive activities such as school and work shared strong associations with Social Relations. Network analysis permits visual conceptualization of the dynamic constructs that comprise participation, and has the potential to inform approaches to measurement and treatment.
Keywords: traumatic brain injury, participation, community reintegration, Veterans, network analysis
Traumatic brain injury (TBI) is the “signature injury” among Service Members deployed during Operation Enduring Freedom, Operation Iraqi Freedom, and Operation New Dawn (OEF/OIF/OND).1,2 Between 2000 and 2021, over 430,000 Service Members sustained one or more TBIs, approximately 82% of which are classified as mild (mTBI).3 Service Members and Veterans (SM/Vs) with a history of TBI may experience long-lasting impairments in physical, cognitive, emotional, and social functioning. Impairments across these domains can be associated with barriers to participation, which includes social interactions and engagement in daily routines such as work, school, and leisure activities.4
Participation is a meaningful rehabilitation outcome and involves community reintegration and return to productivity. However, participation is difficult to measure given varying perspectives regarding how to operationalize the construct.5 Quantifying productive activity (e.g., work, school, homemaking) often takes into account the number of hours an individual spends in these activities, but does not necessarily reflect the engagement, effort, satisfaction, or meaningfulness of the activity.6 These limitations challenge efforts to differentiate participation from other activities as defined by the World Health Organization’s International Classification of Functioning, Disability and Health.7
The Participation Assessment with Recombined Tools-Objective (PART-O) was developed to assess three domains of participation: Productivity, Social Relationships, and Community Involvement.7 The PART-O assesses participation in either a typical week or typical month, and it combines items from three measures frequently used among individuals with a history of TBI5: the Community Integration Questionnaire8, the Participation Objective, Participation Subjective9; and the Craig Handicap Assessment and Reporting Technique.10 The PART-O can produce summed or averaged domain scores (Productivity, Social Relations, and Out and About) and an overall score.5 Historically, the summed or averaged scores have demonstrated relatively weak associations with measures of well-being or participation satisfaction, possibly due to the variety of ways one can participate in social activities within the timeframe specified by the items.6,11 A previous psychometric investigation of the PART-O demonstrated that an approach to summating items from the productivity and social interaction domains yielded a sufficiently unidimensional construct such that a Rasch model could be fit that optimized rating level separation.6
As an application of dynamic systems theory, psychometric network analysis (PNA) is a tool that can inform approaches to measuring complex phenomena such as participation. This analytic framework can elucidate the relations among items associated with the construct without presupposing an underlying common factor.12 It is therefore well-suited to informing measurement methods for constructs such as participation, which are likely influenced by a multitude of personal, environmental, and situational variables.13 The aim of the current work was to explore the psychometric network of PART-O items among SM/Vs with a history of TBI at 1- and 2-years post-injury.
Method
Participants
The current study used data from the Department of Veterans Affairs TBI Model Systems (VA TBIMS) project. All participants received comprehensive inpatient rehabilitation from one of five VA Polytrauma Rehabilitation Centers. The VA TBIMS inclusion criteria are: (1) diagnosis of TBI per case definition; (2) age 16 years or older at time of TBI; (3) admission to a PRC for TBI rehabilitation; and (4) informed consent by the participant or legally authorized representative.14 Finally, participants were excluded if they did not have complete data from the PART-O at either one or two years after injury, whether that was because they had not yet reached that follow-up assessment time point or because they did not respond to (or were not administered) all PART-O items at either of the two time points.
Procedure
Participants provided informed consent either directly or by legal proxy as described previously.14 Study procedures were approved by the Institutional Review Boards at each PRC site. Follow-up assessments including the PART-O were conducted one year and two years (+/− 3 months) after injury via phone or mail-in questionnaires.
Measures
Participation Assessment with Recombined Tools-Objective-17 item version (PART-O-17).
The PART-O-17 is a shortened version of the original 24-item PART-O, a self-report measure of social role participation.5,15 The PART-O-17 can be administered as an interview or a questionnaire and can be administered to either the individual with TBI or a familiar proxy.16 Each item is rated from 0–5 based on the frequency of a specific activity within a designated period (e.g., typical week). The PART-O-17 produces a total score and three domain scores: Productivity (3 items), Social Relations (7 items), and Out and About (7 items).17 Each subscale score is computed as the average response to all respective items, producing a score ranging from 0–5.
Sociodemographic Variables.
Participant characteristics included sex, race/ethnicity, and age at injury. Sex was coded dichotomously (i.e., male/female) based on medical record review. Race and ethnicity were self-reported as separate variables. Age at injury was calculated from date of birth (reported by participant or proxy) to date of injury (coded via medical record review).
Statistical Analyses
Psychometric network analyses are rapidly gaining popularity for examining clusters of related symptoms as dynamic systems.18 We applied this analytic approach to indicators of rehabilitation (i.e., participation) rather than symptom severity. In the current network, nodes (i.e., the circles in Figure 1 and Figure 2) represent cross-sectional scale items and edges represent the unregularized (i.e., algorithmic and therefore automatic process of removing and adding edges until model fit is maximized) partial correlation (i.e., controlling for all other correlations in the network) between any two nodes, where the strength of these associations are referred to as edge weights. We also estimated the strength centrality of each node in our networks which refers to the overall influence of a node within a network and are based only on the edges included in the resultant network. Recent advances in network psychometrics also allowed us to identify bridge nodes which play a role in connecting different node communities. Node communities are comprised of nodes that are grouped together using a community detection algorithm or are manually selected by the researcher. We chose the latter approach, coding node communities based on the three-factor structure commonly used with the PART-O.7 We identified bridge nodes by examining network community cross-loadings which quantified the extent to which a given node facilitated communication between their own community and others, or in other words, which elements of participation most account for associations observed between domains.19 These values were also visually represented in our networks by the proportion of each respective community color filling the circles around each node.
Figure 1. PART-O network at T1.
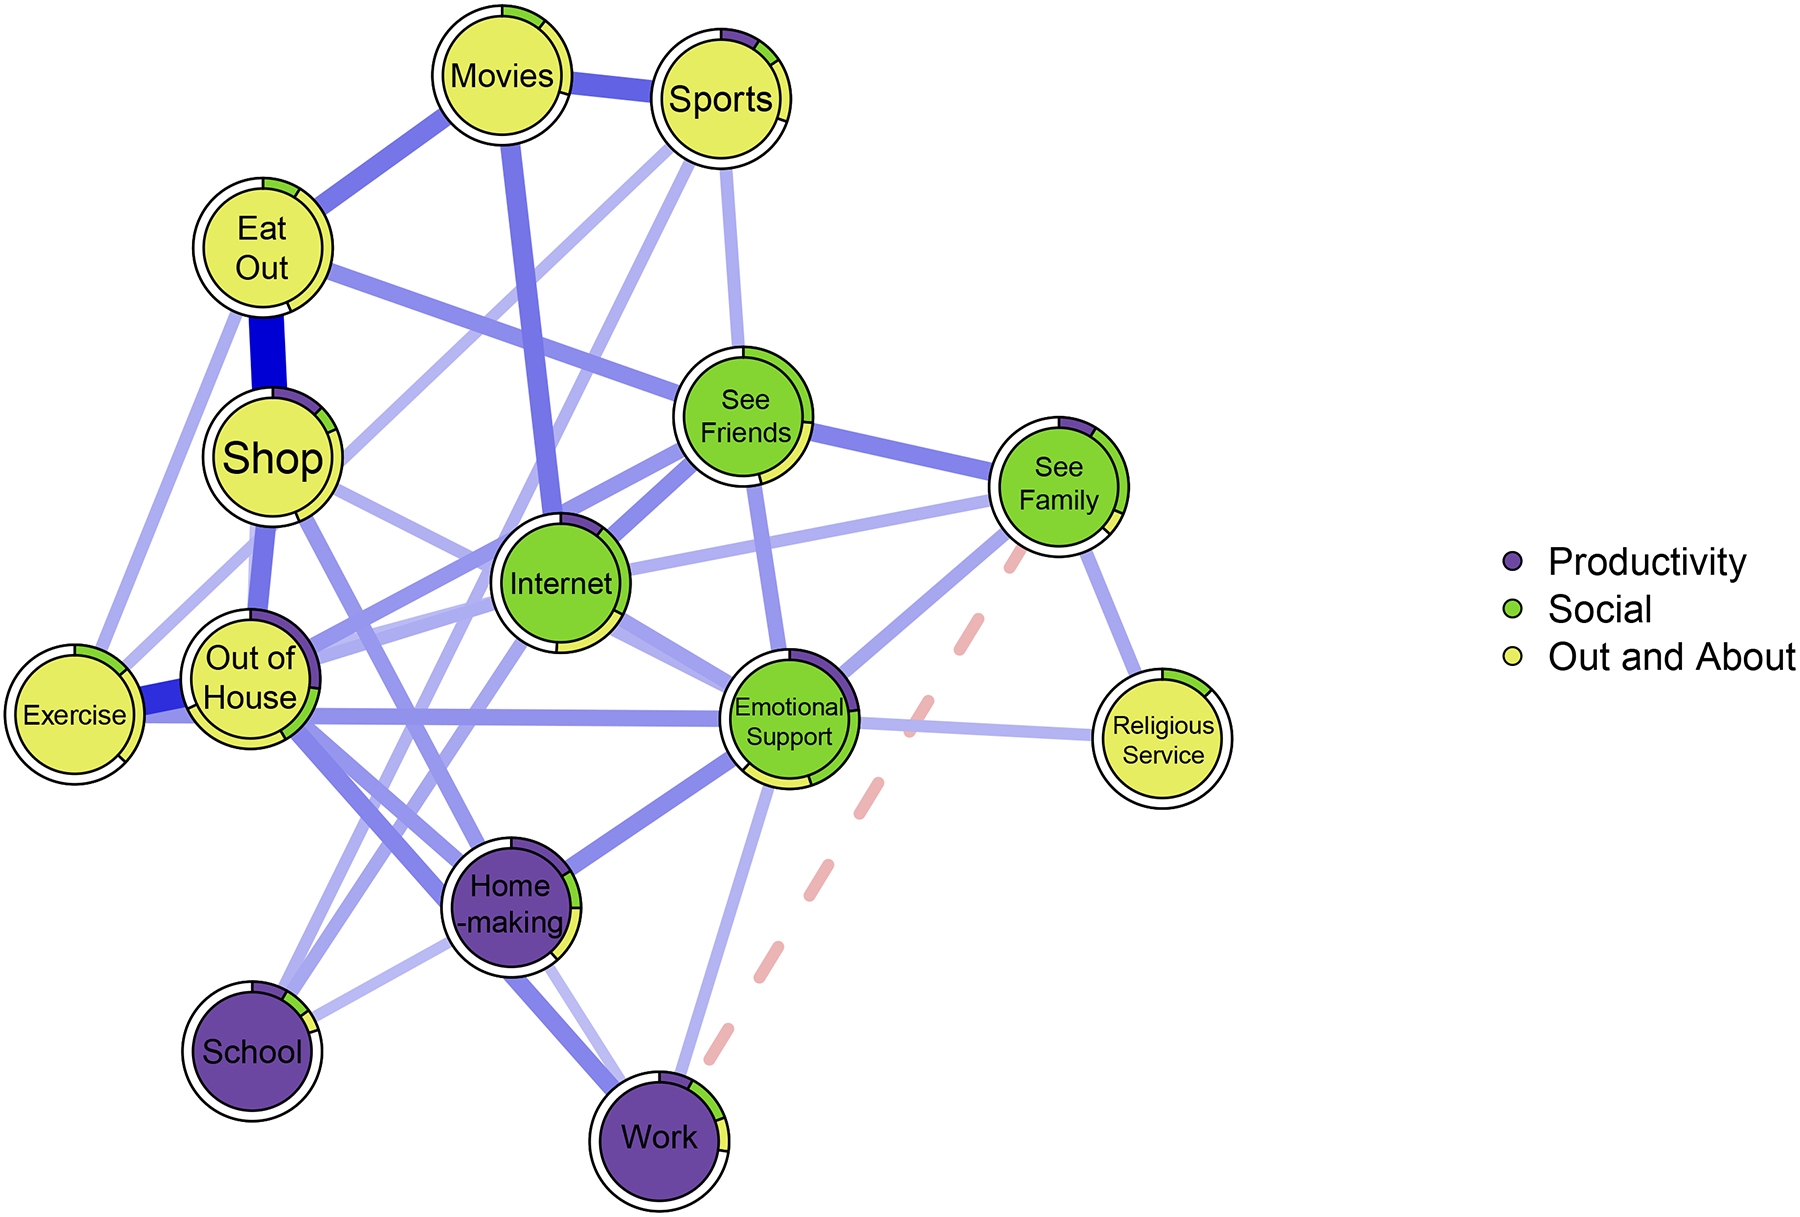
Note. N = 663. Solid/blue edges indicate positive associations and dashed/red edges indicate negative associations. Edge width and depth of color indicates the strength of associations. Colors around a given node indicate the proportion of variance in that node that loads on to a given community factor. White space surrounding node indicates the proportion of variance in each node that was not accounted for.
Figure 2. PART-O network at T2.

Note. N = 641. Solid/blue edges indicate positive associations and dashed/red edges indicate negative associations. Edge width and depth of color indicates the strength of associations. Colors around a given node indicate the proportion of variance in that node that loads on to a given community factor. White space surrounding node indicates the proportion of variance in each node that was not accounted for.
However, we did not include all items from the PART-O in the current analysis. We used the 14 items from the PART-O-17 assessing frequency of activities over a specific time (e.g., “In a typical month…”), and we excluded three items (spouse, intimate relationship, and close friend) that used dichotomous response options scored as No = 0 and Yes = 5. The three dichotomous items were the only items structured as yes/no questions about a respondent’s current state, whereas the remaining 14 inquired about the frequency of behaviors over a specific period. Given the profound divergence of semantic structure and the different cognitive processes involved in responding to such questions (i.e., retrospective vs. semantic information), partial correlations between such item types would be challenging to interpret. Likewise, including more items would necessarily provide less power to our analyses (e.g., network invariance testing). The spouse item is also multicollinear and nearly fully redundant with the intimate relationship item (instructions read, “When Item 15 is Yes, assign score of 5 to both Q15 and Q16”); therefore, it is inappropriate to include both of these items in a quantitative psychometric evaluation.
We estimated networks using the estimateNetwork function in the bootnet package for R version 4.1.1.20 We used the ggmModSelect estimation routine, which estimates each network 100 times before conducting a stepwise modification process to select the best-fitting network model according to the Extended Bayesian Information Criterion (EBIC).21 Network stability and accuracy were examined by two 5,000-sample bootstraps (i.e., case-dropping and non-parametric, respectively) using the bootnet package.20 Listwise deletion was used for missing values. The average network layout across T1 and T2 was computed using the averageLayout function from the qgraph package prior to visualization to aid in comparison.22 We compared our networks using the NetworkComparisonTest package for R and Spearman’s rank-order correlations.23 We estimated network community loading values for each node in relation to the three communities to identify bridge nodes using the net.loadings function from the EGAnet package for R.24
Results
Characteristics of Sample
There were originally 1,526 participants enrolled in the overall study; of these, 637 did not have complete PART-O data at either T1 or T2 and therefore were excluded. The remaining sample comprised 889 participants, which reduced to 663 at T1 and 641 at T2, respectively, after listwise deletion to select cases with complete PART-O data at either time point (415 participants had complete data cross both time points). The PART-O (excluding the three dichotomous items) exhibited appropriate internal consistency at both time points (T1 Cronbach’s α = .77; T2 Cronbach’s α = .75). Sociodemographic and injury-related characteristics of the included and excluded samples are presented in Table 1, with p-values comparing the two samples based on chi-squared statistics or analyses of variance. Descriptive statistics for all other variables are available in Table 3.
Table 1.
Included and excluded sample characteristics.
| Variable | Included M (SD) or n (%) n = 889 |
Excluded M (SD) or n (%) n = 637 |
p-value |
|---|---|---|---|
| Sex (%) | .826 | ||
| Male | 833 (93.7%) | 597 (93.7%) | |
| Female | 53 (6.0%) | 36 (5.7%) | |
| Unknown/Missing | 3 (.3%) | 4 (.6%) | |
| Race/Ethnicity* | |||
| Hispanic/Latino/Spanish | 110 (12.8%) | 102 (17.0%) | .018 |
| White | 693 (80.6%) | 483 (80.8%) | .426 |
| Black or African American | 105 (12.2%) | 65 (11.0%) | .524 |
| Asian | 39 (4.6%) | 15 (2.5%) | .096 |
| American Indian or Alaskan Native | 44 (5.1%) | 22 (3.7%) | .309 |
| Native Hawaiian or other Pacific Islander | 17 (2.0%) | 14 (2.4%) | .599 |
| Injury Severity (GCS Score) | < .001 | ||
| Mild (14–15) | 217 (24.4%) | 113 (17.7%) | |
| Moderate (9–13) | 98 (11.0%) | 32 (5.0%) | |
| Severe (3–8) | 229 (25.8%) | 95 (14.9%) | |
| No Acute Hospitalization | 49 (5.5%) | 206 (32.3%) | |
| Chemically Sedated | 82 (9.2%) | 24 (3.8%) | |
| Intubated | 105 (11.8%) | 36 (5.7%) | |
| Unknown | 105 (11.8%) | 117 (18.4%) | |
| Age at Injury | 36.88 (15.60) | 34.31 (12.91) | < .001 |
| Time to Follow Commands (days) | 22.72 (57.24) | 34.93 (170.19) | .097 |
| Posttraumatic Amnesia (days) | 61.90 (117.35) | 86.79 (390.76) | .143 |
| Cause of Injury | < .001 | ||
| Vehicular | 458 (51.8%) | 205 (32.2%) | |
| Gunshot Wound | 37 (4.2%) | 13 (2.1%) | |
| Assaults with Blunt Instrument | 35 (4.0%) | 22 (3.5%) | |
| Other Violence | 125 (14.1%) | 209 (33.2%) | |
| Sports | 19 (2.1%) | 25 (3.9%) | |
| Fall | 153 (17.3%) | 114 (18.1%) | |
| Hit by Falling/Flying Object | 11 (1.2%) | 13 (2.1%) | |
| Pedestrian | 33 (3.7%) | 14 (2.2%) | |
| Other | 10 (1.1%) | 13 (2.1%) | |
| Unknown | 4 (.5%) | 2 (.3%) |
Note.
For race/ethnicity, participants selected all categories that applied; as a result, chi-squared comparisons were made for each category.
Table 3.
Absolute network community loadings, cross-loading sums, and item means and SDs from the T1 and T2 networks.
| Node | Productivity | Social | Out & About | CL Sum | Mean | SD |
|---|---|---|---|---|---|---|
| Time 1 | ||||||
| Homemaking | 0.16 | 0.09 | 0.13 | 0.22 | 1.82 | 1.47 |
| Religious Service | 0.00 | 0.13 | 0.00 | 0.13 | 1.17 | 1.81 |
| Eat Out | 0.00 | 0.09 | 0.35 | 0.09 | 1.39 | 1.09 |
| Emotional Support | 0.23 | 0.22 | 0.17 | 0.40 | 1.25 | 1.18 |
| Exercise | 0.00 | 0.14 | 0.23 | 0.14 | 1.98 | 1.66 |
| Internet | 0.10 | 0.22 | 0.19 | 0.29 | 2.16 | 1.81 |
| Movies | 0.00 | 0.11 | 0.19 | 0.11 | 0.73 | 1.10 |
| Out of House | 0.27 | 0.14 | 0.26 | 0.42 | 2.70 | 1.35 |
| School | 0.08 | 0.07 | 0.05 | 0.12 | 0.33 | 0.98 |
| See Family | 0.09 | 0.22 | 0.06 | 0.15 | 2.19 | 1.47 |
| See Friends | 0.00 | 0.26 | 0.19 | 0.19 | 1.85 | 1.42 |
| Shop | 0.12 | 0.06 | 0.25 | 0.18 | 1.43 | 1.03 |
| Sports | 0.09 | 0.06 | 0.15 | 0.16 | 0.49 | 1.09 |
| Work | 0.08 | 0.12 | 0.08 | 0.19 | 1.37 | 2.15 |
| Time 2 | ||||||
| Homemaking | 0.21 | 0.12 | 0.12 | 0.24 | 1.97 | 1.47 |
| Religious Service | 0.00 | 0.10 | 0.10 | 0.10 | 1.29 | 1.82 |
| Eat Out | 0.00 | 0.15 | 0.26 | 0.15 | 1.38 | 1.01 |
| Emotional Support | 0.18 | 0.39 | 0.00 | 0.18 | 1.31 | 1.27 |
| Exercise | 0.20 | 0.09 | 0.20 | 0.29 | 1.96 | 1.63 |
| Internet | 0.21 | 0.18 | 0.16 | 0.36 | 2.36 | 1.84 |
| Movies | 0.00 | 0.05 | 0.24 | 0.05 | 0.72 | 1.11 |
| Out of House | 0.10 | 0.06 | 0.36 | 0.17 | 2.72 | 1.25 |
| School | 0.10 | 0.07 | 0.04 | 0.11 | 0.49 | 1.19 |
| See Family | 0.00 | 0.23 | 0.12 | 0.12 | 2.11 | 1.45 |
| See Friends | 0.00 | 0.28 | 0.18 | 0.18 | 1.73 | 1.43 |
| Shop | 0.12 | 0.00 | 0.34 | 0.12 | 1.48 | 0.99 |
| Sports | 0.00 | 0.12 | 0.21 | 0.12 | 0.53 | 1.12 |
| Work | 0.11 | 0.07 | 0.07 | 0.13 | 1.32 | 2.10 |
Note. CL = cross-loading. NT1 = 663, NT2 = 641.
Network Analysis
Distributions of each item across both time points revealed skew ranging from mild to severe. Because such skew in psychometric networks can bias estimates of centrality, we treated all items with the non-paranormal transformation as is commonly applied in network analysis25, thereby reducing skew adequately in both samples. Our networks yielded appropriate stability and accuracy resultant from our bootstrap procedures (see Supplemental Document 1 for details). The edge weight estimates from our networks and their bootstrapped values are available in Supplemental Document 1 (Tables S1 and S2). Both networks were relatively dense, finding 34 and 33 out of 91 possible edges at T1 and T2, respectively (density = .37; .36).
Network Comparisons
Our network comparison test (NCT) revealed that the structure of the PART-O network was invariant over time (M = .21, p = .184), as was the global strength of the networks (S = .13, p = .684). To further quantify the similarity of networks across time points we computed a Spearman’s rank-order coefficient examining the strength of edges at both time points. This analysis revealed that the T1–T2 networks largely agreed with one another (rs = .58, p < .001), though some variation between them was observed, suggesting that our NCT omnibus test may have been underpowered to detect structural differences. We thus examined individual edge weight comparisons after applying the false discovery rate correction to the corresponding p-values to explore the variation between time points. The only significant difference between time points was the See Friends–Emotional Support edge. At T1, this edge had a weight of .15 and at T2, this edge more than doubled in strength to .37 (p < .001). Another clear difference between the time points was that the negative Work—SeeFamily edge observed at T1 was not present in at T2. However, the strength centrality of each individual node was found to be invariant across time (all ps > .97).
Centrality Estimates
The centrality estimates for both time points, as well as item content corresponding to each node, are found in Table 2. The Out of House node was the most central at both time points given its relatively dense connections with nodes from all three communities. The Emotional Support node was the most central among the Social Relations community on average, and the Homemaking node was the most central to the Productivity community.
Table 2.
Strength centrality estimates from the T1 and T2 networks.
| Node | Item Content | Community | T1 | T2 |
|---|---|---|---|---|
| Homemaking | Time spent homemaking, cleaning, cooking, parenting (weekly) | Productivity | 0.68 | 0.77 |
| Religious Service | Instances of attending religious services (monthly) | Out and About | 0.24 | 0.42 |
| Eat Out | Instances of eating in a restaurant (monthly) | Out and About | 0.96 | 0.89 |
| Emotional Support | Instances of giving emotional support to others (weekly) | Social | 1.09 | 0.96 |
| Exercise | Instances of engaging in sports or exercise outside home (monthly) | Out and About | 0.80 | 0.89 |
| Internet | Instances of using the Internet for communication (weekly) | Social | 0.98 | 0.96 |
| Movies | Instances of going to movies (monthly) | Out and About | 0.64 | 0.67 |
| Out of House | Instances of getting out the house to go somewhere (weekly) | Out and About | 1.22 | 1.09 |
| School | Time spent in school or technical training program (weekly) | Productivity | 0.35 | 0.34 |
| See Family | Instances of socializing with family and relatives (weekly) | Social | 0.67 | 0.72 |
| See Friends | Instances of socializing with friends (weekly) | Social | 0.96 | 0.97 |
| Shop | Instances of shopping for groceries, household, or pleasure (monthly) | Out and About | 0.85 | 0.96 |
| Sports | Instances of attending sporting events as spectator (monthly) | Out and About | 0.58 | 0.72 |
| Work | Time spent working for money (weekly) | Productivity | 0.50 | 0.43 |
Note. T1 = Time 1, T2 = Time 2. NT1 = 663, NT2 = 641.
The Social Relations community exhibited the greatest degree of strength centrality on average (T1: .93, T2: .90) as compared to the Productivity (T1: .51, T2: .51) and Out and About (T1: .76, T2: .87) communities. Indeed, several Social Relations nodes (e.g., the Internet and Emotional Support nodes) shared relatively strong positive edges with other nodes in and outside of the Social Relations community at both time points. The relatively lower average strength centrality found from the Out and About community was due to nodes that were largely peripheral to the network and shared few edges with other nodes (e.g., the “Movies” and “Religious Service” nodes). Similarly, the nodes comprising the Productivity community yielded some of the lowest centrality estimates at both time points (Table 2).
Community Cross-Loadings
At T1, the Emotional Support, Internet, and Out of House nodes emerged as the strongest bridges (Table 3, which also includes item means and standard deviations for reference). Emotional support evinced a relatively strong cross-loading with the Productivity community (.23) and modest loading with the Out and About community (.17). The Internet node produced relatively weak cross-loading with the Productivity community (.10) and modest cross-loading with the Out and About community (.19). Finally, the Out of the House node yielded a relatively strong cross-loading with the Productivity community (.27) and modest cross-loading with the Social Relations community (.14). The Internet node was the strongest bridge at T2 and again evinced a modest cross-loading with the Out and About community (.16) and relatively strong cross-loading with the Productivity community (.21). The next two strongest bridge nodes were different at T2. Exercise yielded a strong cross-loading with the Productivity community (.20) and a weak cross-loading with the Social Relations community (.09). Finally, the Homemaking node emerged as the third strongest bridge at T2 due to its relatively weak cross-loadings with the Social Relations (.12) and Out and About (.12) communities.
Discussion
The current study applied psychometric network analysis to PART-O responses from SM/Vs with a history of TBI one- and two-years post injury. Considering all domains of participation measured, the Social Relations community demonstrated greater strength centrality relative to both the Productivity and the Out and About communities. The nodes within the Social Relations community shared multiple edges with nodes in other communities. This finding suggests potential overlap in the activities represented across the three domains of the PART-O and is consistent with past literature indicating the importance of relationships to individuals with TBI.26–28 For example, socializing with friends (Social Relations) could occur in the context of attending sporting events (Out and About); likewise, using the Internet for communication (Social Relations) could occur in the context of work or school (Productivity). The lower strength centrality of certain nodes in the Out and About community (e.g., attending religious services) could reflect an overall decline in these activities among the general population and explain why these same items had a much lower probability of being endorsed by participants in the TBIMS.6 Another interpretation is that enhanced participation associated with attending religious services is based on the quality of social interactions and support one receives rather than religiosity itself.29 In the context of our network, all the variance attributable to social factors was already accounted for and thus the remaining variance shared with the religious attendance node was little.
The network invariance test indicated the overall structure of participation did not change between measurements, though two notable differences between networks emerged. First, the edge between seeing friends and providing emotional support to others more than doubled in strength from T1 to T2. Providing emotional support to others can be challenging for individuals with significant cognitive, linguistic, or neurobehavioral impairments related to TBI.30 The doubling of this edge from T1 to T2 suggests the nature of time spent with friends changed, such that respondents might have been able to incorporate the provision of emotional support more frequently into their interpersonal interactions. Second, the negative edge observed between work and seeing family at T1 did not emerge at T2. Such a change in association between these two nodes from T1 to T2 might represent transition back to work after a period of time during which family were more involved in recovery. For less severe injuries that did not necessarily preclude work, it might represent improvement in symptoms that could have interfered with activities outside of work. For example, work-related fatigue among those recovering from TBI has been found to be a barrier to other forms of participation.31
Our network cross-loading estimates yielded further insight into participation as measured by the PART-O. These estimates indicated that communication via the Internet was one of the most important bridges at both time points, with particularly strong cross-loadings to the Productivity community, likely reflecting the ubiquity of the Internet in contemporary life. Previous analyses of TBIMS data indicated that Internet use—particularly social media—was higher when individuals were employed or were students compared to those who were unemployed or retired.32 Similar to prior research, there was also a strong connection between social Internet use and both social relationships and being out and about engaged in community activities.33 Online social activity could foster real world socializing, enable alternative means for providing social support, and allow individuals with TBI to find available and accessible community activities.33 Interestingly, one node that yielded low bridge centrality at T1 (Exercising) was one of the three most important bridges at Time 2. This finding suggests increased exercise may be an important hallmark of recovery—like providing emotional support—that is associated with improvement in other domains.
Some of the current findings likely reflect fundamental challenges associated with measuring a construct like participation. For example, the structure of the Productivity community would suggest this domain is ill-defined (e.g., the homemaking, work, and school nodes loaded on all three communities, sometimes more strongly than on the Productivity community). However, this finding likely reflects the PART-O’s intentional design to assess aspects of participation that are clinically meaningful, though not necessarily hierarchically related.34 Relatedly, the three Productivity items could be confounded with social roles or life course/development such that they describe a person’s life stage rather than measure the construct of participation.11 In a previous study, Productivity showed marked differences across the lifespan after moderate-to-severe TBI, with progressively lower Productivity in older age—a trend that was not observed among Out and About or Social Relations.35
Finally, being out of the house was the single-most central node overall. Despite this centrality, this node described an activity that is inherent to many of the other activities across all three communities. Given this overlap, the centrality values of this node are likely to be artificially inflated. Although being out of the house represents an important aspect of participation, the content of this item is less specific when compared to some of the more granular items across other communities and possibly too general to yield meaningful information in the context of our networks.
Limitations of Data and Analyses
Though utilized in a number of fields, psychometric network analysis is still a novel approach in psychological and rehabilitation research.36,37 The PART-O captured only self-report data gathered retrospectively from the participant or a proxy, which may influence the results through desirability bias. Additionally, three dichotomous items were excluded from analysis, which focused on whether participants had significant intimate relationships (presence of intimate relationship, presence of close friend, and living with spouse/significant other). As such, the analysis does not assess the impact of closest interpersonal relationships on participation. However, despite our exclusion of these items the Social Relations nodes were still some of the most important in our networks. Future work should examine what these items contribute to this facet of the PART-O in terms of measurement. Further, we note that PNA applied to cross-sectional data as in the current study cannot provide evidence of causal links. As such, we caution readers that our networks are meant to provide an exploratory basis for the generation and testing of novel hypotheses.
Another limitation of our analytic plan was that static associations were modeled between items, hindering the ability to assess dynamic changes.38 However, the current analysis utilized iterative T1 and T2 data to examine change in the structure of participation which provided temporal insights through diminishing and strengthening associations. Future studies should investigate the rate of change between these nodes and the extent to which these changes drive participation over longer periods of time with a greater number of measurements. Our network comparison test failed to indicate a significant difference between our networks. The NetworkComparisonTest package was developed to be sensitive to network variations, such that a single edge missing in one network is typically enough to render them significantly different.23 However, according to a simulation study on the NCT, our omnibus comparison was likely underpowered to detect global network differences, as network comparisons between networks that are relatively dense with samples less than N = 750 are at risk of false negatives on the NCT omnibus tests.23 As such, future work with larger samples is needed to further confirm our findings from the edge-level comparisons.
Finally, the results of this network analysis are necessarily impacted by the limitations on generalizability imposed by our sample. For example, the current sample was predominantly male, with moderate-to-severe TBI, and service members and veterans; therefore, the results might not generalize to more heterogeneous populations.37 Relative to the included analytic sample, the excluded sample without complete PART-O data at either follow-up period was more likely to be Hispanic, had a higher proportion of no acute hospitalization, had younger age at injury, had a lower proportion of vehicular cause of injury, and had higher proportion of other violence as a cause of injury. As a result, the current findings might not apply well to individuals with TBI from these groups, and future applications of network analyses should include more diverse samples and a broader range of injury severity.
Conclusion
Participation is consistently reported as one of the most important outcomes for people with brain injuries and their families, and it is also one of the most difficult to operationalize and measure.38 Here we applied network analysis, which offers an empirical approach to visualizing and quantifying the relationships between constructs that comprise participation in a large sample of SM/Vs with a history of TBI. At both 1 and 2 years following injury, social and interpersonal aspects of participation predominated, illustrating the importance of seeing friends, providing emotional support to others, and having social relationships with others. These findings provide avenues for future research on participation among those with TBI and demonstrate the utility of applying psychometric network analysis to such data.
Supplementary Material
Acknowledgements
The views expressed in this publication are those of the authors and do not necessarily represent the official policy or position of the Defense Health Agency, Department of Defense, or any other U.S. government agency. This work was prepared under Contract HT0014-19-C-0004 with DHA Contracting Office (CO-NCR) HT0014 and, therefore, is defined as U.S. Government work under Title 17 U.S.C.§101. Per Title 17 U.S.C.§105, copyright protection is not available for any work of the U.S. Government. For more information, please contact dha.TBICOEinfo@mail.mil. UNCLASSIFIED
Contributor Information
Samuel J. West, Department of Surgery, Virginia Commonwealth University, Richmond, VA
Daniel W. Klyce, Central Virginia Veterans Affairs Health Care System, Richmond, VA Virginia Commonwealth University Health System, Richmond, VA; Sheltering Arms Institute, Richmond, VA.
Paul B. Perrin, Central Virginia Veterans Affairs Health Care System, Richmond, VA Department of Psychology and Department of Physical Medicine and Rehabilitation, Virginia Commonwealth University, Richmond, VA.
Shannon B. Juengst, The Institute for Rehabilitation Research, Memorial Hermann, Houston, TX
Kristen Dams-O’Connor, Department of Rehabilitation and Human Performance, Icahn School of Medicine at Mount Sinai, New York, NY Department of Neurology, Icahn School of Medicine at Mount Sinai, New York, NY.
Tiffanie A. Vargas, Central Virginia Veterans Affairs Health Care System, Richmond, VA.
Ria Grover, Virginia Commonwealth University, Richmond, VA.
Jacob A. Finn, Rehabilitation & Extended Care Patient Service Line, Minneapolis VA Health Care System, Minneapolis, MN Psychiatry and Behavioral Sciences, University of Minnesota – Twin Cities, Minneapolis, MN.
CB Eagye, Department of Research, Craig Hospital, Englewood, CO.
Stephanie D. Agtarap, Department of Research, Craig Hospital, Englewood, CO
Joyce S. Chung, VA Palo Alto Health Care System, Polytrauma System of Care, Palo Alto, CA
Thomas A. Campbell, Central Virginia VA Health Care System
References
- 1.Cifu DX, Taylor BC, Carne WF, et al. Traumatic brain injury, posttraumatic stress disorder, and pain diagnoses in OIF/OEF/OND Veterans. J Rehabil Res Dev. 2013;50(9):1169–1176. [DOI] [PubMed] [Google Scholar]
- 2.Hendricks AM, Amara J, Baker E, et al. Screening for mild traumatic brain injury in OEF-OIF deployed US military: an empirical assessment of VHA’s experience. Brain Inj. 2013;27(2):125–134. doi: 10.3109/02699052.2012.729284 [DOI] [PubMed] [Google Scholar]
- 3.DoD TBI Worldwide Numbers. Military Health System. Accessed February 22, 2021. http://health.mil/About-MHS/OASDHA/Defense-Health-Agency/Research-and-Development/Traumatic-Brain-Injury-Center-of-Excellence/DoD-TBI-Worldwide-Numbers [Google Scholar]
- 4.Wardlaw C, Hicks AJ, Sherer M, Ponsford JL. Psychological Resilience Is Associated With Participation Outcomes Following Mild to Severe Traumatic Brain Injury. Front Neurol. 2018;9. doi: 10.3389/fneur.2018.00563 [DOI] [PMC free article] [PubMed] [Google Scholar]
- 5.Bogner J, Bellon K, Kolakowsky-Hayner SA, Whiteneck G. Participation Assessment With Recombined Tools–Objective (PART-O). J Head Trauma Rehabil. 2013;28(4):337–339. doi: 10.1097/HTR.0b013e31829af969 [DOI] [PubMed] [Google Scholar]
- 6.Malec JF, Whiteneck GG, Bogner JA. Another Look at the PART-O Using the Traumatic Brain Injury Model Systems National Database: Scoring to Optimize Psychometrics. Arch Phys Med Rehabil. 2016;97(2):211–217. doi: 10.1016/j.apmr.2015.09.001 [DOI] [PubMed] [Google Scholar]
- 7.Bogner JA, Whiteneck GG, Corrigan JD, Lai JS, Dijkers MP, Heinemann AW. Comparison of Scoring Methods for the Participation Assessment With Recombined Tools–Objective. Arch Phys Med Rehabil. 2011;92(4):552–563. doi: 10.1016/j.apmr.2010.11.014 [DOI] [PubMed] [Google Scholar]
- 8.Willer B, Ottenbacher KJ, Coad ML. The community integration questionnaire. A comparative examination. Am J Phys Med Rehabil. 1994;73(2):103–111. doi: 10.1097/00002060-199404000-00006 [DOI] [PubMed] [Google Scholar]
- 9.Brown M, Dijkers MPJM, Gordon WA, Ashman T, Charatz H, Cheng Z. Participation objective, participation subjective: a measure of participation combining outsider and insider perspectives. J Head Trauma Rehabil. 2004;19(6):459–481. doi: 10.1097/00001199-200411000-00004 [DOI] [PubMed] [Google Scholar]
- 10.Whiteneck GG, Charlifue SW, Gerhart KA, Overholser JD, Richardson GN. Quantifying handicap: a new measure of long-term rehabilitation outcomes. Arch Phys Med Rehabil. 1992;73(6):519–526. [PubMed] [Google Scholar]
- 11.Juengst SB, Adams LM, Bogner JA, et al. Trajectories of life satisfaction after traumatic brain injury: Influence of life roles, age, cognitive disability, and depressive symptoms. Rehabil Psychol. 2015;60(4):353–364. doi: 10.1037/rep0000056 [DOI] [PMC free article] [PubMed] [Google Scholar]
- 12.Borsboom D, Deserno MK, Rhemtulla M, et al. Network analysis of multivariate data in psychological science. Nat Rev Methods Primer. 2021;1(1):1–18. doi: 10.1038/s43586-021-00055-w [DOI] [Google Scholar]
- 13.Larsson J, Björkdahl A, Esbjörnsson E, Sunnerhagen KS. Factors affecting participation after traumatic brain injury. J Rehabil Med. 2013;45(8):765–770. doi: 10.2340/16501977-1184 [DOI] [PubMed] [Google Scholar]
- 14.Lamberty GJ, Nakase-Richardson R, Farrell-Carnahan L, et al. Development of a traumatic brain injury model system within the Department of Veterans Affairs Polytrauma System of Care. J Head Trauma Rehabil. 2014;29(3):E1–7. doi: 10.1097/HTR.0b013e31829a64d1 [DOI] [PubMed] [Google Scholar]
- 15.Whiteneck GG, Dijkers MP, Heinemann AW, et al. Development of the participation assessment with recombined tools-objective for use after traumatic brain injury. Arch Phys Med Rehabil. 2011;92(4):542–551. doi: 10.1016/j.apmr.2010.08.002 [DOI] [PubMed] [Google Scholar]
- 16.Hart T, Sherer M, Temkin N, et al. Participant-proxy agreement on objective and subjective aspects of societal participation following traumatic brain injury. J Head Trauma Rehabil. 2010;25(5):339–348. doi: 10.1097/HTR.0b013e3181c7e60b [DOI] [PubMed] [Google Scholar]
- 17.Schwertfeger J, Kuchler-O’Shea R, Engel E, Ehrlich-Jones L. Measurement Characteristics and Clinical Utility of the Participation With Recombined Tools-Objective Measure in a Traumatic Brain Injury Population. Arch Phys Med Rehabil. 2020;101(7):1269–1270. doi: 10.1016/j.apmr.2020.03.002 [DOI] [Google Scholar]
- 18.Fried EI, Eidhof MB, Palic S, et al. Replicability and Generalizability of Posttraumatic Stress Disorder (PTSD) Networks: A Cross-Cultural Multisite Study of PTSD Symptoms in Four Trauma Patient Samples. Clin Psychol Sci. 2018;6(3):335–351. doi: 10.1177/2167702617745092 [DOI] [PMC free article] [PubMed] [Google Scholar]
- 19.Christensen AP, Garrido LE, Golino H. What is bridge centrality? A comment on Jones, Ma, and McNally (2019). Published online January 20, 2021. doi: 10.31234/osf.io/a8svr [DOI] [Google Scholar]
- 20.Epskamp S, Borsboom D, Fried EI. Estimating psychological networks and their accuracy: A tutorial paper. Behav Res Methods. 2018;50(1):195–212. doi: 10.3758/s13428-017-0862-1 [DOI] [PMC free article] [PubMed] [Google Scholar]
- 21.Epskamp S, Fried EI. A tutorial on regularized partial correlation networks. Psychol Methods. 2018;23(4):617–634. doi: 10.1037/met0000167 [DOI] [PubMed] [Google Scholar]
- 22.Epskamp S, Cramer AOJ, Waldorp LJ, Schmittmann VD, Borsboom D. qgraph: Network Visualizations of Relationships in Psychometric Data. J Stat Softw. 2012;48:1–18. doi: 10.18637/jss.v048.i04 [DOI] [Google Scholar]
- 23.van Borkulo C, van Bork R, Boschloo L, et al. Comparing Network Structures on Three Aspects: A Permutation Test.; 2017. doi: 10.13140/RG.2.2.29455.38569 [DOI] [PubMed] [Google Scholar]
- 24.Golino HF, Epskamp S. Exploratory graph analysis: A new approach for estimating the number of dimensions in psychological research. PloS One. 2017;12(6):e0174035. doi: 10.1371/journal.pone.0174035 [DOI] [PMC free article] [PubMed] [Google Scholar]
- 25.Zhao T, Liu H, Roeder K, Lafferty J, Wasserman L. The huge Package for High-dimensional Undirected Graph Estimation in R. :4. [PMC free article] [PubMed] [Google Scholar]
- 26.O’Keeffe F, Dunne J, Nolan M, Cogley C, Davenport J. “The things that people can’t see” The impact of TBI on relationships: an interpretative phenomenological analysis. Brain Inj. 2020;34(4):496–507. doi: 10.1080/02699052.2020.1725641 [DOI] [PubMed] [Google Scholar]
- 27.Schipper K, Visser-Meily JMA, Hendrikx A, Abma TA. Participation of people with acquired brain injury: Insiders perspectives. Brain Inj. 2011;25(9):832–843. doi: 10.3109/02699052.2011.589796 [DOI] [PubMed] [Google Scholar]
- 28.Townshend J, Norman A. The Secondary Impact of Traumatic Brain Injury: An Interpretative Phenomenological Analysis of the Experiences of Family and Friends. Fam J. 2018;26(1):77–85. doi: 10.1177/1066480717752905 [DOI] [Google Scholar]
- 29.Johnstone B, Yoon DP, Rupright J, Reid-Arndt S. Relationships among spiritual beliefs, religious practises, congregational support and health for individuals with traumatic brain injury. Brain Inj. 2009;23(5):411–419. doi: 10.1080/02699050902788501 [DOI] [PubMed] [Google Scholar]
- 30.Elbourn E, Togher L, Kenny B, Power E. Strengthening the quality of longitudinal research into cognitive-communication recovery after traumatic brain injury: A systematic review. Int J Speech Lang Pathol. 2017;19(1):1–16. doi: 10.1080/17549507.2016.1193896 [DOI] [PubMed] [Google Scholar]
- 31.Libeson L, Ross P, Downing M, Ponsford J. Exploring employment following traumatic brain injury in persons who completed an insurer funded vocational rehabilitation program in Australia. Disabil Rehabil. Published online October 24, 2021:1–11. doi: 10.1080/09638288.2021.1992516 [DOI] [PubMed] [Google Scholar]
- 32.Baker-Sparr C, Hart T, Bergquist T, et al. Internet and Social Media Use After Traumatic Brain Injury: A Traumatic Brain Injury Model Systems Study. J Head Trauma Rehabil. 2018;33(1):E9–E17. doi: 10.1097/HTR.0000000000000305 [DOI] [PMC free article] [PubMed] [Google Scholar]
- 33.Ketchum JM, Sevigny M, Hart T, et al. The Association Between Community Participation and Social Internet Use Among Adults With Traumatic Brain Injury. J Head Trauma Rehabil. 2020;35(4):254–261. doi: 10.1097/HTR.0000000000000566 [DOI] [PMC free article] [PubMed] [Google Scholar]
- 34.Whiteneck G, Dijkers MP. Difficult to Measure Constructs: Conceptual and Methodological Issues Concerning Participation and Environmental Factors. Arch Phys Med Rehabil. 2009;90(11):S22–S35. doi: 10.1016/j.apmr.2009.06.009 [DOI] [PubMed] [Google Scholar]
- 35.Erler KS, Kew CL, Juengst SB. Participation differences by age and depression 5 years after moderate-to-severe traumatic brain injury. Int Rev Psychiatry Abingdon Engl. 2020;32(1):12–21. doi: 10.1080/09540261.2019.1656175 [DOI] [PubMed] [Google Scholar]
- 36.Borsboom D, Cramer AOJ. Network Analysis: An Integrative Approach to the Structure of Psychopathology. Annu Rev Clin Psychol. 2013;9(1):91–121. doi: 10.1146/annurev-clinpsy-050212-185608 [DOI] [PubMed] [Google Scholar]
- 37.Klyce DW, West SJ, Perrin PB, et al. Network Analysis of Neurobehavioral and Post-Traumatic Stress Disorder Symptoms One Year after Traumatic Brain Injury: A Veterans Affairs Traumatic Brain Injury Model Systems Study. J Neurotrauma. 2021;38(23):3332–3340. doi: 10.1089/neu.2021.0200 [DOI] [PubMed] [Google Scholar]
- 38.Iverson GL. Network Analysis and Precision Rehabilitation for the Post-concussion Syndrome. Front Neurol. 2019;10:489. doi: 10.3389/fneur.2019.00489 [DOI] [PMC free article] [PubMed] [Google Scholar]
Associated Data
This section collects any data citations, data availability statements, or supplementary materials included in this article.