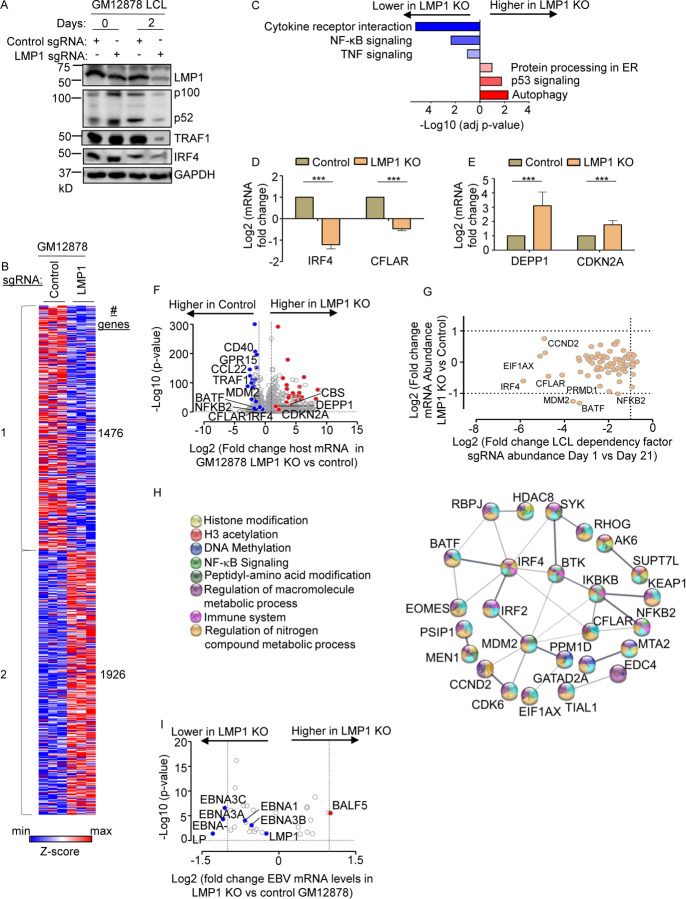
Fig. 1. Characterization of LMP1 KO effects on GM12878 LCL target gene regulation.
(A) Immunoblot analysis of whole cell lysates (WCL) from GM12878 LCLs transduced with lentiviruses that express control or LMP1 targeting single guide RNAs (sgRNAs). Transduced cells were puromycin selected for 0 vs 2 days, as indicated. Blots for LMP1, for LMP1 target genes TRAF1 and IRF4, and for LMP1-driven non-canonical NF-κB pathway p100/p52 processing are shown. Blots are representative of n=3 experiments.
(B) K-means heatmap analysis of GM12878 LCLs transduced as in (A) with lentivirus expressing control or LMP1 sgRNA and puromycin selected for 48 hours. The heatmap depicts relative Z-scores in each row from n=3 independent RNAseq replicates, divided into two clusters. The Z-score scale is shown at bottom, where blue and red colors indicate lower versus higher relative expression, respectively. Two-way ANOVA P-value cutoff of <0.01 and >2-fold gene expression cutoffs were used.
(C) Enrichr analysis of KEGG pathways most highly changed in GM12878 expressing control versus LMP1 sgRNA (LMP1 KO), as in (A). The X-axis depicts the −Log10 adjusted p-value (adj p-value) scale. The top three most enriched KEGG pathways are shown.
(D) Abundances of two representative Cluster 1 genes from n=3 RNAseq analyses in cells with control vs LMP1 sgRNA. p-values were determined by one-sided Fisher’s exact test. *p<0.05, **p<0.01.
(E) Abundances of two representative Cluster 2 genes from n=3 RNAseq analyses in cells with control vs LMP1 sgRNA. p-values were determined by one-sided Fisher’s exact test. ***p<0.001.
(F) Volcano plot analysis of host transcriptome-wide GM12878 genes differentially expressed in cells with control versus LMP1 sgRNA expression, as in (B), using data from n=3 RNAseq datasets.
(G) Scatter plot cross comparison of log2 transformed fold change mRNA abundances in GM12878 expressing LMP1 vs. control sgRNA (Y-axis) versus log2 transformed fold change abundances of sgRNAs at Day 21 versus Day 1 post-transduction of GM12878 LCLs in a genome-wide CRISPR screen (25) (X-axis).
(H) String analysis of genes shown in (G). Pathway identifiers for each gene and interaction are colored coded.
(I) Volcano plot analysis of EBV mRNA values in GM12878 expressing LMP1 vs control sgRNAs, as in (B). p-value <0.05 and >2-fold change mRNA abundance cutoffs were used.

