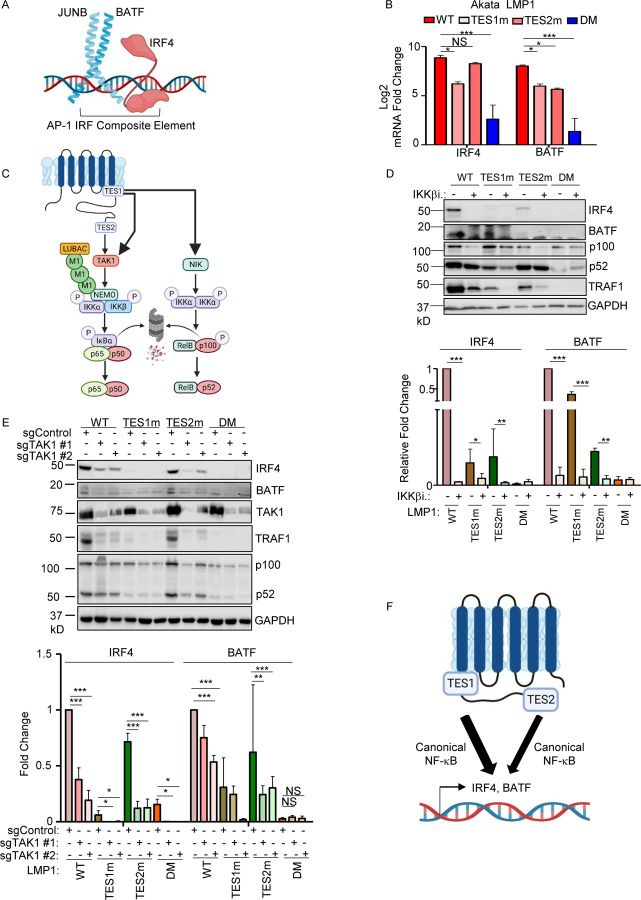
Fig. 8. Roles of TES1 and TES2 canonical NF-κB pathways in LCL dependency factor BATF and IRF4 expression.
(A) Schematic diagram of JUNB, BATF and IRF4 at an AP-1/IRF composite DNA site.
(B) Mean + SD fold changes of IRF4, BATF and JUNB mRNA abundances from n=3 RNAseq replicates of Akata cells expressing the indicated LMP1 cDNA for 24 hours, as in Fig. 5. p-values were determined by one-sided Fisher’s exact test. *p<0.05, ***p<0.001.
(C) Schematic diagram of LMP1 TES1 and TES2 NF-κB pathways. TES1 and TES2 each activate canonical NF-κB pathways, whereas TES1 also activates non-canonical NF-κB.
(D) Immunoblot analysis of WCL from Akata cells induced for LMP1 expression by 250 ng/ml Dox for 24 hours, either without or with 1 μM IKKβ inhibitor VIII. Shown below are relative fold changes + SD from n=3 replicates of IRF4 or BATF vs GAPDH load control densitometry values. Values in vehicle control treated WT LMP1 expressing cells were set to 1. P-values were determined by one-sided Fisher’s exact test. **p<0.001, ***p<0.0001.
(E) Immunoblot analysis of WCL from Cas9+ Akata cells expressing control or either of two TAK1 targeting sgRNAs, induced for LMP1 expression by 250 ng/ml Dox for 24 hours. Shown below are relative foldchanges + SD from n=3 replicates of IRF4 or BATF vs GAPDH load control densitometry values. Levels in cells with control sgRNA (sgControl) and WT LMP1 were set to 1. **p<0.001, ***p<0.0001.
(F) Model of additive TES1 and TES2 canonical NF-κB pathway effects on BATF and IRF4 induction.

