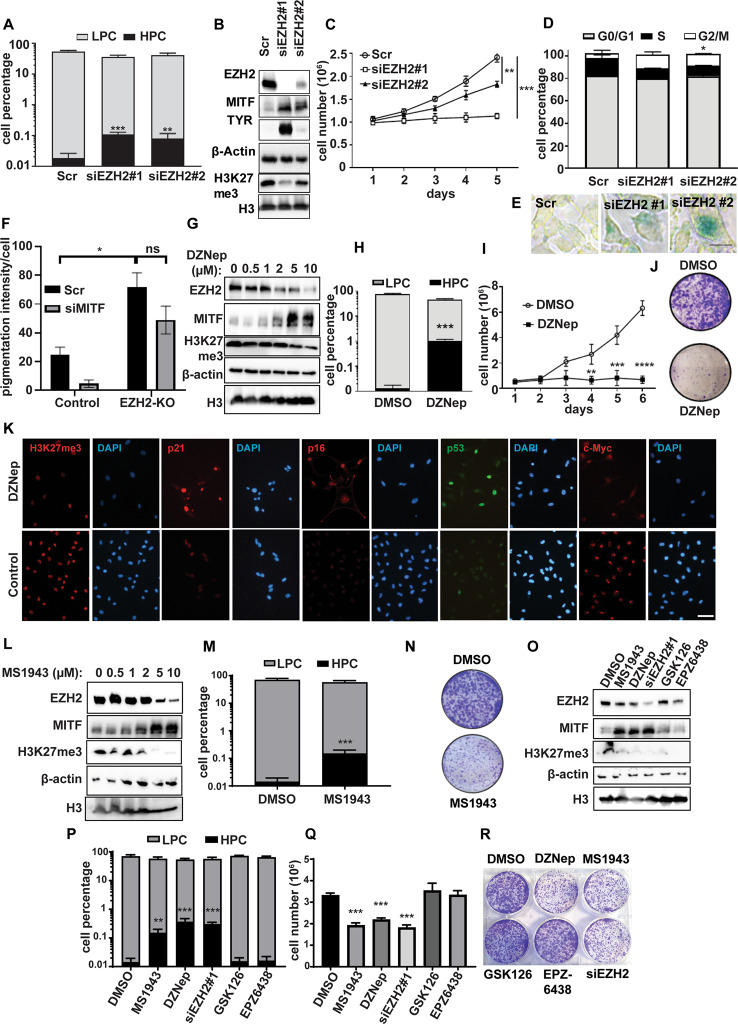
Fig. 2. Pharmacological inhibition of EZH2 abundance, but not of its methyltransferase activity, induces pigmented cell phenotypes in melanoma.
A–E B16-F10 murine melanoma cells were transfected with either of two siRNAs against Ezh2 or scrambled controls, and analysed as follows: A HPC and LPC cell percentages assessed by flow cytometry, (B) Ezh2, Mitf, Tyr and H3K27me3 protein levels measured by western blot, including β-actin and H3 as loading controls, (C) cell growth measured by Trypan blue cell counting over 5 days, (D) cell cycle analysis measured by propidium iodide staining, and (E) cell senescence determined by β-gal staining (green). F Control and EZH2-KO 28:B4:F3 cells transfected with scrambled control or siMITF were stained with Fontana Masson to measure pigmentation. G–K B16-F10 cells treated with 2 μM DZNep or DMSO (control) for 3 days were analysed for: (G) Ezh2, Mitf, and H3K27me3 expression by western blot, (H) HPC and LPC cell percentages by flow cytometry, (I) cell growth (7 days), (J) clonogenicity after low-density seeding (crystal violet stain), and (K) H3K27me3, p21, p16, p53, and c-Myc IF staining. Scale bar: 50 µm. L–O B16-F10 cells were treated with 2 μM MS1943 or DMSO (control) for 3 days prior to: (L) Western blot analysis of Ezh2, Mitf, and H3K27me3 protein levels, (M) evaluation of HPC and LPC cell percentages by flow cytometry, (N) and clonogenicity after low-density seeding (crystal violet stain). O–R B16-F10 cells were treated with 2 μM MS1943, 2 μM DZNep, siEzh2 #1, 2 µM GSK126, 2 µM EPZ6438 or DMSO (control) for 3 days prior to: (O) Western blot analysis of Ezh2, Tyr, and H3K27me3 expression, (P) evaluation of HPC and LPC cell percentages by flow cytometry, (Q) calculation of cell numbers counted by Trypan blue, and (R) clonogenicity estimation after low-density seeding (crystal violet stain). Clonogenicity was assessed in pre-treated (3 days) cells seeded at 2000 cells in 6-well plate followed by crystal violet staining (0.5% in methanol) after incubation for 10 days in drug-free media. Representative images of n = 3 biological replicates are shown for western blots (B, G, L, O), clonogenicity plates (J, N, R) and β-gal staining (E). Data for A, C, D, F, H, I, M, P and Q were derived from three independent experiments and are presented as means ± SD, analyzed by one-way ANOVA plus Tukey’s multiple comparison test. ns: non-significant. *p < 0.05, **p < 0.01, ***p < 0.001, ****p < 0.0001.

