

Abstract
Liver biopsy is essential for management in liver transplant patients with clinical features suspicious for acute cellular rejection (ACR). As more patients are transplanted for non-infectious indications, it has become increasingly common for them to receive treatment for presumed ACR before biopsy. The effect of pre-treatment on the classic histologic triad of ACR’s mixed portal inflammation, endothelialitis, and bile duct damage is not well described. Here we report a retrospective study of 70 liver transplant biopsies performed on 53 patients for suspected ACR between 2018 and 2021. Thirty-seven biopsies had a clinical diagnosis of ACR after biopsy. Pretreatment with steroids, anti-thymocyte globulin, or other increased immunosuppression was given before biopsy in 17 of 37 cases; 20 not-pretreated cases acted as controls. A representative hematoxylin-and-eosin-stained slide from each biopsy was reviewed independently in a blinded fashion by three hepatic pathologists, graded according to the Banff system, assigned a Rejection Activity Index (RAI), and assessed for other histologic features. We found that pretreated biopsies had significantly less portal inflammation (p<0.001), less endothelialitis (p<0.001), lower RAI (p<0.001), and less prominent eosinophils (p=0.048) compared to not-pretreated biopsies. There was no significant difference for the other examined variables, including bile duct inflammation/damage (p=0.32). Our findings suggest that portal inflammation and endothelialitis become less prominent with pre-treatment, while bile duct inflammation/damage may take longer to resolve. When evaluating biopsies for suspected ACR, the finding of bile duct inflammation/damage should raise the possibility of partially treated ACR, even in the absence of endothelialitis and portal inflammation.
Keywords: liver, acute cellular rejection, hepatic pathology, gastrointestinal pathology
1. Introduction
Liver biopsy is the gold standard for diagnosis of all types of rejection1 and is critical for guiding treatment in liver transplant patients with elevated liver tests or other clinical and laboratory findings suspicious for rejection. A diagnosis of acute cellular rejection (ACR) is based on the findings of mixed portal inflammation, endothelialitis, and bile duct inflammation/damage2. Mild ACR is treated with an increase in the patient’s immunosuppression and may not require steroid therapy. Moderate to severe ACR is treated with pulse steroid therapy followed by oral steroid taper, and steroid-resistant ACR is treated with anti-thymocyte globulin1. If no evidence of ACR is seen on biopsy, pathologic evaluation of the liver guides investigation into other causes of liver injury such as biliary tract obstruction, ischemia, infection, or drug injury.
Because histology is essential for a reliable diagnosis of rejection, the American Association for the Study of Liver Diseases (AASLD) and the American Society of Transplantation (AST) joint practice guidelines recommend that liver transplant patients should be biopsied prior to treatment3. Pathologic examination of the transplant liver is particularly essential in patients with a history of hepatitis C or other infections. Treating a liver transplant patient with increased immunosuppression when the patient has recurrent hepatitis C can result in increased active hepatitis, accelerated fibrosis progression, and elevated mortality risk4.
Major advancements in the clinical management of liver transplant patients have occurred since publication of the aforementioned AASLD/AST joint practice guidelines in 20133. The widespread availability of direct-acting antiviral therapies has substantially reduced the concern for hepatitis C recurrence in the posttransplant setting5. While hepatitis C was the leading indication for liver transplant in the United States until 20156, non-infectious causes of end-stage liver disease including alcoholic and nonalcoholic steatohepatitis are now responsible for a higher percentage of transplants6. Such hepatitis C-negative patients would be expected to have a lower risk of complications from increasing immunosuppression before biopsy, when the diagnosis of ACR is not definitively established.
These recent clinical advances have encouraged clinicians to consider empiric therapy prior to biopsy for clinically suspected ACR in certain circumstances to avoid delays in care. In general, rejection is clinically suspected with elevated liver tests in the absence of a significant vascular or biliary abnormality; the concern for ACR is also increased in those on less robust immunosuppression7. Changes in liver tests are not sensitive or specific for ACR, and agreement among clinicians in the decision to biopsy or empirically treat a patient for ACR is poor7. The decision as to whether or not to adjust a patient’s immunosuppression prior to biopsy (“pretreatment”) relies on subjective clinical judgement without specific guidelines to support this decision7. Pathologic interpretation of the liver transplant biopsy in pretreated patients remains vital for confirming the diagnosis of rejection or prompting a search for other sources of liver injury.
In liver transplant patients receiving empiric treatment for ACR before biopsy, the histologic features of treated or partially treated ACR are not well established. The purpose of this study was to define histologic features in pretreated liver transplant patients suspected of ACR to aid pathologists in the diagnosis of partially treated ACR.
2. Materials and Methods
This study was approved by the University of Utah Institutional Review Board (IRB #00091019). All liver transplant biopsies done in 2018–2021 were identified by a search of the pathology archives of the University of Utah. Biopsies without documented clinical suspicion for ACR were excluded. All subjects under the study had at least one biopsy. Biopsies from the same patient performed more than two months apart were considered separate episodes. Biopsies from separate episodes were included in the analysis. For biopsies from the same patient performed within two months, the later biopsy was excluded unless treatment was given between the biopsies, such that the two biopsies were from the same episode with the first being untreated and the second being pretreated as defined below. The classification of each biopsy as “pretreated” or “not pretreated” was made by retrospective review of clinical notes from before the biopsy. In “pretreated” biopsies, patients received IV steroids, another steroid regimen, anti-thymocyte globulin, or an increase in their immunosuppressive medications within one month prior to biopsy. Biopsies from patients who did not receive such adjustments in their immunosuppression period prior to biopsy were classified as “not pretreated”. Therefore, some subjects who have multiple biopsies belonged to pretreated and not-pretreated groups at the same time, as the groupings were defined by biopsies.
The determination of whether a biopsy performed for suspected rejection was actually related to ACR was made by retrospective review of clinical progress notes, which integrated biopsy results, laboratory values, imaging findings, and clinical features to formulate a working diagnosis in the weeks or months following each biopsy. Biopsies were classified as “confirmed ACR” if the clinical notes ascribed at least some of the liver injury to “ACR”, “rejection” and/or “an immune-mediated process”. Biopsies were classified as not having ACR if the clinical notes ascribed their liver injury in that episode to another etiology.
Clinical information and laboratory values were collected for each biopsy from review of the electronic medical record. We reviewed liver chemistries including AST, ALT, alkaline phosphatase, GGT, and total bilirubin from before and after biopsy. In untreated biopsies, pre-biopsy laboratory values were recorded from the collection time that alkaline phosphatase peaked within the two weeks prior to biopsy, as previously described8. In pretreated biopsies, pre-biopsy laboratory values were recorded from the collection time that alkaline phosphatase peaked within the two weeks prior to initiation of treatment. Post-biopsy values were recorded 2–4 weeks after biopsy regardless of biopsy classification.
Demographic and clinical information including sex, age, reason for liver transplant, age at transplant, time of biopsy since transplant, treatment regimen (when applicable), working clinical diagnosis after biopsy, clinical management, and clinical outcome post treatment were collected. The reasons for transplant were categorized as autoimmune and biliary, chronic viral hepatitis, alcoholic and/or non-alcoholic steatohepatitis, and other.
One hematoxylin and eosin-stained slide from each biopsy was reviewed retrospectively and independently by three attending hepatic pathologists (G.L.H., K.E.B., and K.J.E.) in a blinded fashion, with no laboratory values or specific clinical history available to the pathologists. Cases were given an overall impression (no ACR, indeterminate for ACR, mild ACR, moderate ACR, severe ACR; corresponding to a numerical ordinal score of 0 to 4), scored according to the Banff system, and assigned a Rejection Activity Index (RAI) score2. Cholestasis, ductular reaction, lobular activity, steatosis and predominance of eosinophils, neutrophils, and plasma cells were assessed semi-quantitatively. Cholestasis and predominance of eosinophils, neutrophils, and plasma cells were given a score of 1 if they were prominent or a score of zero if they were not, which makes these scores binary. Ductular reaction was scored 0 if it was not prominent, 1 if it was present in <50% of portal tracts, and 2 if it was present in >50% of portal tracts. Lobular activity was graded based on the Batts-Ludwig scale9. Steatosis was scored 0–3 using a scale of <5%, 5–33%, 34–66%, and >66%, respectively10.
We summarized demographics, lab values, and histologic feature values using mean and standard deviation (SD), median, and interquartile range (IQR) if the variable was continuous. For categorical variables, we reported counts and percentages. We compared these variables between the two groups, pretreated and not pretreated, within each time-point using nonparametric Wilcoxon rank sum test for continuous variables, and chi-squared or Fisher’s exact test for categorical variables. We performed inter-rater reliability analysis using independent ratings of histologic features from three pathologists on all biopsies. For binary ratings, we assessed the level of agreement among the raters using Fleiss’s Kappa and reported 95% confidence intervals (CIs) from 1000 bootstrap replicates using functions boot and boot.ci in R package “boot”11–13. Based on the lower bound of the bootstrap CI, values with increments of 0.2 from zero indicate slight, fair, moderate, substantial, and excellent agreement, respectively14. For the remaining ordinal ratings, we reported Intra-Class Correlation Coefficient (ICC) and their 95% CI with value of the lower bound 0.5–0.75, 0.75–0.9, >0.9 indicating fair, good and excellent agreement, respectively11,12. To compare histologic features between groups, we used the median value of the ratings across three raters. Because all rating values were integers, median values are equivalent to most frequent values among the three raters. We defined percent change of lab values as (post-biopsy lab value – pre-biopsy lab value)/ (pre-biopsy lab value) ×100%. We were unable to provide p-values due to small group sizes in some comparisons. Statistical significance was assessed at the 0.05 level. Statistical analyses were implemented using R v. 4.1.215.
3. Results
We identified 70 biopsies from 53 liver-transplant patients who had 64 distinct episodes of suspected ACR. Thirty-three (62%) of these patients were male. The most common reason for transplant was alcoholic and/or non-alcoholic steatohepatitis (39%) followed by autoimmune and biliary processes (26%) (Table 1). The mean age at transplant was 49.7 years (SD 16.4, range 0.5–73.2 years), the mean age at the time of biopsy was 52.0 years (SD 14.4, range 19.3–73.7 years), and the mean time between transplant and biopsy was 2.3 years (SD 4.7, range 0.0–26.0 years) (Table 1).
Table 1:
Summary of clinical characteristics by ACR and intervention.
| Confirmed ACR | Not ACR* | |||||
|---|---|---|---|---|---|---|
| All biopsies (N=70) | Not pretreated (N=20) | Pretreated (N=17) | P-value | Not pretreated (N=24) | Pretreated (N=9) | |
| Transplant Reason | ||||||
| Autoimmune and biliary | 18 (26%) | 5 (25%) | 3 (17.6%) | - | 9 (37.5%) | 1 (11.1%) |
| Chronic viral hepatitis | 13 (19%) | 2 (10%) | 5 (29.4%) | - | 4 (16.7%) | 2 (22.2%) |
| Other | 12 (17%) | 3 (15%) | 3 (17.6%) | - | 6 (25%) | 0 (0%) |
| Steatohepatitis | 27 (39%) | 10 (50%) | 6 (35.3%) | 0.66k | 5 (20.8%) | 6 (66.7%) |
| Age At Transplant (years) | ||||||
| Mean (SD) | 49.7 (16.4) | 46.8 (18.4) | 49.5 (18.0) | - | 48.6 (14.4) | 59.8 (11.1) |
| Median (IQR) | 53.6 (39.7, 61.6) | 50.7 (39.3, 62.1) | 51.3 (41.2, 62.4) | - | 53.6 (38.5, 59.9) | 59.9 (58.3, 68.0) |
| Range | (0.5, 73.2) | (0.5, 67.4) | (3.2, 73.2) | 0.67k | (18.4, 70.2) | (37.3, 73.2) |
| Age At Biopsy (years) | ||||||
| Mean (SD) | 52.0 (14.4) | 49.8 (15.1) | 51.8 (14.3) | - | 50.7 (14.8) | 60.6 (10.1) |
| Median (IQR) | 54.8 (41.9, 62.9) | 50.9 (40.9, 62.6) | 51.7 (42.0, 63.3) | - | 56.6 (38.9, 61.3) | 60.0 (58.6, 68.5) |
| Range | (19.3, 73.7) | (26.4, 71.7) | (26.4, 73.7) | 0.22k | (19.3, 70.6) | (41.9, 73.5) |
| Time From Transplant To Biopsy (years) | ||||||
| Mean (SD) | 2.3 (4.7) | 3.0 (5.7) | 2.4 (5.5) | - | 2.2 (3.8) | 0.8 (1.5) |
| Median (IQR) | 0.6 (0.3, 1.9) | 0.9 (0.4, 3.4) | 0.7 (0.3, 1.0) | - | 0.5 (0.3, 1.9) | 0.4 (0.3, 0.4) |
| Range | (0.0, 26.0) | (0.0, 26.0) | (0.0, 23.2) | (0.0, 16.8) | (0.1, 4.7) | |
Chi-squared test,
Fisher’s exact test,
Kruskal-Wallis test.
p-values were not provided due to small group size.
For 37 of the 70 biopsies (53%), it was confirmed after biopsy based on integration of clinical, laboratory, and pathologic features that the liver injury was indeed related to ACR. Of these 37 biopsies of confirmed ACR, 17 (46%) were pretreated and 20 (54%) were not. The remaining 33 biopsies without confirmed ACR (47%, 33/70), including nine pretreated biopsies (27%, 9/33), belonged to patients who were ultimately diagnosed with something other than ACR: drug-induced liver injury (DILI), biliary issues, steatohepatitis, infection, vascular flow issues, and/or non-specific findings. One of the patients with DILI was pre-treated with IV steroids; the other eight pretreated patients, who were ultimately diagnosed with biliary issues (three patients), steatohepatitis (two patients), DILI (one patient), cytomegalovirus (CMV) infection (one patient), or non-specific findings (one patient), had other adjustments to their immunosuppression. The patient with CMV infection was started on oral steroids at another institution before presenting to our hospital, so limited information was available regarding the decision to pretreat in his case.
Recurrent hepatitis C was not a diagnostic consideration for any of the 26 pretreated patients. Seven pretreated patients had a history of chronic viral hepatitis: Four of these seven patients had a history of HCV and had documented sustained virologic response (SVR) before transplantation; one patient had a history of HCV with documented spontaneous viral clearance; one patient had a history of HCV with unknown SVR status and had undetectable HCV by PCR the day before pretreatment; and one patient had a history of HBV, on antiviral therapy, with low (<10 IU/mL) or undetectable HBV by PCR in the six months before pretreatment.
We summarized the median/most frequent histologic features scores of three pathologists for all 70 biopsies (Table 2, left columns) and for the subset of 37 biopsies of confirmed ACR (Table 2, right columns). Examining all 70 biopsies, those from patients who were pretreated showed significantly less portal inflammation (p = 0.036) and improved global assessment (p = 0.040) compared to not-pretreated biopsies (Table 2, left columns). Endothelialitis tended to be lower (p = 0.053) in pretreated patients, though this difference was not statistically significant. Other histologic features, including bile duct inflammation/damage (p = 0.68), were not significantly different.
Table 2:
Summary of median (most frequent) scores for histologic features stratified by intervention.
| Variable | All Biopsies (N=70) | Confirmed ACR (N=37) | ||||
|---|---|---|---|---|---|---|
| Pretreated (N=26) | Not pretreated (N=44) | P-value | Pretreated (N=17) | Not pretreated (N=20) | P-value | |
| Global Assessment | ||||||
| Mean (SD) | 0.7 (1.1) | 1.2 (1.2) | - | 0.6 (0.8) | 2.0 (1.3) | - |
| Median (IQR) | 0.0 (0.0, 1.0) | 1.0 (0.0, 2.0) | 0.040e | 0.0 (0.0, 1.0) | 2.0 (1.0, 3.0) | <0.001e |
| Portal Inflammation | ||||||
| Mean (SD) | 0.8 (0.7) | 1.2 (0.9) | - | 0.8 (0.5) | 1.8 (0.7) | - |
| Median (IQR) | 1.0 (0.0, 1.0) | 1.0 (1.0, 2.0) | 0.036e | 1.0 (1.0, 1.0) | 2.0 (1.0, 2.0) | <0.001e |
| Endothelialitis | ||||||
| Mean (SD) | 0.4 (0.6) | 0.8 (0.8) | - | 0.3 (0.5) | 1.3 (0.9) | - |
| Median (IQR) | 0.0 (0.0, 1.0) | 1.0 (0.0, 1.0) | 0.053e | 0.0 (0.0, 1.0) | 1.0 (1.0, 2.0) | <0.001e |
| Bile Duct Inflammation/Damage | ||||||
| Mean (SD) | 1.2 (0.9) | 1.1 (0.8) | - | 1.4 (0.7) | 1.6 (0.7) | - |
| Median (IQR) | 1.0 (1.0, 2.0) | 1.0 (1.0, 2.0) | 0.68e | 1.0 (1.0, 2.0) | 2.0 (1.0, 2.0) | 0.32e |
| Rejection Activity Index (RAI) | ||||||
| Mean (SD) | 2.4 (1.8) | 3.2 (2.2) | - | 2.5 (1.3) | 4.7 (2.1) | - |
| Median (IQR) | 2.0 (1.0, 3.0) | 3.0 (1.8, 4.0) | 0.16e | 2.0 (2.0, 3.0) | 4.0 (4.0, 6.0) | <0.001e |
| Ductular Reaction | ||||||
| Mean (SD) | 0.5 (0.6) | 0.4 (0.6) | - | 0.5 (0.6) | 0.4 (0.5) | - |
| Median (IQR) | 0.0 (0.0, 1.0) | 0.0 (0.0, 1.0) | 1.00e | 0.0 (0.0, 1.0) | 0.0 (0.0, 1.0) | 0.86e |
| Cholestasis | ||||||
| Mean (SD) | 0.5 (0.9) | 0.2 (0.5) | - | 0.8 (1.0) | 0.3 (0.5) | - |
| Median (IQR) | 0.0 (0.0, 1.0) | 0.0 (0.0, 0.0) | 0.15e | 0.0 (0.0, 2.0) | 0.0 (0.0, 1.0) | 0.18e |
| Prominent Eosinophils | ||||||
| No | 24 (92.3%) | 35 (79.5%) | 0.19f | 16 (94.1%) | 13 (65%) | 0.048f |
| Yes | 2 (7.7%) | 9 (20.5%) | - | 1 (5.9%) | 7 (35%) | - |
| Prominent Neutrophils | ||||||
| No | 21 (80.8%) | 37 (84.1%) | 0.75f | 15 (88.2%) | 16 (80%) | 0.67f |
| Yes | 5 (19.2%) | 7 (15.9%) | - | 2 (11.8%) | 4 (20%) | - |
| Prominent Plasma Cells | ||||||
| No | 26 (100%) | 41 (93.2%) | 0.29f | 17 (100%) | 18 (90%) | 0.49f |
| Yes | 0 (0%) | 3 (6.8%) | - | 0 (0%) | 2 (10%) | - |
| Lobular Necrosis | ||||||
| Mean (SD) | 0.7 (0.8) | 0.8 (1.1) | - | 0.8 (0.7) | 1.5 (1.3) | - |
| Median (IQR) | 1.0 (0.0, 1.0) | 0.0 (0.0, 1.0) | 0.88e | 1.0 (0.0, 1.0) | 1.0 (0.0, 3.0) | 0.14e |
| Steatosis | ||||||
| Mean (SD) | 0.4 (0.9) | 0.3 (0.7) | - | 0.2 (0.6) | 0.3 (0.7) | - |
| Median (IQR) | 0.0 (0.0, 0.0) | 0.0 (0.0, 0.0) | 0.82e | 0.0 (0.0, 0.0) | 0.0 (0.0, 0.2) | 0.60e |
Exact Wilcoxon rank sum test,
Fisher’s exact test
We next focused our analysis on the subset of biopsies (n=37) with a confirmed diagnosis of ACR (Table 2, right columns). Pretreated biopsies had significantly less portal inflammation (p<0.001) and endothelialitis (p<0.001), as well as a better global assessment (p<0.001) and lower RAI (p<0.001) than not-pretreated biopsies. There was no significant difference in bile duct inflammation/damage (p=0.32).
Together, results in Table 2 indicate that pretreatment is associated with a significant decrease in portal inflammation and endothelialitis, but no significant change in bile duct inflammation/damage. Lower bounds of ICC showed good to excellent inter-rater agreement for most continuous histologic features assessed (Table 3). Specifically, highest agreement was found on steatosis and RAI; however, only fair agreement was noted for ductular reaction. Kappa statistics revealed slight to fair agreement regarding binary histologic features such as prominence of eosinophils, plasma cells, and neutrophils (Table 3).
Table 3:
Intra-Class Correlation Coefficient (ICC) and Kappa statistic for histologic features.
| Variable | Type | ICC | Kappa | 95% CI |
|---|---|---|---|---|
| Global Assessment | Ordinal | 0.88 | - | (0.8, 0.92) |
| Portal Inflammation | Ordinal | 0.91 | - | (0.87, 0.94) |
| Endothelialitis | Ordinal | 0.89 | - | (0.83, 0.93) |
| Bile Duct Inflammation/Damage | Ordinal | 0.8 | - | (0.69, 0.88) |
| RAI | Ordinal | 0.93 | - | (0.9, 0.96) |
| Ductular reaction | Ordinal | 0.68 | - | (0.52, 0.79) |
| Cholestasis | Ordinal | 0.89 | - | (0.83, 0.93) |
| Lobular Necrosis | Ordinal | 0.84 | - | (0.76, 0.89) |
| Steatosis | Ordinal | 0.97 | - | (0.96, 0.98) |
| Prominent eosinophils | Binary | - | 0.47 | (0.28, 0.67) |
| Prominent neutrophils | Binary | - | 0.24 | (0.08, 0.43) |
| Prominent plasma cells | Binary | - | 0.16 | (0.01, 0.36) |
Of the 17 biopsies that were pretreated and related to confirmed ACR, 12 were treated with IV steroids and five received another form of increased immunosuppression (Table 4). P-values were not provided due to the small sample size in the latter group; however, the scores for portal inflammation, endothelialitis, and bile duct inflammation/damage seemed similar between the two pretreated subgroups.
Table 4:
Summary of median (most frequent) histologic features stratified by intervention within subset of ACR.
| Confirmed ACR Pretreated* | ||
|---|---|---|
| Variable | IV steroids: N=12 | other: N=5 |
| Global Assessment | ||
| Mean (SD) | 0.4 (0.5) | 1.0 (1.2) |
| Median (IQR) | 0.0 (0.0, 1.0) | 1.0 (0.0, 1.0) |
| Portal Inflammation | ||
| Mean (SD) | 0.8 (0.5) | 1.0 (0.7) |
| Median (IQR) | 1.0 (0.8, 1.0) | 1.0 (1.0, 1.0) |
| Endothelialitis | ||
| Mean (SD) | 0.2 (0.5) | 0.4 (0.5) |
| Median (IQR) | 0.0 (0.0, 0.2) | 0.0 (0.0, 1.0) |
| Bile Duct Inflammation/Damage | ||
| Mean (SD) | 1.4 (0.8) | 1.4 (0.5) |
| Median (IQR) | 1.0 (1.0, 2.0) | 1.0 (1.0, 2.0) |
| Rejection Activity Index (RAI) | ||
| Mean (SD) | 2.4 (1.2) | 2.8 (1.6) |
| Median (IQR) | 2.5 (2.0, 3.0) | 2.0 (2.0, 4.0) |
| Ductular Reaction | ||
| Mean (SD) | 0.5 (0.7) | 0.4 (0.5) |
| Median (IQR) | 0.0 (0.0, 1.0) | 0.0 (0.0, 1.0) |
| Cholestasis | ||
| Mean (SD) | 1.1 (1.0) | 0.0 (0.0) |
| Median (IQR) | 1.5 (0.0, 2.0) | 0.0 (0.0, 0.0) |
| Prominent Eos | ||
| No | 12 (100%) | 4 (80%) |
| Yes | 0 (0%) | 1 (20%) |
| Prominent PMNs | ||
| No | 10 (83.3%) | 5 (100%) |
| Yes | 2 (16.7%) | 0 (0%) |
| Prominent Plasma cells | ||
| No | 12 (100%) | 5 (100%) |
| Yes | 0 (0%) | 0 (0%) |
| Lobular Necrosis | ||
| Mean (SD) | 0.9 (0.8) | 0.6 (0.5) |
| Median (IQR) | 1.0 (0.0, 1.2) | 1.0 (0.0, 1.0) |
| Steatosis | ||
| Mean (SD) | 0.2 (0.6) | 0.2 (0.4) |
| Median (IQR) | 0.0 (0.0, 0.0) | 0.0 (0.0, 0.0) |
p-values were not provided due to small group size.
One limitation of the above analyses is that most biopsies of pretreated and not-pretreated patients were from different patients. Thus, it is possible that some feature(s) other than pretreatment status accounted for the differences in histologic findings between these two groups. To investigate this possibility, we examined demographic and laboratory features between biopsies from pretreated patients and those who were not pretreated. We found no significant demographic differences between pretreated and not-pretreated groups (Table 1). With respect to liver chemistries, pretreated biopsies had significantly higher pre-biopsy ALT values than untreated biopsies, but post-biopsy lab values were all similar between pretreated and not-pretreated groups (Table 5).
Table 5:
Summary of lab measures stratified by intervention and by time point.
| Variable | Pre-biopsy period | Post-biopsy period | ||||
|---|---|---|---|---|---|---|
| Pretreated (N=26) | Not pretreated (N=44) | P-value | Pretreated (N=26) | Not pretreated (N=44) | P-value | |
| AST | ||||||
| Mean (SD) | 254.6 (223.1) | 141.3 (163.7) | - | 62.5 (46.3) | 78.5 (81.1) | - |
| Median (IQR) | 202.0 (57.8, 438.8) | 71.0 (53.0, 155.0) | 0.050e | 49.5 (33.5, 70.8) | 48.5 (34.0, 97.0) | 0.85e |
| Range | (18.0, 761.0) | (15.0, 761.0) | - | (8.0, 204.0) | (12.0, 345.0) | - |
| ALT | ||||||
| Mean (SD) | 400.0 (375.8) | 192.5 (190.4) | - | 149.4 (122.4) | 141.8 (150.2) | - |
| Median (IQR) | 274.5 (115.8, 595.0) | 123.0 (70.0, 242.0) | 0.009e | 95.5 (64.0, 217.5) | 78.0 (41.5, 179.8) | 0.46e |
| Range | (16.0, 1423.0) | (9.0, 908.0) | - | (15.0, 462.0) | (17.0, 634.0) | - |
| Alk Phos | ||||||
| Mean (SD) | 457.0 (563.2) | 499.3 (505.6) | - | 224.5 (128.0) | 334.2 (280.9) | - |
| Median (IQR) | 288.5 (152.5, 464.0) | 324.0 (227.0, 559.0) | 0.49e | 192.0 (121.5, 308.5) | 235.5 (159.5, 362.0) | 0.14e |
| Range | (66.0, 2687.0) | (80.0, 2687.0) | - | (64.0, 492.0) | (90.0, 1218.0) | - |
| Bilirubin | ||||||
| Mean (SD) | 5.4 (9.1) | 4.2 (7.8) | - | 4.8 (8.9) | 4.4 (8.7) | - |
| Median (IQR) | 1.2 (0.5, 4.7) | 0.9 (0.6, 3.0) | 0.98e | 1.3 (0.6, 2.1) | 0.9 (0.5, 2.4) | 0.71e |
| Range | (0.2, 37.4) | (0.3, 37.4) | - | (0.3, 33.7) | (0.2, 33.5) | - |
Pre biopsy period missing values (pretreated/not pretreated): AST=2/3, ALT=2/3, Alk.Phos=2/3, Bili=2/3.
Post biopsy period missing values (pretreated/not pretreated): AST=4/6, ALT=4/6, Alk.Phos=4/6, Bili=4/6.
Exact Wilcoxon rank sum test.
To further address this limitation, we compared histologic features in the subset of six patients, whose biopsies were retrospectively diagnosed with ACR, who had biopsies taken before treatment (not pretreated) and follow-up biopsies taken within one month after treatment (pretreated). We summarized histologic features of these paired samples from the same subjects (Table 6). The largest decreases seemed to occur in global assessment, portal inflammation, and endothelialitis, while bile duct inflammation/damage seemingly was less affected (p values not calculated due to small sample sizes; Table 6, Figure 1).
Table 6:
Summary of median (most frequent) scores for histologic features stratified by paired biopsies from subset of 6 pretreated subjects with two biopsies, one before and one after treatment.
| Paired biopsies within treated subjects* | ||
|---|---|---|
| Variable | 1st biopsy (N=6) Not pretreated |
2nd biopsy (N=6) Pretreated |
| Global Assessment | ||
| Mean (SD) | 3.0 (0.9) | 0.2 (0.4) |
| Median (IQR) | 3.0 (2.2, 3.8) | 0.0 (0.0, 0.0) |
| Portal Inflammation | ||
| Mean (SD) | 2.2 (0.8) | 0.8 (0.4) |
| Median (IQR) | 2.0 (2.0, 2.8) | 1.0 (1.0, 1.0) |
| Endothelialitis | ||
| Mean (SD) | 2.0 (0.9) | 0.0 (0.0) |
| Median (IQR) | 2.0 (1.2, 2.8) | 0.0 (0.0, 0.0) |
| Bile Duct Inflammation/Damage | ||
| Mean (SD) | 2.3 (0.5) | 1.7 (0.8) |
| Median (IQR) | 2.0 (2.0, 2.8) | 1.5 (1.0, 2.0) |
| Rejection Activity Index (RAI) | ||
| Mean (SD) | 6.5 (2.1) | 2.3 (1.0) |
| Median (IQR) | 6.0 (5.2, 8.2) | 2.0 (2.0, 2.8) |
| Ductular Reaction | ||
| Mean (SD) | 0.3 (0.5) | 0.8 (1.0) |
| Median (IQR) | 0.0 (0.0, 0.8) | 0.5 (0.0, 1.8) |
| Cholestasis | ||
| Mean (SD) | 0.5 (0.5) | 1.5 (0.8) |
| Median (IQR) | 0.5 (0.0, 1.0) | 2.0 (1.2, 2.0) |
| Prominent Eosinophils | ||
| No | 2 (33.3%) | 6 (100%) |
| Yes | 4 (66.7%) | 0 (0%) |
| Prominent Neutrophils | ||
| No | 4 (66.7%) | 4 (66.7%) |
| Yes | 2 (33.3%) | 2 (33.3%) |
| Prominent Plasma cells | ||
| No | 5 (83.3%) | 6 (100%) |
| Yes | 1 (16.7%) | 0 (0%) |
| Lobular Necrosis | ||
| Mean (SD) | 2.3 (1.4) | 0.8 (1.0) |
| Median (IQR) | 2.5 (2.0, 3.0) | 0.5 (0.0, 1.8) |
| Steatosis | ||
| Mean (SD) | 0.2 (0.4) | 0.2 (0.4) |
| Median (IQR) | 0.0 (0.0, 0.0) | 0.0 (0.0, 0.0) |
p-values were not provided due to small group size.
Figure 1: Histologic features following treatment for rejection in paired biopsies are similar to those in pretreated biopsies.
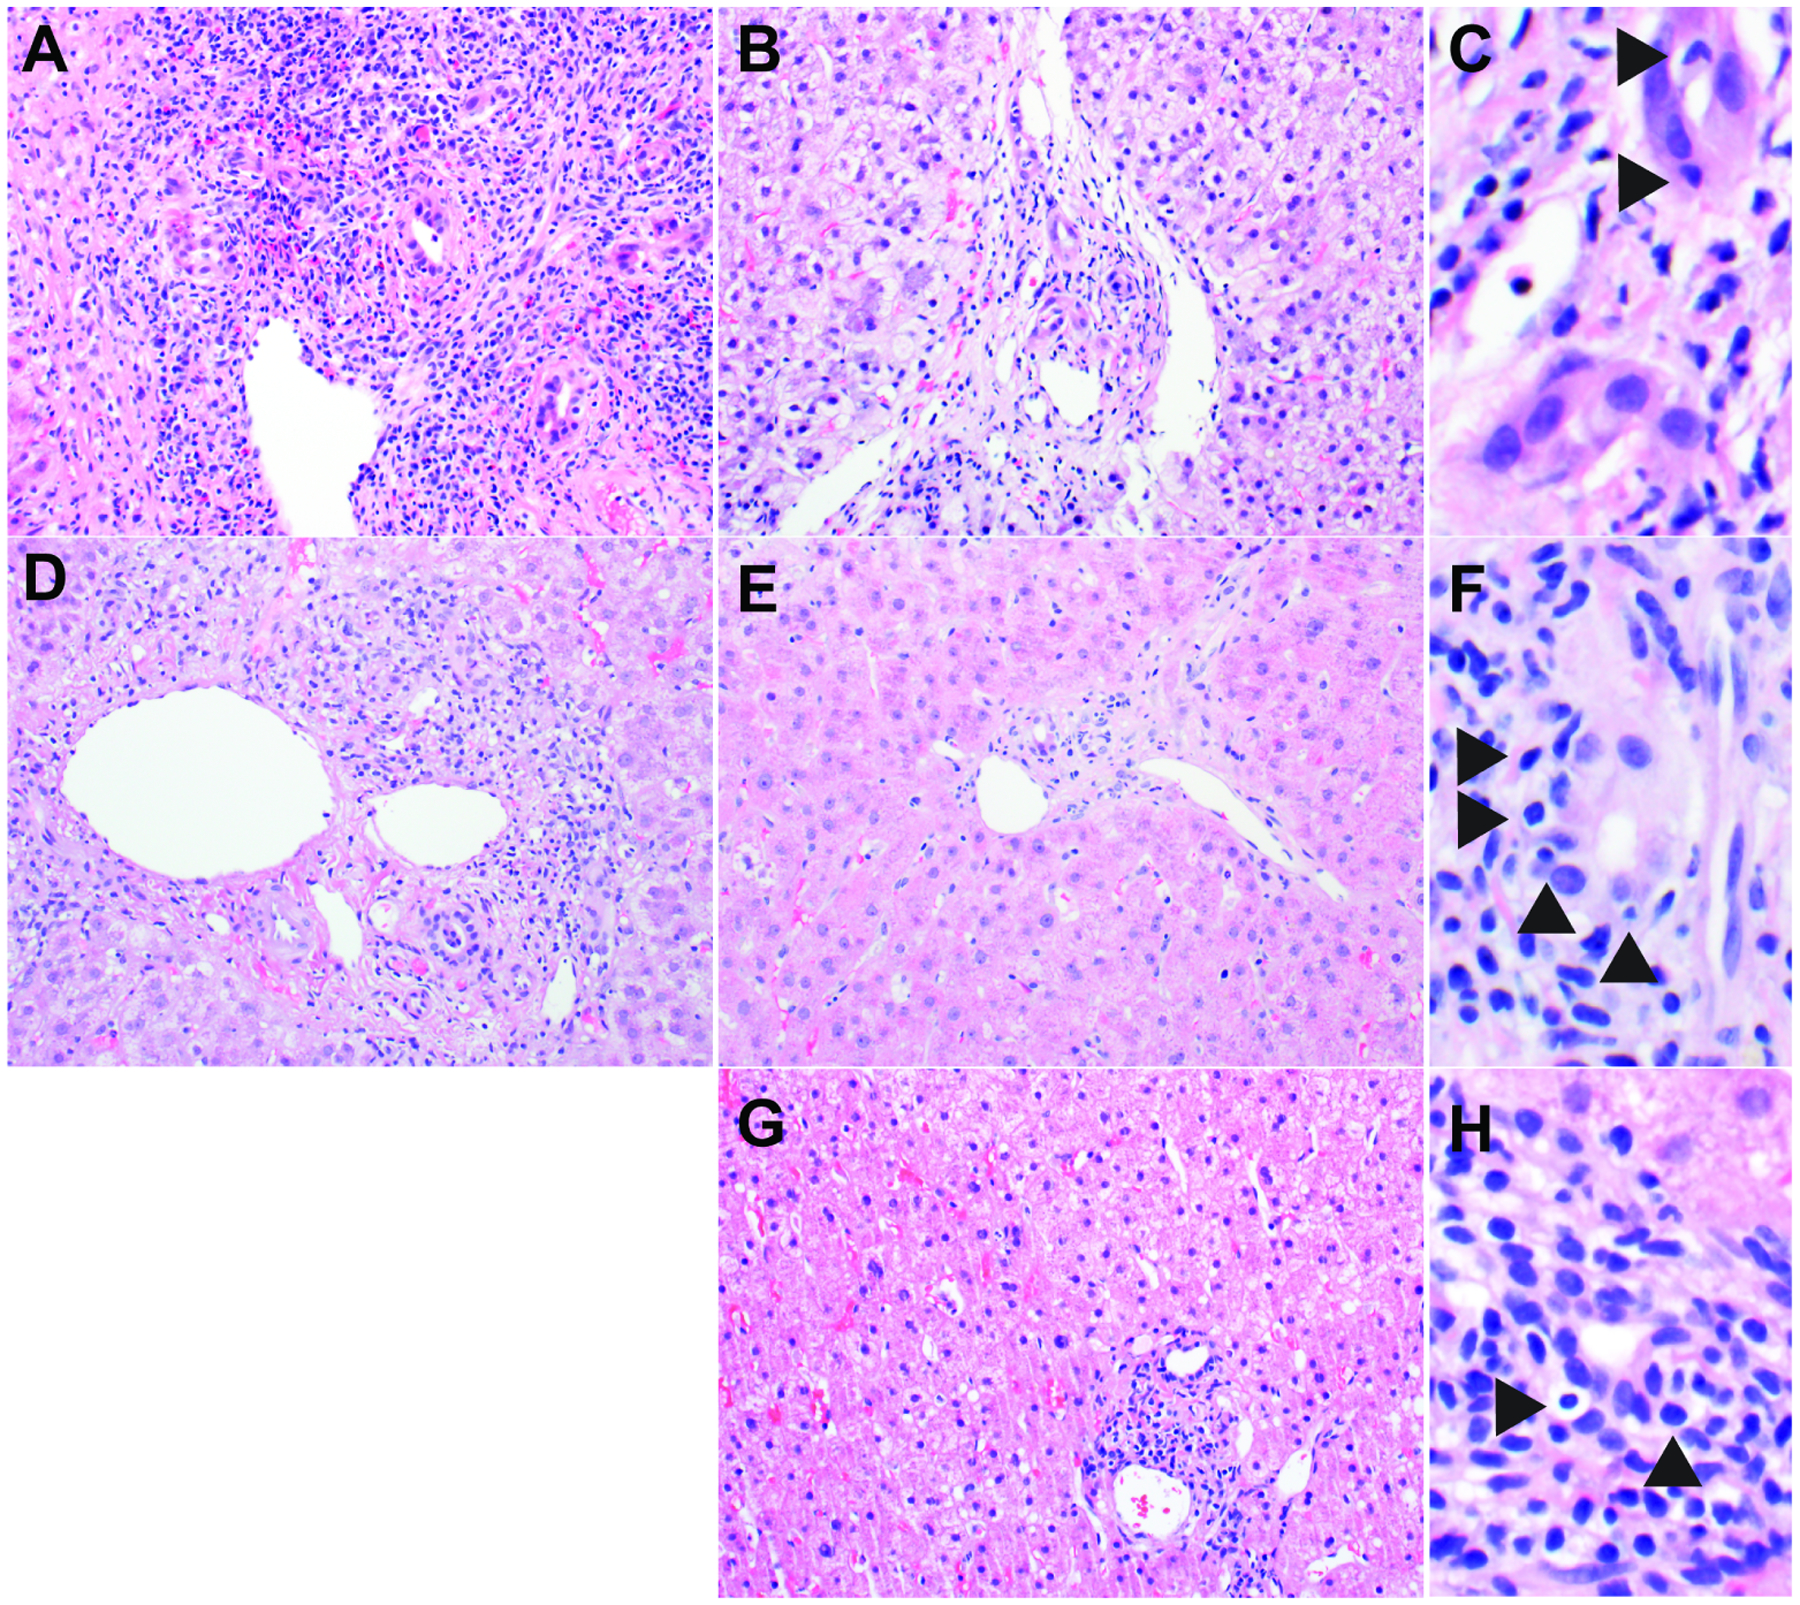
(A-C) Patient 1, who had a history of liver transplantation performed at another institution about three years prior, presented with AST 761 U/L, ALT 269 U/L, and Alk Phos 2687 U/L. After her initial biopsy showed features of severe acute cellular rejection (A), she was treated with IV steroids followed by an oral steroid taper and started on anti-thymocyte globulin. Repeat biopsy 13 days after first biopsy showed improvement in portal inflammation and endothelialitis (B), but bile ducts demonstrated residual damage/inflammation (C) including disrupted architecture, vacuolated cytoplasm, and intraepithelial lymphocytes (arrowheads). Laboratory values the day before the second biopsy included AST 487 U/L, ALT 749 U/L, and Alk Phos 1456 U/L. (D-F) Patient 2, who had a history of liver transplantation 8 months prior, presented with AST 159 U/L, ALT 247 U/L, and Alk Phos 881 U/L. After his initial biopsy showed features of mild acute cellular rejection (D), he was treated with IV steroids followed by an oral steroid taper. Repeat biopsy 14 days after first biopsy showed improvement of mixed portal inflammation and endothelialitis (E), but bile ducts demonstrated residual damage/inflammation (F) including disrupted architecture and intraepithelial lymphocytes (arrowheads). Laboratory values the day before the second biopsy included AST 45 U/L, ALT 119 U/L and Alk Phos 268 U/L. (G-H) Patient 3, who had a history of liver transplantation 3 months prior, presented with AST 52 U/L, ALT 198 U/L and Alk Phos 198 U/L. She was treated with increased tacrolimus and oral steroids before biopsy. Biopsy showed mostly lymphocytic inflammation involving a minority of portal tracts (score = 1) and no endothelialitis (score = 0) (G), while a minority of bile ducts demonstrated cuffing and infiltration by lymphocytes (score = 1) (arrowheads) (H). All biopsies are from patients with clinically confirmed ACR. Biopsies were obtained before treatment (A and D) and after treatment (B, C, E, F, G, and H) as part of clinical care. Hematoxylin-and-eosin stains.
We compared liver chemistries collected pre- and post-biopsy stratified by whether the biopsy represented a confirmed episode of ACR or some other liver injury (Table 7). Before biopsy, AST, ALT, and bilirubin were significantly higher in patients with ACR (Table 7). Two to four weeks after biopsy, when all patients with a confirmed diagnosis of ACR had been treated, liver chemistries were not significantly different between patients with and without ACR (Table 7). Though non-significant, post-biopsy bilirubin tended to be higher in patients who had ACR (p=0.06; Table 7).
Table 7:
Summary of lab measures stratified by ACR and by time point.
| Variable | Pre-biopsy period | Post-biopsy period | ||||
|---|---|---|---|---|---|---|
| Confirmed ACR (N=37) | No ACR (N=33) | P-value | Confirmed ACR (N=37) | No ACR (N=33) | P-value | |
| AST | ||||||
| Mean (SD) | 236.9 (218.7) | 116.4 (134.4) | - | 76.9 (86.0) | 67.3 (45.5) | - |
| Median (IQR) | 150.0 (57.8, 324.0) | 64.0 (45.0, 99.0) | 0.009e | 45.0 (29.0, 65.0) | 52.0 (37.0, 87.5) | 0.47e |
| Range | (25.0, 761.0) | (15.0, 528.0) | - | (12.0, 345.0) | (8.0, 192.0) | - |
| ALT | ||||||
| Mean (SD) | 314.7 (258.5) | 212.5 (318.7) | - | 162.6 (159.6) | 122.5 (109.5) | - |
| Median (IQR) | 244.5 (119.5, 500.0) | 91.0 (63.0, 191.0) | 0.008e | 99.0 (63.0, 191.0) | 77.0 (41.0, 200.5) | 0.32e |
| Range | (27.0, 953.0) | (9.0, 1423.0) | - | (23.0, 634.0) | (15.0, 462.0) | - |
| Alk Phos | ||||||
| Mean (SD) | 585.7 (663.8) | 357.1 (214.3) | - | 275.7 (254.8) | 316.3 (226.3) | - |
| Median (IQR) | 341.0 (159.0, 707.5) | 324.0 (223.0, 443.0) | 0.61e | 209.0 (138.0, 308.0) | 220.0 (157.5, 422.0) | 0.30e |
| Range | (66.0, 2687.0) | (80.0, 949.0) | - | (64.0, 1218.0) | (88.0, 1065.0) | - |
| Bilirubin | ||||||
| Mean (SD) | 6.7 (9.7) | 2.0 (5.2) | - | 6.4 (10.2) | 2.3 (5.9) | - |
| Median (IQR) | 1.9 (0.7, 11.4) | 0.7 (0.4, 1.7) | 0.010e | 1.4 (0.7, 3.6) | 0.8 (0.4, 1.8) | 0.06e |
| Range | (0.2, 37.4) | (0.2, 28.5) | - | (0.3, 33.7) | (0.2, 31.2) | - |
Pre biopsy period missing values (pretreated/not pretreated): AST=1/4, ALT=1/4, Alk.Phos=1/4, Bili=1/4.
Post biopsy period missing values (pretreated/not pretreated): AST=4/6, ALT=4/6, Alk.Phos=4/6, Bili=4/6.
Exact Wilcoxon rank sum test.
We calculated percent change between pre- and post-biopsy liver chemistries relative to pre-biopsy values for patients with a clinical diagnosis of ACR. Post-biopsy chemistries were obtained after treatment for ACR in all cases. AST, ALT, and alkaline phosphatase decreased by 44.7%, 12.3%, and 19.7% on average, respectively, while total bilirubin increased by 45% on average. These data indicate that following an episode of treated ACR, bilirubin, a marker of liver excretory function8, takes longer to normalize than AST and ALT, which correlate more closely with hepatocellular injury8.
4. Discussion
The pathologic interpretation of liver transplant biopsies performed for clinical suspicion of rejection is particularly challenging when patients may have been treated with steroids or other immunosuppressive drugs prior to biopsy. Here we show that pretreatment is associated with significantly lower scores for endothelialitis and portal inflammation, but it is not associated with a significant difference in bile duct inflammation/damage. The histologic findings in this study correlated with laboratory values showing a greater percentage decrease in AST and ALT than in total bilirubin following treatment for ACR. Together these data suggest a model in which patients treated for rejection show a rapid recovery in hepatocyte inflammation, whereas bile duct epithelial injury takes longer to resolve.
Two seminal publications in the 1980s examined serial liver biopsies before and after treatment of ACR16,17. The first study included 63 biopsy specimens from 17 patients, with biopsies taken at the time of insertion of the liver, time of development of liver function abnormalities, and as follow-up to previously abnormal biopsies16. Nine patients were diagnosed with ACR, and all had at least one follow-up biopsy after their initial biopsy showing ACR. The two most common patterns of histologic findings at follow-up were: 1) bile duct proliferation, cholestasis, and prominent neutrophils; and 2) decreased portal inflammation and decreased bile duct damage16. The pattern of decreased portal inflammation following treatment is similar to what we report here and was also identified in a larger study led by the same author17. The accompanying decrease in bile duct damage after treatment is discordant with our findings and may be related to these follow-up biopsies occurring at a longer time interval following ACR treatment and/or a difference in immunosuppressive regimens compared to our more recent study. Expanding their patient population16 with additional biopsies, the authors examined the histologic response to ACR therapy in 36 patients17. The only statistically significant changes between initial biopsies and post-treatment biopsies were a lower score for endothelialitis and an increase in bile duct paucity17. The post-treatment biopsies in this analysis included all biopsies that continued to show features of rejection regardless of time frame (n=80), so the increased bile duct paucity may reflect evolving chronic rejection. The authors more closely examined a subset of 12 patients categorized as showing a partial response to therapy. They found that in all 12 patients, portal inflammation resolved rapidly, and in 8 patients (75%) endothelialitis resolved before duct damage17. Though statistical analysis of the histologic changes in these 12 patients was not reported, the trends support our conclusion that portal inflammation resolves more rapidly than duct injury in patients treated for ACR.
In renal and small bowel transplant patients, differential responses of various histologic changes after treatment for rejection have been reported. Renal transplant patients who had a higher Banff rejection score at the time of pretreatment biopsy showed a greater improvement in interstitial, tubular, and vascular inflammation post biopsy than patients with a lower initial Banff rejection score18. In patients with a Banff score of 3 prior to treatment, the improvement in interstitial inflammation was statistically significant (p<0.008) whereas the improvements in tubular (p<0.055) and vascular (p<0.093) inflammation were not18. In small bowel allografts, lamina propria inflammation, particularly lymphocytes and eosinophils, and crypt injury improved more quickly after treatment than crypt apoptotic bodies19. Together with our findings in liver transplant biopsies, these results in the kidney and small bowel support the hypothesis that rejection-mediated injury resolves at different rates in distinct tissue compartments.
Limitations of this retrospective study include the nesting structure presented among patients, episodes, and biopsies. We addressed this issue by performing our analyses on the level of biopsies as independent observational units. In addition, treatment was not randomized, and no specific guidelines were used to determine if a patient received treatment prior to biopsy. Thus, pretreated and not-pretreated groups may have had differences other than treatment that affected histologic findings. Indeed, ALT was significantly higher in the pretreated group, suggesting that those patients had more hepatocellular injury before biopsy. This difference would be expected to enhance histologic features of ACR in the pretreatment group.
Though ALT was significantly higher in the pretreated group, there was overlap in the interquartile ranges for ALT between pretreated and not pretreated groups. Furthermore, we did not identify any other clinical or laboratory features that were significantly different between the two groups. Thus our retrospective analysis failed to identify specific features that led the clinical team to pretreat some patients but not others, supporting the conclusion that this decision relies on complex, subjective clinical judgement.
An additional limitation of this study is that the pretreated group is likely enriched for patients who did not respond well to empiric treatment for ACR. Patients with clinically suspected rejection who responded well to empiric ACR treatment would be less likely to undergo biopsy and be included in this study than patients who did not improve with therapy. The histologic features of biopsies from relatively poor responders may not be reflective of all pretreated patients. Another likely consequence of omitting patients who responded well to empiric ACR treatment from our analysis is the relatively high percentage (35%) of pretreated patients who were ultimately diagnosed with a condition other than rejection. The effectiveness of clinical judgement in diagnosing rejection before biopsy could be determined more accurately with a prospective study in which all patients with suspected ACR are biopsied before and after treatment.
Another limitation is the small sample size of patients with ACR who were treated before biopsy with immunosuppressive drugs other than IV steroids. Because of this limitation, we were unable to determine if there were statistically significant differences in histologic features with different types of treatments.
The major conclusion from this study is that pretreatment for ACR is associated with significantly decreased endothelialitis and portal inflammation, but it is not associated with a significant difference in bile duct inflammation/damage. This result suggests that the presence of bile duct inflammation/damage should raise the pathologist’s suspicion for partially treated rejection even in the absence of other histologic features of ACR. As bile duct injury is not specific for ACR and can occur in other post-transplant settings such as biliary tract obstruction, it is important to interpret bile duct changes in the appropriate clinical context. This work may help to inform the establishment of new guidelines for diagnosing ACR in patients who have been pretreated before biopsy, with the goal of standardizing the interpretation of liver biopsies in this population. Ultimately, facilitating the diagnosis of ACR in pretreated patients could reduce the need for invasive pretreatment biopsy procedures in transplant patients who are not at risk for infection.
Acknowledgements:
We thank Sheila Mota, MPH, for assistance with chart review.
Funding:
This investigation was supported by the University of Utah Study Design and Biostatistics Center, with funding in part from the National Center for Research Resources and the National Center for Advancing Translational Sciences, National Institutes of Health, through Grant 8UL1TR000105 (formerly UL1RR025764). KJE is funded in part by NIH/NCI R01CA222570. This work was partially supported by a William L. Roberts Fund Award from the University of Utah Department of Pathology to NBL.
Conflicts of Interest:
The authors have no competing financial interests in relation to the work described. Potential competing interests: Shaun Chandna was a sub-investigator for Allakos. Other disclosures: Shaun Chandna has served on an advisory board for Dova Pharmaceuticals and Targeted Oncology, has served as a speaker for the Chronic Liver Disease Foundation/Focus Medical Communications, has received sponsored travel for research support from Genfit/Covance and Arrowhead Pharmaceuticals, and has received research funding from Arrowhead Pharmaceuticals, Lipocine, Calliditas Therapeutics (previously Genkyotex), and Mirum Pharmaceuticals.
Footnotes
Publisher's Disclaimer: This is a PDF file of an unedited manuscript that has been accepted for publication. As a service to our customers we are providing this early version of the manuscript. The manuscript will undergo copyediting, typesetting, and review of the resulting proof before it is published in its final form. Please note that during the production process errors may be discovered which could affect the content, and all legal disclaimers that apply to the journal pertain.
Previous/duplicate publication: Parts of this study were presented at USCAP 2022.
Ethics Approval and Consent to Participate: This study was approved by the University of Utah Institutional Review Board (IRB #00091019) and was performed in accordance with the Declaration of Helsinki.
Data Availability Statement:
All data generated or analyzed during this study are included in this published article.
References
- 1.Charlton M, Levitsky J, Aqel B, et al. International Liver Transplantation Society Consensus Statement on Immunosuppression in Liver Transplant Recipients. Transplantation 2018;102:727–743. doi: 10.1097/TP.0000000000002147. [DOI] [PubMed] [Google Scholar]
- 2.Banff schema for grading liver allograft rejection: an international consensus document. Hepatology 1997;25:658–663. doi: 10.1002/hep.510250328. [DOI] [PubMed] [Google Scholar]
- 3.Lucey MR, Terrault N, Ojo L, et al. Long-term management of the successful adult liver transplant: 2012 practice guideline by the American Association for the Study of Liver Diseases and the American Society of Transplantation. Liver Transpl 2013;19:3–26. doi: 10.1002/lt.23566. [DOI] [PubMed] [Google Scholar]
- 4.Grassi A, Ballardini G. Post-liver transplant hepatitis C virus recurrence: an unresolved thorny problem. World J Gastroenterol 2014;20:11095–11115. doi: 10.3748/wjg.v20.i32.11095. [DOI] [PMC free article] [PubMed] [Google Scholar]
- 5.Choudhary NS, Saigal S, Bansal RK, et al. Acute and Chronic Rejection After Liver Transplantation: What A Clinician Needs to Know. J Clin Exp Hepatol 2017;7:358–366. doi: 10.1016/j.jceh.2017.10.003. [DOI] [PMC free article] [PubMed] [Google Scholar]
- 6.Noureddin M, Vipani A, Bresee C, et al. NASH Leading Cause of Liver Transplant in Women: Updated Analysis of Indications For Liver Transplant and Ethnic and Gender Variances. Am J Gastroenterol 2018;113:1649–1659. doi: 10.1038/s41395-018-0088-6. [DOI] [PMC free article] [PubMed] [Google Scholar]
- 7.Rodríguez-Perálvarez M, García-Caparrós C, Tsochatzis E, et al. Lack of agreement for defining “clinical suspicion of rejection” in liver transplantation: a model to select candidates for liver biopsy. Transpl Int 2015;28:455–464. doi: 10.1111/tri.12514. [DOI] [PubMed] [Google Scholar]
- 8.Naik P, Sritharan V, Bandi P, et al. A single centre prospective study of liver function tests in post liver transplant patients. Indian J Clin Biochem 2013;28:38–45. doi: 10.1007/s12291-012-0245-4. [DOI] [PMC free article] [PubMed] [Google Scholar]
- 9.Batts KP, Ludwig J. Chronic hepatitis. An update on terminology and reporting. Am J Surg Pathol 1995;19:1409–1417. doi: 10.1097/00000478-199512000-00007. [DOI] [PubMed] [Google Scholar]
- 10.Kleiner DE, Brunt EM, Van Natta M, et al. Design and validation of a histological scoring system for nonalcoholic fatty liver disease. Hepatology 2005;41:1313–1321. doi: 10.1002/hep.20701. [DOI] [PubMed] [Google Scholar]
- 11.Hallgren KA. Computing Inter-Rater Reliability for Observational Data: An Overview and Tutorial. Tutor Quant Methods Psychol 2012;8:23–34. doi: 10.20982/tqmp.08.1.p023. [DOI] [PMC free article] [PubMed] [Google Scholar]
- 12.Koo TK, Li MY. A Guideline of Selecting and Reporting Intraclass Correlation Coefficients for Reliability Research. J Chiropr Med 2016;15:155–163. doi: 10.1016/j.jcm.2016.02.012. [DOI] [PMC free article] [PubMed] [Google Scholar]
- 13.Fleiss JL. Measuring nominal scale agreement among many raters. Psychological Bulletin 1971;76:378–382. [Google Scholar]
- 14.Altman D Practical Statistics for Medical Research. London England: Chapman and Hall; 1991. [Google Scholar]
- 15.R Core Team. R: A language and environment for statistical computing. Vienna, Austria: R Foundation for Statistical Computing; 2020. Available at: https://www.R-project.org. [Google Scholar]
- 16.Snover DC, Sibley RK, Freese DK, et al. Orthotopic liver transplantation: a pathological study of 63 serial liver biopsies from 17 patients with special reference to the diagnostic features and natural history of rejection. Hepatology 1984;4:1212–1222. doi: 10.1002/hep.1840040620. [DOI] [PubMed] [Google Scholar]
- 17.Snover DC, Freese DK, Sharp HL, et al. Liver allograft rejection. An analysis of the use of biopsy in determining outcome of rejection. Am J Surg Pathol 1987;11:1–10. doi: 10.1097/00000478-198701000-00001. [DOI] [PubMed] [Google Scholar]
- 18.Gaber LW, Moore LW, Gaber AO, et al. Correlation of histology to clinical rejection reversal: a thymoglobulin multicenter trial report. Kidney Int 1999;55:2415–2422. doi: 10.1046/j.1523-1755.1999.00494.x. [DOI] [PubMed] [Google Scholar]
- 19.Liu L, Fischer RT, Xu L, et al. Sequential histologic changes in the healing process in small bowel allografts treated for acute cellular rejection. Transplant Proc 2013;45:643–648. doi: 10.1016/j.transproceed.2012.05.072. [DOI] [PubMed] [Google Scholar]
Associated Data
This section collects any data citations, data availability statements, or supplementary materials included in this article.
Data Availability Statement
All data generated or analyzed during this study are included in this published article.