

Summary
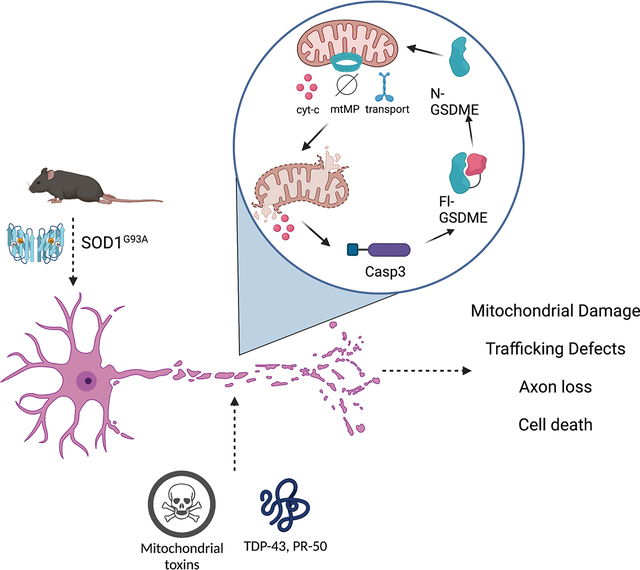
Mitochondrial dysfunction and axon loss are hallmarks of neurologic diseases. Gasdermin (GSDM) proteins are executioner pore-forming molecules that mediate cell death, yet their roles in the central nervous system (CNS) are not well understood. Here, we find that one GSDM family member, GSDME is expressed by both mouse and human neurons. GSDME plays a role in mitochondrial damage and axon loss. Mitochondrial neurotoxins induced caspase-dependent GSDME cleavage and rapid localization to mitochondria in axons, where GSDME promoted mitochondrial depolarization, trafficking defects, and neurite retraction. Frontotemporal dementia (FTD)/Amyotrophic Lateral Sclerosis (ALS)-associated proteins TDP-43 and PR-50 induced GSDME-mediated damage to mitochondria and neurite loss. GSDME knockdown protected against neurite loss in ALS patient iPSC-derived motor neurons. Knockout of GSDME in SOD1G93A ALS mice prolonged survival, ameliorated motor dysfunction, rescued motor neuron loss and reduced neuroinflammation. We identify GSDME as an executioner of neuronal mitochondrial dysfunction that may contribute to neurodegeneration.
eTOC Blurb:
Gasdermin-E is a pore-forming molecule that is expressed in neurons. When activated, this molecule rapidly targets and destroys mitochondria. In neurons, toxin exposure activates GSDME and drives mitochondrial and axonal destruction. Genetic inhibition of GSDME rescues axon loss in amyotrophic lateral sclerosis (ALS) patient-derived motor neurons, and in a mouse model of ALS.
Graphical Abstract
Introduction
Neurologic diseases are often characterized by early mitochondrial dysfunction and axon loss preceding cell death1–4. Mitochondrial damage leads to release of contents including mitochondrial DNA and cytochrome-c, which drive caspase-3 activation and apoptosis5. Caspase-3 activity can also occur locally in neurites and contributes to axonal damage prior to induction of overt neuronal cell death3. Though the link between mitochondrial damage and caspase-3 activation is well characterized, the myriad mechanisms that amplify local mitochondrial collapse and neurite loss are not clear. Mapping these early molecular mechanisms leading to neuronal dysfunction may have implications for a wide range of neurologic insults.
Gasdermins are a family of pore-forming proteins that have been linked to inflammation and cell death: GSDMA, GSDMB, GSDMC, GSDMD, and GSDME (or DFNA5). Gasdermins have pore-forming N-terminal domains that are masked by an autoinhibitory C-terminus in the resting state. Proteolytic cleavage in the linker region between the -N and -C domains release the N-terminal fragment of GSDMs to insert and oligomerize in lipid membranes and form pores. Accumulation of GSDM pores in the plasma membrane leads to cell swelling and necrosis—a process termed “pyroptosis” 6–9. GSDMD, first identified in macrophages, is activated by caspase 1/11 downstream of inflammasome assembly 8–10. N-GSDMD can also permeabilize mitochondrial membranes leading to release of cytochrome-c, mitochondrial DNA (mtDNA) and downstream caspase-3 activation 11–13. The consequences of GSDM activation in a range of cell types has not been well defined. To date, most studies concerning GSDM-biology have focused on pyroptotic death in immune or cancer cells.
GSDME, one member of the GSDM family, is expressed in both brain and spinal cord18–20. However, its functional role in the nervous system is largely unknown. GSDME activation was first elucidated in cancer cell lines, where it was shown to be cleaved by caspase-3 to mediate pyroptosis7. Subsequent has shown that GSDME can drive cell death in keratinocytes 14, the GI tract 15, kidney 16, mouse retinoblastoma cells 17, and human cancer cells 7,18,19.
The function of GSDMs in neuronal cell biology and its action in axonal processes has not been studied. Neurons are distinct from other cell types in being both non-dividing and possessing long morphological processes, namely dendrites and axons. Neurons also have unique energetic demands, needing to transport mitochondria over great distances to maintain axons and synapses. In neurodegenerative conditions such as frontotemporal dementia (FTD) and amyotrophic lateral sclerosis (ALS), proteins such as TDP-43, SOD1 and C9orf72-associated dipeptide repeat proteins (DPRs) disrupt mitochondrial function and induce loss of axonal processes. These changes are early steps in disease pathogenesis 1,20–24.
Our study reveals that upon activation, GSDME rapidly distributes to neurite-associated mitochondria to amplify damage, slow mitochondrial trafficking, and promote neurite retraction without onset of cell death. FTD/ALS-associated proteins induce GSDME activation and localization to axonal mitochondria, driving mitochondrial depolarization and neurite loss. GSDME plays a functional role in driving neurodegeneration in a mouse model of ALS and neurite loss in patient-iPSC-motor neuron models. Genetic knockout or shRNA-based knockdown is neuroprotective both in vitro and in vivo. We identify GSDME as an important modifier of early neuronal mitochondrial damage that may play a role in neurologic disease.
Results
GSDME is expressed in mouse and human neurons
The expression of the Gasdermin family in the central nervous system and its potential functions in neurons have not yet been well characterized. We mined publicly available single cell RNA-seq data of mouse cortex and hippocampus sorted for neurons25,26. The GSDM family members Gsdmd, Gsdma, and Gsdmc were largely absent, while Gsdme was expressed in both GABAergic and Glutamatergic neurons (Fig 1A). To further confirm Gsdme expression in the mouse brain, we isolated tissue samples from different brain regions of wild-type (WT) or Gsdme−/− mice for transcriptional analysis, immunostaining, and immunoblotting. Gsdme mRNA was detected in cortical, cerebellar, midbrain and spinal cord lysates from WT mice, but absent in Gsdme−/− (KO) animals (Fig S1A). Anti-GSDME immunostaining of mouse brain showed broad expression in cells with neuronal morphology (Fig 1B). Staining and immunoblotting of mouse brains from knockout animals showed negligible immunoreactivity (Fig S1B and Fig 1C).
Figure 1: GSDME is expressed in the brain and localizes to neurons at baseline.

(A) Single-cell RNA-sequencing (Allen Institute for Brain Science) of sorted mouse cortical and hippocampal neurons was mined for expression levels of Gasdermins.
(B) Representative IHC images of coronal mouse brain sections stained using anti-GSDME antibody.
(C) Immunoblot analysis of GSDME expression in several mouse brain regions from adult wild-type and GSDME knockout mice.
(D) Immunoblot of GSDME and GSDMD expression in neuronal (Tuj1+) and glial (Iba1+) populations from P0 mouse pups.
(E) Representative IHC images of mouse cortex and striatum co-stained with anti-GSDME and either anti-beta-III-tubulin (Tuj1) or anti-Iba1 antibodies.
For colocalization, each dot represents a coronal section. Two sections were quantified per mouse (n= 3–5 mice/group).
(F) Representative IHC images of temporal lobe from two healthy control patients stained with anti-GSDME.
To assess GSDME enrichment, we performed MACS purification of neurons vs. non-neuronal cells from mouse brain and performed western blot analysis (Fig 1D). We found clear GSDME signal in neuronal fractions that were also positive for neuronal beta-III-tubulin (Tuj1). GSDMD was absent in neurons. However, the non-neuronal fractions (Iba1+, Tuj1−) showed clear expression of GSDMD, but not GSDME (Fig 1D). Consistent with this analysis, transcriptomic data27 from FACS-isolated mouse microglia showed Gsdmd expression at baseline but sparse Gsdme detection in these same populations (Fig S1C). Co-staining sections of cortex and striatum showed high colocalization of GSDME with the neuronal marker Tuj1, and not the microglial marker Iba1 (Fig 1E), confirming neuron-specific enrichment of GSDME compared to microglia. Evidence from publicly available human single cell transcriptomic database demonstrated that GSDME, but not family members GSDMD, GSDMA or GSDMC, is expressed at baseline in human neurons (Fig S1D) 34. Temporal cortices from human brains were stained with anti-GSDME. We found GSDME expression in multiple cortical layers; these GSDME-positive cells showed a perikaryal staining pattern consistent with cytosolic expression in neurons (Fig 1F).
GSDME mediates neuronal damage caused by mitochondrial toxins
Mitochondrial toxins, such as rotenone and 6-OHDA, are intrinsic apoptotic stimuli often used to model features of neurodegeneration in vitro and in vivo 2,4. Given that GSDME is expressed at baseline in neurons, we sought to understand if toxin treatment could activate GSDME (Fig 2A). For this study we utilized several mitochondrial toxins: rotenone and 6-OHDA (complex I inhibitor), antimycin-A (complex III inhibitor) and raptinal (a rapid inducer of mitochondrial damage and caspase-3). We found that treatment of primary mouse cortical neurons and human SH-SY5Y cells with these mitochondrial toxins led to cleavage of full-length GSDME to the ~30 kDa N-terminal pore-forming fragment by immunoblot analysis (Fig 2B & S2A) and cell death as measured by lactate dehydrogenase (LDH) release and uptake of the membrane impermeant dye propidium iodide (PI) (Fig S1E–H). We confirmed specific GSDME cleavage following toxin treatment through immunoblot analysis of WT and GSDME KO SH-SY5Y cells generated using CRISPR-Cas9 targeting (Fig S2A). Thus, these toxins can be used as probes to explore the cell biological functions of GSDME.
Figure 2: GSDME is activated by mitochondrial toxins and contributes to cellular necrosis in neurons.

(A) Schematic of GSDME activation downstream of apoptotic stimuli and caspase-3 processing (biorender.com).
(B) Immunoblots of primary neurons treated with raptinal for 1h or rotenone for 8h.
(C) Representative 20X Images of wild-type or GSDME KO primary mouse cortical neurons 3h following treatment with raptinal or DMSO and stained with Sytox-Green.
(D-F) Primary neurons were incubated in propidium iodide (PI) containing media and treated with (D) raptinal, (E) rotenone or (F) antimycin-A. Images were taken every 3h for 24 hours.
(G) Area under the curve (AUC24h) measurements for PI uptake in wild-type and GSDME KO neurons treated with toxins.
(H) Wild-type and GSDME KO mouse cortical neurons treated with raptinal (1h), rotenone (2h) or antimycin-A (1h) were assessed for LDH release (24h).
(I-J) Representative images of primary neurons transfected with GFP-GSDME and incubated in media containing propidium iodide. These cells were imaged every 15 mins for 21 hours. (J) Formation of intracellular puncta, as well as PI uptake quantified over time. Each data point represents an average of 15 neurons.
We next determined whether loss of Gsdme impacts overt cell death downstream of mitochondrial toxin treatment. Gsdme KO primary mouse neurons showed significantly reduced SytoxGreen or PI uptake compared to WT neurons treated with the toxins raptinal, rotenone and antimycin-A (Fig 2C–G). These results were confirmed in GSDME KO SH-SY5Y cells, which were also protected from PI uptake induced by raptinal, rotenone, 6-OHDA, antimycin-A and 3-NP (Fig S2B–G). Challenge with ER stressors tunicamycin and thapsigargin also caused a GSDME-dependent PI uptake (Fig S2H–I). Toxin-induced LDH release was also partially rescued in GSDME deficient primary neurons and SH-SY5Y cells compared to controls, though these effects were modest (Fig 2H & S2H).
GSDME activation in neurons is caspase-dependent
Given that mitochondrial toxins classically activate caspase-3, which is upstream of GSDME cleavage6,7,14, we assessed whether GSDME-driven cell death is indeed caspase-dependent in neurons. Treatment with the pan-caspase inhibitor zVAD-FMK blocked raptinal-induced GSDME processing into its N-terminal fragment (Fig S3A–B). Incubation of SH-SY5Y and mouse primary cortical neurons with zVAD-FMK phenocopied the effect of GSDME knockout, decreasing PI uptake after toxin treatment (Fig S3C–F and supplementary video 1). By contrast, treatment with the RIP kinase inhibitors nec-1s and GSK ‘872 did not reduce toxin induced PI uptake in primary neurons, suggesting that necroptosis does not participate in mitochondrial toxin-driven death (Fig S3G–H).
Activated GSDME localizes to mitochondria
Neurons have large somas and fine dendritic and axonal processes (neurites). Given this unique morphology, we hypothesized that GSDME may act at specific subcellular compartments to drive cellular dysfunction prior to (or perhaps independent of) cell death. To investigate the intracellular dynamics of GSDME, we transfected mouse cortical neurons with full-length GFP-tagged GSDME (Fig S4A). We validated that GFP-GSDME maintained pore-forming and pyroptotic ability by transfecting this construct into HEK293T cells, which lack endogenous GSDME expression (Fig S4B–C). When transfected cells were treated with raptinal, we observed caspase-3 processing, cleavage of GFP-GSDME, rapid PI+ uptake and pyroptotic morphology (Fig S4C–F). These changes were not observed in untransfected or GFP-transfected control cells (Fig S4D). Immunoblot time course analysis for GSDME activation revealed that cleavage of both endogenous GSDME or transduced GFP-GSDME were identical and concomitant with caspase-3 cleavage in primary mouse neurons (Fig S4G).
Following raptinal treatment of neurons, GFP-GSDME rapidly formed numerous intracellular puncta in the distal neurites by 45 minutes, and eventually proximal neurites and cell bodies by 75 minutes (Fig. 2I–J). GFP-GSDME puncta were predominantly dispersed in the cytosol, in contrast with the human neuroblastoma cell line that had both plasma membrane and cytosolic enrichment (Fig S5A–B). The appearance of GSDME puncta in the distal and proximal neurites preceded PI uptake (necrosis) by several hours (Fig 2I–J). To assess whether the neurite associated puncta represent local sites of activated GSDME, we pre-treated the neurons with zVAD-FMK (caspase inhibitor), at a concentration that blocked GSDME cleavage (Fig S3A–B). Early toxin-induced puncta formation was inhibited by zVAD-FMK (Fig S5D–E). In primary GFP-GSDME expressing neurons treated with raptinal, we observed only a small degree of membrane colocalization apparent 6–10h post-toxin exposure (Fig S5C). This data suggests that in neurons, intracellular GSDME localization may occur much earlier than the plasma membrane involvement (and PI uptake) classically described in pyroptosis.
Given the ability of GSDME and GSDMD to bind cardiolipin7, we tested the hypothesis that intracellular GSDME may be localized to mitochondria along the neurites. Cortical neurons were co-transfected with GFP-GSDME and with mKate-OMP25 to allow visualization of the outer mitochondrial membrane (OMM). We analyzed the fraction of GSDME that colocalized with OMP25 in the distal axons and found raptinal treatment resulted in a 1.5-fold increase in enrichment of GSDME on axonal and cell body mitochondria (Fig. 3A–C and S6A–B). In addition to raptinal, the mitochondrial toxin rotenone also caused rapid co-localization of GFP-GSDME with mKate-OMP25+ mitochondria (Fig S6C–E). Immunoblot analysis of fractionated lysates from raptinal-treated SH-SY5Y cells (Fig S6F) and primary cortical neurons revealed a three-fold enrichment of endogenous cleaved GSDME in mitochondria compared to cytosolic fractions (Fig S6G–J). GSDME colocalization with mitochondria was also associated with release of the inner mitochondrial membrane protein, cytochrome-c, into the cytosol (Fig S6 I, K–L). Previous studies have shown that mitochondrial toxins such as rotenone and 6-OHDA cause cardiolipin externalization to the OMM in both primary cortical neurons and SH-SY5Y cells28,29. Short-hairpin RNA (shRNA)-mediated knockdown of cardiolipin synthase (CLS1) partially decreased GFP-GSDME puncta formation in toxin-treated primary neurons (Fig S7 A–C). This data suggests that following activation, GSDME localizes to neuronal mitochondria in a partially cardiolipin-dependent manner.
Figure 3: Activated GSDME rapidly localizes to neuronal mitochondria following toxin treatment.

(A-C) Representative images of a mouse neuron co-transfected with mitochondrial marker mKate-OMP25 and GFP-GSDME imaged before and after raptinal treatment (90mins). (B) The location of mitochondria (red) and GFP-GSDME (green) peaks as measured via line scans along the neurites. (C) The enrichment of green GSDME signal at mitochondria (red) over the background (diffuse cytosolic intensity) were quantified from such line scans along neurites. N= 30 neurite segments representing 10 neurons across 3 wells.
(D-F) Representative image of a microfluidic chamber plated with wild-type mouse cortical neurons transfected with GFP-GSDME and mKate-OMP25. The axonal chamber was treated with raptinal for 2.5h. Images of proximal neurites (left) and a distal axon segment (right) before and after raptinal treatment are shown. Enrichment of GFP-GSDME on mitochondria in (E) proximal and (F) distal chambers were quantified (N = 50 distal and 50 proximal neurite segments taken from three microfluidic chambers.)
(G-H) Representative images of mouse neurons transfected with GFP-GSDME and either (G) mKate-OMP25 or (H) Cox8-mCherry. These cells were treated with raptinal, fixed and imaged using structured illumination microscopy (SIM).
We next asked whether local toxin-exposure can induce GSDME activation in axons, without involvement of the soma. We plated mouse cortical neurons in microfluidic chambers, which allowed for selective treatment of the axonal compartments with toxin (Fig 3D). Raptinal exposure caused GFP-GSDME puncta formation and mitochondrial colocalization in axons without affecting the untreated (soma) compartment of the same cell (Fig 3D–F). These data suggest that mitochondrial stress leads to enrichment of GSDME on neuronal mitochondria and can occur locally in axons.
High resolution structured illumination microscopy (SIM) of toxin-treated neurons transfected with GFP-GSDME revealed robust puncta formation colocalizing with the OMM marker mKate-OMP-25, but not with the matrix marker Cox8-mCherry (Fig 3G–H; supplementary videos 2–3). These results suggest that toxin treatment targets activated GSDME to mitochondrial membranes.
GSDME localizes to mitochondria in human iNeurons
Human iPSC derived neurons (iNeurons) are postmitotic, electrically active, and thus more representative of human neurons than SH-SY5Y 30. We generated glutamatergic neurons similar to layer 2/3 glutamatergic neurons of the cerebral cortex and investigated GSDME activation in these cells31. We found raptinal treatment induces a dose dependent GSDME cleavage in iNeurons (Fig S8A). The activation of GSDME in iNeurons was blocked in the presence of the caspase inhibitor zVAD-FMK (Fig S8B). iNeurons transfected with GFP-GSDME and mKate-OMP25 also showed robust mitochondrial colocalization upon toxin treatment, with a large number of mitochondria in the distal neurites (Fig S8C–E).
Gsdme deficiency protects neurons from mitochondrial damage
We next asked whether GSDME enrichment on neuronal mitochondria potentiates damage to these organelles. To assess the functional consequences of GSDME mitochondrial colocalization in neurons, we performed TMRM staining following toxin treatment. TMRM is a voltage sensitive mitochondrial dye that loses fluorescence following mitochondrial depolarization32. Treatment of wild-type primary neurons with raptinal, rotenone or antimycin-A, led to dose dependent TMRM loss. Depolarization was partially rescued in Gsdme KO primary cortical mouse neurons and SH-SY5Y (Fig 4A and Fig S9A–D). These experiments suggest that downstream of an initial mitochondrial insult (i.e., toxin exposure), GSDME potentiates or accelerates mitochondrial damage. To assess how GSDME impacts mitochondrial membrane integrity we transfected WT and KO cortical neurons with mKate2-OMP25 and treated with toxin. After 2h and 4h of treatment (but not by 1h), Gsdme KO neurons had preserved OMP-25 signal, suggesting a sparing of the OMM relative to WT cells (Fig 4B–C). To directly visualize the structural integrity of mitochondria, we performed transmission electron microscopy (TEM) of WT and Gsdme KO neurons treated for 1h with raptinal. Analysis of TEM images revealed that raptinal-treated WT mitochondria had less pronounced cristae and increased fragmentation (reduced length) compared to those in Gsdme KO neurons (Fig 4D–E). Raptinal-treated WT neurons also displayed a high percentage of mitochondria with damaged inner or outer membranes, while Gsdme KO neurons were almost completely rescued (Fig 4F).
Figure 4: GSDME deficient neurons are protected from toxin-induced mitochondrial dysfunction.

(A) Wild-type and GSDME knockout primary neurons were stained with TMRM and incubated with rotenone. Images were captured every 15 min and TMRM intensity normalized to DMSO controls.
(B-C) Wild-type and GSDME knockout primary neurons were transfected with mKate-OMP25 and treated with raptinal. (B) Representative images at 4h post-raptinal treatment. (C) Mitochondrial density was calculated by counting OMP-25+ objects and dividing by neurite length at 0, 1h, 2h and 4h post-raptinal treatment.
(D-F) Representative transmission electron microscopy images (TEM) of wild-type and GSDME KO neuronal cultures treated with either DMSO or raptinal for 1h. (E) Mitochondrial length (dot = 1 mitochondrion) and (F) percentage of damaged mitochondria (dot = average of 2 wells) were calculated across three independent experiments.
(G) Wild-type and GSDME KO mouse neurons transfected with mKate-OMP25, treated with raptinal and imaged at high temporal resolution (1 image/5s) for 3 min intervals. These intervals were captured at 0h, 1h and 2h post-toxin exposure.
(H) Kymograph analysis was performed to visualize and quantify mitochondrial motility.
Percent motile mitochondria was calculated from kymograph analysis of wild-type and GSDME KO neurons treated with raptinal. Combined data from three independent experiments are shown.
Cyt-c release into the cytosol indicates OMM damage. Raptinal treatment caused rapid (<1h) cyt-c release in WT cortical neurons and SH-SY5Y (Fig S6 G, I). Immunoblots for cyt-c revealed that toxin treated GSDME KO SH-SY5Y displayed a significantly higher mitochondrial to cytosolic cyt-c ratio relative to WT cells (Fig S6 K–L), suggesting rescued OMM damage (i.e., cyt-c release). Consistent with less mitochondrial depolarization and cyt-c release, GSDME KO SH-SY5Y also exhibited reduced caspase-3 activation relative to WT cells (Fig S10A–C) 40. Gsdme KO cortical neurons treated with raptinal, also had partially reduced caspase-3 activation relative to WT neurons (Fig S10D–E); however, the extent of caspase-3 rescue in neurons was less than in SH-SY5Y. When taken together, these data indicate that GSDME participates in a positive feedback loop (Fig 2A) to amplify mitochondrial damage and downstream caspase-3 activation in SH-SY5Y and primary mouse neurons.
Destruction of axonal mitochondria or disruption of trafficking to distal axons is an early step in many neurodegenerative diseases 1,3. If GSDME destroys mitochondrial membranes following toxin exposure, we reasoned that fewer mitochondrion would resume normal trafficking after toxin withdrawal. To determine how GSDME impacts mitochondrial trafficking, we transfected primary neurons with mKate-OMP25 and took high timescale images in WT and Gsdme KO cells treated with toxins. At baseline, we noticed no differences in mitochondrial movement (percent motile) between the two genotypes (Fig 4G–H). Treatment of WT cultures with raptinal caused a striking arrest of motility at 1h and 2h post-treatment, as displayed in kymograph analyses (Fig 4G). This arrest was reduced in Gsdme KO neurons, which had more motile mitochondria at these timepoints (Fig 4H).
GSDME regulates neurite integrity and mitochondrial potential
Axons require a constant supply of energy to maintain structural integrity and synaptic function1. Given that GSDME promotes mitochondrial depolarization and reduces motility following toxin exposure, we hypothesized that GSDME KO neurons would have reduced degeneration of axonal processes. Following 30 min (raptinal, antimycin-A) or 2h (rotenone) of treatment with toxins, cells were incubated in fresh media for 8h and then stained for beta-III-tubulin (Tuj1). WT neurons displayed a dose dependent increase in the ratio of depolymerized to polymerized beta-III-tubulin (Fig S10F–G). Higher levels of depolymerized tubulin indicate microtubule disassembly and axonal degeneration 33.
Toxin-treated WT cells exhibit a higher ratio of depolymerized (clumpy and round) to total beta-III-tubulin; GSDME knockout cells demonstrated a striking preservation of axonal processes containing polymerized tubulin (Fig 5A–D). At these timepoints, release of LDH from WT and KO neurons was minimal, indicating that GSDME increases axonal destruction prior to overt cellular necrosis (Fig S10H). Incubation of toxin-treated WT cells with zVAD-FMK also reduced the microtubule depolymerization index, phenocopying the effect of GSDME knockout and agreeing with prior findings (Fig S10I) 3,34. Collectively, these experiments suggest that the caspase-3/GSDME axis is necessary to disrupt mitochondrial health, motility and structural integrity in neurites before it causes overt cell death at the soma.
Figure 5: GSDME knockout protects against neurite loss and local mitochondrial damage.

(A) Representative images of wild-type and GSDME knockout neurons treated with DMSO, raptinal, rotenone and antimycin-A, and stained for Tuj1, 8h post-toxin treatment. (B-D) Microtubule depolymerization index was calculated for wild-type and KO neurons treated with (B) raptinal (C) rotenone or (D) antimycin-A. Violin plots display the median and interquartile ranges for depolymerization index taken from three independent experiments.
(E) Representative image of a microfluidic chamber plated with wild-type mouse cortical neurons stained with TMRM. The panel represents the chamber prior to addition of raptinal. The black dashed box indicates an axonal region magnified in (F).
(F) Representative images of axonal segments from wild-type and GSDME KO neurons before and after (60 min) addition of 5uM Raptinal and stained with TMRM.
(G) Quantification of TMRM intensity relative to baseline (t=0) from the axonal chambers of plated wild-type and GSDME KO neurons. Axonal segments from three wild-type and three KO microfluidic chambers were used for analysis (n=3).
Using microfluidic chambers, we found that GSDME can be locally activated in axons and rapidly colocalizes with mitochondria (Fig 3D). To determine the effect of this local GSDME activation on axonal mitochondrial health, we plated neurons in microfluidic chambers and stained with TMRM (Fig 5E & S10J–K). We examined WT and GSDME KO axonal compartments treated with toxins for differences in TMRM staining. Raptinal caused a rapid and pronounced loss of TMRM positivity in WT cells, which was partially rescued in GSDME KO neurons (Fig 5E–F). While long term raptinal exposure leads to total TMRM loss, brief (30min-2h) treatment causes mitochondrial depolarization that is strongly GSDME-dependent (Fig 5G). These data argue that GSDME can be activated locally to destroy mitochondria, in the absence of overt changes at the cell body.
GSDME is sufficient to drive mitochondrial damage and neurite loss.
Expression of N-terminal GSDME fragment (N-GSDME) in primary mouse neurons was also sufficient to drive mitochondrial colocalization in cell bodies and axons (Fig S11A–B). SIM microscopy analysis revealed overlap of GFP-N-GSDME and OMP-25 in both neurons and SH-SY5Y cells. Only in SH-SY5Y cells did we observe readily apparent GFP-GSDME enrichment on plasma membrane (Fig S11C–D). Expression of N-GSDME in primary cortical neurons was also sufficient to cause mitochondrial potential loss (Fig S11E–F) and neurite damage as measured by Tuj1 staining (Fig S11G–H). Thus, N-GSDME expression phenocopies results obtained following chemical activation of GSDME using toxin treatment.
ALS/FTD-associated proteins induce GSDME activation
Neurodegenerative conditions like ALS and FTD are characterized by early axonopathy that precedes loss of the neuronal soma 20,21,35,36. Given that GSDME can drive axonal mitochondrial damage prior to cell death, we examined whether neurodegeneration-associated proteins would engage GSDME 27,43,44. To test whether ALS/FTD associated proteins induces GSDME cleavage and mitochondrial localization in our in vitro system, we focused on the role of TDP-43 and the C9orf72 hexanucleotide mutation-associated dipeptide repeat protein (DPR), PR-50. TDP-43 aggregates have been shown to bind mitochondria, leading to complex I inhibition and mitochondrial depolarization 37–39. DPRs produced from mutated c9orf72 have also been shown to impair mitochondrial function (complex V activity), leading to caspase-3 dependent axon loss33,40,41.
Mouse cortical neurons were transfected with TDP-43, PR-50 or iRFP control plasmids to model neurodegeneration in a dish33. Co-expression of TDP-43 or PR-50 with GFP-GSDME led to increased GFP-GSDME puncta (Fig 6A–B). These puncta were enriched in mitochondria along neurites. Treatment of WT cortical neurons with lentiviruses encoding control (GFP), TDP-43 or PR-50 under control of a synapsin-I promoter, also led to cleavage of endogenous GSDME at 72h post-transduction, indicating its activation (Fig 6C and Fig S12A).
Figure 6: FTD/ALS proteins cause GSDME-dependent mitochondrial depolarization and neurite loss.

(A) Primary mouse neurons transfected with GFP-GSDME, mKate-OMP25 and either PR-50, TDP-43 or iRFP were imaged 48h post-transfection. White boxes on the top panels indicate magnified axonal segments (bottom panels).
(B) Quantification of the number of GFP-GSDME puncta and percentage of mitochondria enriched in GFP-GSDME, from neurons 48h after transfection with either iRFP, PR-50 or TDP-43 plasmids.
(C) Immunoblots of primary mouse neurons transduced with lentiviruses encoding PR-50, GFP, TDP-43 or no virus. Lysates were collected at 72h post-transduction.
(D-E) Primary mouse neurons transduced with lentivirus encoding either (D) PR-50 or (E) TDP-43 and stained with TMRM. 20X images were taken every 4h, starting 24h post-transduction. TMRM intensity per well was quantified and normalized relative to baseline levels (N=2 independent experiments, four technical replicates per condition).
(F-I) Representative images of wild-type and GSDME KO primary mouse neurons transduced with GFP control, (F) PR-50 or (H) TDP-43. Neurons were fixed and stained for Tuj1 4d post-transduction. Tuj1 quantification of microtubule depolymerization index from mouse neurons transduced with GFP control, (G) PR-50 or (I) TDP-43. Violin plots display the median and interquartile ranges for depolymerization index taken from three independent experiments.
(J-K) Wild-type and GSDME KO mouse cortical neurons were transduced with (J) TDP-43 or (K) PR-50 lentivirus and assessed for LDH release 4d post-transduction.
GSDME mediates TDP43 and PR-50 induced neurite loss
We next asked whether GSDME could contribute to neuronal dysfunction caused by ALS/FTD associated proteins in mouse neurons. We treated neurons with lentiviruses encoding TDP-43, PR-50 or GFP. WT neurons transduced with TDP-43 and PR-50 exhibited both significant neurite loss and mitochondrial depolarization indicated by loss of TMRM staining at 72h and 96h post-treatment (Fig. 6D–E and Fig S12B). GSDME KO cells had reduced mitochondrial depolarization compared to WT neurons (Fig 6D–E and Fig S12B). These experiments indicate that ALS/FTD associated proteins can cause GSDME activation, mitochondrial localization and mitochondrial depolarization that partially relies on GSDME.
Human iNeurons express full-length GSMDE at baseline (Fig S8A). To ask whether neurodegeneration-associated proteins could activate GSDME in human cells, we transfected cortical iNeurons with plasmid encoding TDP-43. Transfected neurons exhibited robust GFP-GSDME puncta that colocalized with mitochondria (Fig S12C–D). As in mouse neurons, we found that lentiviral transduction with FLAG-tagged TDP-43 (at MOI 4 and 8) led to cleavage of endogenous GSDME relative to GFP transduced controls (Fig S12E). When taken together, these data suggest that a diverse range of neurotoxic stimuli—mitochondrial toxins, PR-50, TDP-43 can lead to downstream GSDME activation and mitochondrial colocalization in both mouse and human neurons.
Next, we assessed whether these GSDME KO neurons would have spared neuritic processes. We took two complimentary approaches to answer this question. First, we transfected neurons with RFP and either GFP (control) or TDP-43 or PR-50 plasmids. We then measured neurite area of transfected cells using the RFP expression as a marker. Compared to WT neurons, GSDME KO cells transfected with PR-50 or TDP-43 had preserved neurite area (Fig S12F–I). We also used lentiviruses encoding either PR-50 or TDP-43 and measured resulting microtubule depolymerization index in cortical neurons at 72h (TDP-43) or 96h (PR-50) post-transduction. GSDME KO neurons were protected from neurite loss, with results mirroring those obtained using mitochondrial toxins (Fig 6F–I). At these timepoints there was minimal LDH release from WT and KO cells compared to untransduced controls (Fig 6J–K). This indicates that GSMDE mediates TDP-43 and PR-50 dependent axonal loss prior to cellular necrosis; thus, GSDME can perform important cellular functions in the absence of cell death.
GSDME drives neurite loss in patient-derived ALS neurons
To determine potential relevance to human disease, we mined genome-wide expression profiling data of laser capture microdissection-enriched motor neurons from patients with sporadic ALS (sALS)42. We found that GSDME was significantly upregulated in neurons from sALS patients relative to age-matched healthy controls; GSDMD expression was not detected in these cells (Fig S13A).
We next investigated whether GSDME contributes to neuronal dysfunction in human ALS patient iPSC-derived motor neurons. To model human neurodegeneration in vitro, we cultured wild-type iPSC-derived (1016A) and ALS patient iPSC-derived (TDP43G298S) lines that were differentiated into mature MNs. These cells were validated by sequencing, karyotyping and immunostaining for motor neuron marker Islet 1/2 (Fig S13B–E). Challenge of these iMNs with a proteasome inhibitor (MG132) or ER-stress toxins (thapsigargin and tunicamycin) led to dose dependent neurite loss and cell death; these effects are exacerbated in the mutant TDP43G298S line (Fig S14A–D)43.
We optimized knockdown of GSDME in human iPSC-derived motor neurons by testing two GSDME shRNA lentiviruses vs. scrambled control (Fig. S14E–F). TDP43G298S motor neurons (in presence of a scrambled shRNA) were highly vulnerable to neurite destruction caused by MG132, tunicamycin or thapsigargin (Fig 7A). By contrast, knockdown of GSDME using lentiviral delivery of two targeting shRNAs led to significant sparing of neurite loss in TDP43G298S iMNs (Fig 7). Collectively, these results suggest that GSDME drives pathology downstream of ER-stress and proteasome inhibition in vulnerable neurons with a TDP43G298S genetic background. Thus, GSDME deficiency can rescue neurite loss in a patient-derived ALS model.
Figure 7: GSDME knockdown rescues neurite loss in ALS iPSC-derived motor neurons.
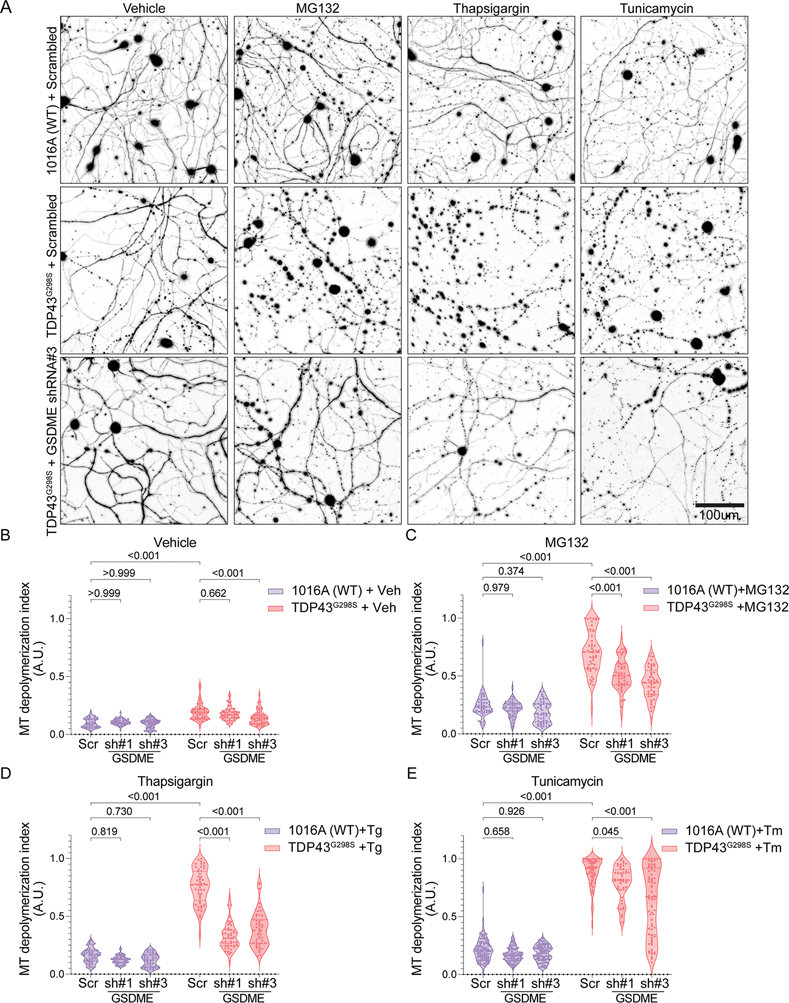
(A) Representative Tuj1 staining of control 1016A (wild-type) or TDP43G298S iPSC-derived motor neurons transduced with either scrambled shRNA or GSDME targeting shRNA and treated with either DMSO (vehicle), tunicamycin, MG132 or thapsigargin (48h post-toxin treatment).
(B-E) Microtubule depolymerization index was calculated for 1016A (wild-type) and TDP43G298S motor neurons treated with (B) 0.1% DMSO (vehicle) (C) 1uM MG132 (D) 0.5uM of thapsigargin
(E) 5uM tunicamycin and either scrambled shRNA or GSDME targeting shRNAs. Violin plots display the median and interquartile ranges for depolymerization index (N=6 technical replicates).
GSDME impacts survival and motor neuron loss in SOD1G93A mice
We next aimed to determine whether GSDME is functionally relevant in an animal model of neurodegeneration. Mice expressing a human SOD1G93A transgene linked to ALS develop progressive motor neuron loss in the ventral spinal cord and paralysis44. Both in vitro and in vivo studies have shown that mutant SOD1 proteins induce mitochondrial dysfunction, impaired ATP production, inefficient calcium buffering and increased apoptosis of motor neurons 23,24,45. To assess the relevance of GSDME in vivo, we first probed spinal cord lysates from SOD1G93A mice at different time points of disease. We detected GSDME cleavage in spinal cords of symptomatic SOD1G93A mice at postnatal day 140 (P140), which was further increased by late-stage of disease (P160) (Fig 8A–B, Fig S15A–B). Cleaved GSDME was not detected in pre-symptomatic P82 animals (Fig S15A). Given this activation pattern, we hypothesized that GSDME may contribute to disease progression in the SOD1G93A model. We generated transgenic mice hemizygous for the SOD1G93A transgene and were either wild-type (SOD1G93A GSDME WT) or knockout for GSDME (SOD1G93A GSDME KO). By RT-qPCR, we confirmed that experimental animals had similar copy numbers of the SOD1G93A transgene irrespective of WT or KO GSDME genotype (Fig S15C).
Figure 8: GSDME knockout rescues SOD1G93A pathology in a mouse model of ALS.

(A-B) Immunoblots of spinal cord lysates from SOD1G93A transgenic mice and wild-type controls at (A) end-stage (P162) and symptom onset (P140). (B) The levels of GSDME N-terminal (GAPDH normalized) as well as the ratio of NT- to full-length- GSDME was quantified (n=3–6) for each timepoint and genotype.
(C-E) Transgenic (C) mixed gender mice that were either SOD1G93A GSDME WT (N=31 total) or SOD1G93A GSDME KO (N=38 total) were followed for survival. These Kaplan-Meier curves are displayed separately for (D) male SOD1G93A GSDME WT (N=17) and SOD1G93A GSDME KO (N=22) and (E) female SOD1G93A GSDME WT (N=14) and SOD1G93A GSDME KO (N=20) animals. (F) The age of maximum weight for each mouse was used to as a measure of disease onset (Kaplan-Meier plot).
(G) The time from maximum weight until euthanasia/death was used as a measure of disease progression.
(H) Grip strength was tracked for each mouse and normalized by bodyweight.
(I) Representative Nissl-stained images of lumbar spinal cord from SOD1G93A GSDME WT and SOD1G93A GSDME KO animals at P150. Magnified regions (white box) delineate a ventral horn area of a spinal cord section.
(J) Quantification of Nissl+ motor neurons per ventral horn of the spinal cord. Each dot represents the average of 6–8 lumbar spinal cord sections from a single mouse.
Knockout of GSDME significantly extended survival and delayed disease progression in mice containing the SOD1G93A transgene (Fig 8C). Mean survival for SOD1G93A GSDME WT mice (N=31 total) was 159 days (±1.9), while that of SOD1G93A GSDME KO mice (N=38 total) was 171 days (±2.5) (Fig 8C). Female SOD1G93A GSDME KO animals received a slightly greater survival benefit (mean = 178d) relative to SOD1G93A GSDME WT mice (mean = 160d) compared to males (Fig 8D–E & Fig S15F). Age to maximum body weight in SOD1G93A animals, and body weight measurements at all timepoints were unaffected by GSDME genotype (Fig 8F & Fig S15D). This data indicates that disease onset may not be GSDME dependent. However, disease progression—time from maximum body weight until euthanasia—was delayed in SOD1G93A GSDME KO animals relative to SOD1G93A counterparts (Fig 8G). Loss of grip strength was also delayed in SOD1G93A GSDME KO compared to SOD1G93A mice (Fig 8H). No baseline differences in grip strength were recorded for non-SOD1 transgenic (nTg) GSDME WT and GSDME KO animals (Fig S15E). These results indicate that GSDME impacts the disease progression phase in this animal model, leading to an overall motor and survival benefit.
Blinded histological counting of Nissl-stained motor neurons in spinal cord ventral horns showed a preservation of neurons in SOD1G93A GSDME KO mice at P150 (late-stage) relative to age-matched SOD1G93A GSDME WT littermates (Fig 8I–J). This is consistent with grip strength and behavioral observations (Fig 8H & supplementary video 4). Microglia and astrocyte activation are hallmarks of disease progression in the SOD1 mouse model of ALS and in human ALS patient spinal cord 46–50. We observed that GSDME KO mice showed decreased intensity of GFAP+ astrocytes (astrogliosis) in the ventral horns of SOD1G93A animals (Fig S16A–B). SOD1G93A GSDME KO animals also had decreased microgliosis, as measured by the number of Iba1+ positive cells in the ventral horn and levels of the lysosomal activation marker CD68 (Fig S16C–F). Taken together, this data suggests that GSDME is activated in a classic mouse model of ALS and drives pathology—namely neuronal loss and gliosis—that contributes to decreased motor function and survival.
Discussion
Mitochondrial dysfunction and axonal loss are important and early hallmarks of neuronal injury. A wide range of upstream insults, such as aggregated proteins, toxins and age, all converge to induce mitochondrial damage1,5. Here we describe GSDME as a key regulator of mitochondrial health and axon loss in neurons downstream of multiple classes of harmful neurotoxic stimuli62,63. In contrast to prior work describing a role for gasdermins in pyroptotic cell death, we show that GSDME-mediated mitochondrial damage and neurite loss can occur in neurons in the absence of overt cell death.
Thus, we expand the cell biological role for this class of pore-forming proteins, showing that GSDME activation has consequences that are specific to neurons in driving axon loss, and distinct from pyroptosis. Prior work has mainly explored GSDME activation in cancer cell lines, focusing on its contribution to cell necrosis 7,19,51. In cancer cells treated with DNA-damaging agents (e.g. UV radiation, etoposide) GSDME colocalizes with mitochondria and mediates cytochrome-c release to amplify caspase-3 processing6,51. Work in a mouse model of macular degeneration and a murine retinoblastoma cell line has also implicated GSDME in cytochrome-c release and caspase-3 activation in the sensory neuroepithelium17.
We establish this positive feedback loop in primary neurons and map it locally to axons and neurites. We further show that GSDME driven mitochondrial damage is critical to amplify downstream neurite loss. That GSDME activity can occur locally in axons, without apparent involvement of the cell body, raises the possibility that GSDME activation could be a key early step in axonopathy.
Neurons may utilize multiple pore-forming molecules to regulate mitochondrial membrane integrity in addition to GSDME; namely pro-apoptotic BCL-2 family members (e.g. Bax, Bak), and the mitochondrial permeability transition pore (MPTP). Indeed, recent work has shown that GSDMD can act upstream of Bax and VDAC1 channels, promoting their incorporation into mitochondrial membranes. Another study demonstrated that GSDMD mitochondrial pores can promote mtROS production in macrophages, and thereby activate downstream necroptotic machinery13. This raises the possibility that other pore-forming molecules, such as MLKL, could amplify plasma membrane damage in neurons after GSDME-mediated mitochondrial disruption.
Destruction of axons is an early step in conditions such as neurodegeneration, peripheral neuropathy, and stroke 20,21,52. We believe that our findings using microfluidic compartments, are the first to suggest that GSDME activation can be restricted to axons and drive local mitochondrial damage. Thus, our study positions GSDME as a molecule that may work alongside calpains, SARM1, KIF2A, MAPK-JNK and other effectors to disrupt axons 26,40,67,68. SARM1 has been shown to regulate the extent of GSDMD-driven pyroptosis in immune cells 53. The MAPK-JNK signaling axis promotes SARM1-dependent axonal degeneration in vivo but is also an upstream regulator of GSDME activity in cancer cells 54–56. It is of great interest to determine if SARM1, calpains, JNK and GSDME function in a common pathway leading to axon degeneration.
We found that GSDME is activated by overexpression of neurodegeneration associated proteins. TDP-43 has been shown to bind and directly damage mitochondria, leading to release of mtDNA and cGAS-STING activation38. C9orf72 DPRs directly inhibit mitochondrial complex V, leading to membrane depolarization and neuronal death57. Motor neurons of patients and mice carrying SOD1 mutations, have impaired electron transport chain function, disrupted mitochondrial ATP production and inefficient calcium buffering, and enhanced caspase-3 activation 23,45,50. Thus, multiple neurodegeneration associated proteins converge as mitochondrial insults, and thereby activate the GSDME pathway.
Previous studies have found that activation of GSDME impacts mouse models of tumor progression, chemotherapy induced lung damage, cisplatin-induced kidney injury, macular degeneration and inflammatory bowel disease 16,17,19,58,59. We believe our work to be the first report of GSDME’s significance in a classic in vivo (SOD1G93A) model of motor neuron disease. Mapping how GSDME promotes neuroinflammation—either via neuronal release of pro-inflammatory cytokines, damage-associated molecules, or secreted factors—will be an important basic step in understanding its role in disease pathophysiology.
Our work positions GSDME as an intrinsic executioner of axon degeneration in neurons. When activated by a range of neurotoxic stimuli, GSDME drives destruction of mitochondria, enhanced caspase-3 activation, neuritic retraction in vitro, and contributes to disease progression in an ALS mouse model. Given its wide expression in the brain, GSDME may function in broad contexts, including in normal development, pathogen infection and aging, which may warrant future investigation. Small-molecule inhibitors of GSDMD activation have been identified 60,61, though it is unclear whether GSDME is similarly druggable. Future work should determine the feasibility of targeting GSDME expression or function. Ultimately, determining how multiple cell death axes—gasdermin, caspase, BCL-2, calpain, and necroptotic machinery—synergize to enhance neuronal damage may suggest new therapeutic strategies for neurodegenerative disease.
Limitations of this study
In vitro analysis using mouse and iPSC-neurons allows for well controlled pharmacological and genetic manipulation, not possible in vivo. However, cultured mouse and human iPSC-derived neurons do not recapitulate the complexity of the nervous system. Though our work shows that Gsdme deficiency is protective in a mouse model of ALS by extending survival and motor neuron survival—we did not directly implicate GSDME-driven mitochondrial damage in disease pathogenesis in vivo—GSDME pores in mitochondrial and plasma membranes could both contribute to disease pathology. Future experiments directly assessing whether SOD1G93A Gsdme deficient animals have increased numbers of intact, polarized mitochondria relative to SOD1G93A counterparts would strengthen our conclusions. Our analysis of human iPSC-derived motor neurons only involves one patient derived cell line and a normal control—since we do not use isogenic controls, we cannot exclude the possibility that other genetic factors influence our phenotype following GSDME knockdown. Lastly, experiments showing in vivo GSDME cleavage and immunostaining are inherently limited by time resolution—cell death proteins are difficult to detect in vivo due to their transitory nature. Increased sampling of tissues from mouse models and human patients will elucidate how this molecule is regulated during disease.
STAR Methods
RESOURCE AVAILABILITY
Lead contact
Further information and requests for resources and reagents should be directed to and will be fulfilled by the lead contact, Isaac M Chiu (Isaac_chiu@hms.harvard.edu)
Materials availability
Reagents generated in this study are available from the lead contact with a completed Materials Transfer Agreement.
Data and code availability
Enrichment analysis of GSDME on mitochondria, quantification of GSDME puncta and analysis of microtubule depolymerization was done using custom Fiji (ImageJ) macros. The DOI is listed in the key resources table. Any additional information required to reanalyze the data reported in this paper is available from the lead contact upon request.
Key resources table.
| REAGENT or RESOURCE | SOURCE | IDENTIFIER (Cat# ; RRID) |
|---|---|---|
| Antibodies | ||
| Rabbit monoclonal anti-GSDME | Abcam | #ab215191 ; RRID:AB_2737000 |
| Rabbit monoclonal anti-GSDMD | Abcam | #ab209845 ; RRID:AB_2783550 |
| Rabbit monoclonal anti-Caspase-3 | Cell Signaling | #9662S ; RRID:AB_331439 |
| Mouse monoclonal anti-GAPDH | EMD Millipore | #CB1001 ; RRID:AB_2107426 |
| Rabbit monoclonal anti-Cytochrome-C | Cell Signaling | #11940S; RRID:AB_2637071 |
| Mouse monoclonal anti-ATPF1 | Abcam | #ab117991; RRID:AB_10901555 |
| Mouse monoclonal anti- ATP5A | Abcam | #ab14748; RRID:AB_301447 |
| Rabbit polyclonal anti-FLAG | Sigma | #F7425-.2MG; RRID:AB_439687 |
| Mouse monoclonal anti-Tuj1 | Thermo Scientific | #MA1-118X; RRID:AB_2536830 |
| Mouse monoclonal anti-GFAP | Cell Signaling | #3670S; RRID:AB_561049 |
| Rabbit monoclonal anti-Iba1 | Cell Signaling | #17198S; RRID:AB_2820254 |
| Rabbit monoclonal anti-CD68 | Cell Signaling | #97778S; RRID:AB_2928056 |
| Anti-rabbit IgG, HRP-linked Antibody | Cell Signaling | #7074; RRID:AB_2099233 |
| Biotinylated anti-Rb IgG secondary antibody | Vector | #BA-1000; RRID:AB_2313606 |
| Rabbit monoclonal anti-Isl1/2 | Abcam | #ab109517; RRID:AB_10866454 |
| Biological samples | ||
| Sections of human brain tissue, see table S1 | UPenn Center for Neurodegenerative Disease Research Biobank | NA |
| Chemicals, peptides, and recombinant proteins | ||
| Poly-ornithine | Sigma | #P3655-50mg |
| Laminin | Life Technologies | #23017-015 |
| Matrigel Basement Membrane Matrix | Corning | #354234 |
| Neurobasal Medium | Gibco | #21103 |
| Glutamax | Gibco | #35050 |
| Dextrose | Sigma | #D9434-250g |
| MEM NEAA | Invitrogen | #11140-050 |
| B27 | Life Technologies | #17504-044 |
| BDNF | Peprotech | #450-02 |
| GDNF | Peprotech | #450-13 |
| CNTF | Peprotech | #450-10 |
| Puromycin | Life Technologies | #A11138-03 |
| Doxycycline hyclate | Sigma | #D9891-5g |
| ROCKi (Y-27632) | Stemcell Technologies | #72304 |
| Raptinal | Sigma | #SML1745 |
| Rotenone | Sigma | #R8875 |
| Antimycin-A | Sigma | #A8674 |
| 3-NP | Sigma | #N5636 |
| T-per buffer | Thermo | #78510 |
| tablet protease inhibitor | Sigma | #11836153001 |
| HALT protease inhibitor | Thermo | #87786 |
| 1 tablet Phosstop™- phosphatase inhibitor tablets | Sigma/Roche | #04906845001 |
| RIPA lysis buffer | EMD Milipore | #20-188 |
| Z-VAD-FMK | R&D | #FMK001 |
| BOLT 4X Loading Buffer | Thermo | #B0007 |
| BOLT 10X Reducing Agent | Thermo | #B0009 |
| Propidium Iodide | Abcam | #ab14083 |
| Image-iT TMRM | Thermo Scientific | #I34361 |
| Sytox Green | Thermo Scientific | #S7020 |
| Rabbit SignalStain® Boost IHC detection Reagent | Cell Signaling | #8114 |
| Mouse SignalStain® Boost IHC detection Reagent | Cell Signaling | #8125 |
| TSA Fluorescien reagent | Akoya Biosciences | #NEL745001KT |
| TSA Cy3 reagent | Akoya Biosciences | #NEL744001KT |
| Prolong gold antifade mounting medium | Cell Signaling | #8961S |
| Sodium Citrate Buffer | Cell Signaling | #14746 |
| Hematoxylin | Cell Signaling | #14166 |
| Tunicamycin | Sigma | #T7765 |
| Thapsigargin | Sigma | #T9033 |
| MG-132 | Sigma | #M8699 |
| poly-D-lysine | Life Technologies | #A3890401 |
| Fibronectin | VWR | #47743-654 |
| EDTA unmasking solution | Cell Signaling | #14746 |
| Nissl Neurotrace Green | Thermo Scientific | #N21480 |
| Critical commercial assays | ||
| CytoTox LDH release assay | Promega | #G1780 |
| Supersignal West Pico Chemiluminescent Substrate | Thermo Scientific | #34080 |
| CellTiter-Glo® 2.0 Cell Viability Assay | Promega | #G9241 |
| Experimental models: Cell lines | ||
| SH-SY5Y | ATCC | #CRL-2266 |
| HEK-293 | ATCC | #CRL-1573 |
| NGN2 tetracycline-inducible iPSC | Tracey-Young Pearse Lab | NA |
| Experimental models: Organisms/strains | ||
| C57BL/6NJ mouse | Jackson Labs | RRID:IMSR_JAX:005304 |
| C57BL/6N-Gsdmeem1Fsha/J | Jackson Labs | RRID:IMSR_JAX:032411 |
| B6.Cg-Tg(SOD1*G93A)dl1Gur/J | Jackson Labs | RRID:IMSR_JAX:002299 |
| Oligonucleotides | ||
| Primer for GSDME RT-qPCR, see Table S2 | This paper | NA |
| Primer for GAPDH RT-qPCR, see Table S2 | This paper | NA |
| Primer for TDP-43 (iMN sequencing), see Table S2 | Wu et al., 2019 | NA |
| Recombinant DNA | ||
| EF1a-GFP-GSDME | Vector Builder | #VB201104-1086dgk |
| CMV-GFP PR50 | Gift from Petrucelli lab | NA |
| CMV-GFP PR50 | Gift from Petrucelli lab | NA |
| CMV-GFP | Gift from Petrucelli lab | NA |
| pLVX-Puro TDP43 WT | Addgene | #133753 |
| Syn1-mKate-OMP-25 | Vector Builder | #VB210702-1212jtf |
| Cox8-GFP | Addgene | #172481 |
| mTagRFP-Membrane-1 | Addgene | #57992 |
| Cardiolipin shRNA 1, see in Table S2 | This paper | NA |
| Cardiolipin shRNA 2, see in Table S2 | This paper | NA |
| Cardiolipin shRNA 3, see in Table S2 | This paper | NA |
| Scrambled shRNA, see in Table S2 | This paper | NA |
| GSDME shRNA 1, see in Table S2 | This paper | NA |
| GSDME shRNA 2, see in Table S2 | This paper | NA |
| GSDME shRNA 3, see in Table S2 | This paper | NA |
| Lenti-Syn-PR50 | Gift from Gitler lab 33 | NA |
| Lenti-Syn-eGFP | Gift from Gitler lab 33 | NA |
| Lenti-Syn-TDP43 | Gift from Gitler lab 33 | NA |
| Software and algorithms | ||
| ImageJ v 1.4 | National Institutes of Health | https://imagej.nih.gov/ij/ |
| Graphpad Prism v 8.0 | GraphPad Software | https://www.graphpad.com |
| ImageJ code for depolymerization index | This paper: | https://www.doi.org/10.5281/zenodo.7622539 |
EXPERIMENTAL MODEL AND SUBJECT DETAILS
Animals
All mouse experimental procedures were performed in compliance with the Harvard Medical School and The Jackson Laboratory Institutional Animal Care and Use Committees. C57BL/6NJ (JAX #005304), C57BL/6N-Gsdmeem1Fsha/J (JAX #032411), and SOD1G93A mice (JAX #002299) mice were obtained from Jackson labs and bred at Harvard Medical School. Animal experiments were fully approved by the Harvard Medical School Institutional Animal Care and Use Committee (IACUC). Animals were housed in temperature (22 ± 2 °C) and humidity (55 ± 5%) controlled care facilities at Harvard Medical School on a 12 h light:dark cycle and provided with freely available food and water.
SOD1G93A mice:
SOD1G93A mice (JAX #002299) were originally acquired from Jackson Laboratory (Bar Harbor, ME). The SOD1G93A GSDME KO mice were obtained by crossing male mice carrying the SOD1G93A transgene with female GSDME KO (JAX #032411) mice for 3 generations. The control SOD1G93A GSDME WT mice, were obtained by crossing SOD1G93A mice with wild type female mice having a B6NJ background (JAX #005304), also for 3 generations. This breeding strategy controlled for any strain background related phenotypic differences. All offspring were tested for equivalent SOD1 gene copy numbers by qPCR (forward primer: CAGTAACTGAGAGTTTACCCTTTGGT; and reverse primer: CACACTAATGCTCTGGGAAGAAAGA). Mice that had SOD1 signal drop-off of more than 30% from control SOD1G93A mice were considered as low copy number animals and were excluded from the study. Both male and female mice were used for all experiments. Animals were provided with food and water ad libitum.
Cell cultures
Primary mouse neurons:
Mouse (C57BL/6NJ or C57BL/6N-Gsdmeem1Fsha/J) primary cortical neurons were dissociated and cultured using the Worthington Papain Dissociation System (Worthington Biochemical, cat # LK003153). Briefly, post-natal day 0 (P0) mouse cortices were dissected and collected in cold Earle’s Balanced Salts (EBSS). Cortices were then resuspended in 2.5 ml of warmed EBSS with papain (20 units ml−1) and DNase (2000 units ml−1). Following a 12 min incubation at 37°C, cortices were triturated 12 times using a 10mL glass pipette, and then 12 times using an 18G needle and syringe to make a single cell suspension. Samples were then passed through a 70um mesh filter to remove debris, and the filtrate was centrifuged (2000×g for 5 min) to pellet cells. Cells were then resuspended in 1.6 ml of suspension media [1.375 ml EBSS, 150 μl albumin-ovomucoid inhibitor (10 mg ml−1 in EBSS), and 75 μl DNase (2000 units ml−1)]. This solution was layered on top of a 2.5 ml solution of albumin-ovomucoid inhibitor (10 mg ml−1 in EBSS) to create a continuous density gradient, and the samples were centrifuged at 1000 rpm for 5 min. The supernatant was discarded, and pelleted neurons were collected in warm Neurobasal™ Plus medium (Thermo Fisher Scientific) supplemented with 200 mM L-Glutamine with 1% (v/v) penicillin-streptomycin. For plating of primary neurons, dishes were pre-coated with 20 ug/mL poly-L-lysine (Sigma Cat# P2636–25MG) and 6ug/mL laminin (Gibco Cat# 23017–015) in ddH20 for 2h at 37C. Dishes were washed twice with ddH20 immediately before plating neurons. For GFP-GSDME imaging experiments, cells were plated in 24 well glass bottom dishes (cellVis: P24–1.5H-N) at a density of 3.5 × 10⁵ cells per well. For immunoblots, cells were plated at a density of 1 × 10⁶ cells per well in 6 well plates (cellVis: P6–1.5H-N). For cell death, TMRM assays and Tuj1 staining, neurons were plated in 96 well glass bottom dishes (Cellvis #P96–1.5H-N) at a concentration of 5 × 10⁴ cells/well.
SH-SY5Y culture:
Wild-type and GSDME −/− SH-SY5Y cell lines were a gift from Dr. Judy Lieberman (Boston Children’s Hospital). SH-SY5Y were cultured in DMEM medium supplemented with 10% heat-inactivated fetal bovine serum (FBS), 6 mM HEPES, 1.6 mM L-glutamine, 50 μM 2-mercaptoethonal, 100 U/ml Penicillin G and 100 μg/ml streptomycin sulphate. CRISPR-Cas9 knockout of GSDME in SH-SY5Y was performed as previously described.19 Briefly, GSDME gRNAs (5’-TAAGTTACAGCTTCTAAGTC-3’ and 5’ -TGACAAAAAAGAAGAGATTC-3’) were cloned into LentiCRISPR-v2 puro vector. The resulting plasmids were transfected into HEK293T with pSPAX2 and pCMV-VSV-G at a 1:1:2 ratio. Supernatants containing lentivirus were collected 2 days later and used to transduce SH-SY5Y at an MOI of 0.3. Two days after transduction, 3 μg/ml (8 μg/ml for CT26) puromycin or 200 μg/ml hygromycin was used to select for positive cells (5d incubation). Cells were then subcloned by limiting dilution in 96-well plates and screened for GSDME expression by immunoblot. LentiCRISPR-v2 empty vector was used to generate control cells.
Human iPSC-derived cortical neuron culture and plating:
NGN2 tetracycline-inducible iPSC neuron lines were a gift from the Tracey Young-Pearse lab and were generated using a lentiviral transduction protocol as previously described 62. Plates were coated with poly-ornithine and laminin (10 ug/mL poly-ornithine, 5 ug/mL laminin) 24 hours prior to cell plating. Plates were coated with Matrigel basement matrix 2 hours prior to cell plating (8.7 μg/cm2). Day 4 cells were thawed from stock and plated at 150,000 cells per well with iN media (Neuralbasal media, 1% Glutamax, 0.3% Dextrose, 0.5% MEM NEAA, 2% B27, 10 ng/mL of each BDNF, GDNF, and CNTF, 5 ug/mL puromycin, 2 ug/mL doxycycline, 10 uM Y-27632). Half media changes with the same iN media without Y-27632 were performed every 2–3 days prior to harvest.
Human iPSC-derived motor neuron culture and plating:
Human induced pluripotent stem cells (iPSCs) were generated as previously described63,64. The TDP43G298S line was obtained from a 47-year-old male that was diagnosed with familial ALS (fALS) at age 43, at which point a biopsy was taken64. The 1016A wild-type iPSCs63 were taken from a healthy 20 year old male (Supplementary table 3). The cells were cultured on Matrigel-coated (Cat. No. BD354277, VWR) tissue culture plates in StemFlex medium (Cat. No. A3349401, Life Technologies) supplemented with Pen-Strep (Cat. No. 15140163, Life Technologies), maintained at 37°C and 5% CO2. Cells were differentiated into motor neurons via chemical-driven, embryoid body (EB)-based protocol as previously described65. Briefly, iPSCs were dissociated and grown as suspension cultures in StemFlex medium. After 24 hours, cells were grown in N2B27 media consisting of DMEM/F12 (Cat. No. 12634028, Life Technologies) and Neurobasal media (Cat. No. 21103049, Life Technologies) (1:1), N2 supplement (1%) (Cat. No. 17502048, Life Technologies), B27 supplement (2%) (Cat. No. 17504044, Life Technologies), Glutamax (1%) (Cat. No. 35050079, Life Technologies), β-mercaptoethanol (0.1%) (Cat. No. 21985023, Life Technologies), ascorbic acid (20 μM) (Cat. No. A4403, Sigma Aldrich), and Pen-Strep (1%), with additional supplements based on day of differentiation. On days 0 and 1, cells were fed with N2B27 media supplemented with SB 431542 (10 μM) (Cat. No. 1614, R&D Systems), LDN 193189 (100 nM) (Cat. No. 04–0074-02, ReproCELL), and CHIR 99021 (3 μM) (Cat. No. 04–0004-10, ReproCELL). On day 2, cells were fed with N2B27 media supplemented with SB 431542 (10 μM), LDN 193189 (100 nM), CHIR 99021 (3 μM), retinoic acid (1 μM) (Cat. No. R2625, Sigma Aldrich), and smoothened agonist (SAG) (1 μM) (DNSK International). On day 4, media was replaced with day 2 media. On day 5, media was replaced with N2B27 media with retinoic acid (1 μM) and SAG (1 μM). On day 7, cells were fed with N2B27 media with RA (1 μM), SAG (1 μM), and BDNF (20 ng/mL) (Cat. No. 248-BD, R&D Systems). On day 9, media was replaced with N2B27 supplemented with RA (1 uM), SAG (1 uM), BDNF (20 mg/mL) and gamma secretase inhibitor (DAPT, 10 μM) (Cat. No. 2634, R&D Systems). On day 11, cells were fed with N2B27 with RA (1 μM), SAG (1 μM), DAPT (10 μM), BDNF (20 ng/mL), and GDNF (20 ng/mL) (Cat. No. 212-GD, R&D Systems). On day 13, media was replaced with day 11 media. On day 15, EBs formed were dissociated with 0.25% Trypsin-EDTA (Cat. No. 25200114, Life Technologies, counted, and centrifuged at 400 × g for 5 minutes. Pelleted cells were resuspended in complete MN media consisting of Neurobasal media, N2 supplement (1%), B27 supplement (2%), Pen-Strep (1%), Glutamax (1%), nonessential amino acids (1%) (Cat. No. 11–140-050, Gibco), βME (0.1%), ascorbic acid (20 μM), BDNF (20 ng/mL), GDNF (20 ng/mL), CNTF (20 ng/mL) (Cat. No. 130–096-336, Miltenyi), and UFDU (10 μM) (Cat. Nos. U3750/ F0503, Sigma Aldrich). Plated cells were cultured for an additional 7 days prior to experimentation, with half media changes every 3–4 days. The human pluripotent cell lines were reviewed by the Harvard Committee on the Use of Human Subjects and determined to not be human subjects research.
METHOD DETAILS
SOD1 G93A behavioral analysis
Weight Measurement:
Weights of all mice carrying the SOD1G93A transgene were measured biweekly from week 7 to week 21. Disease onset was defined as the day of peak weight while disease progression was defined as the number of days between disease onset to euthanasia.
Grip strength:
Grip strengths of the SOD1G93A transgenic mice were measured weekly, starting at week 7 and ending at week 21. A grip strength machine (BIOSEB# bio-GS3) with a mesh grid attachment was used to obtain combined grip strengths of all four limbs. For each measurement, the mouse was held at the base of the tail and placed on the mesh grid. A total of 5 pulls were performed per mouse with approximately 5–10 second breaks between each pull. The top three pulls per time point were averaged and used for data analysis. 12 or more mice per genotype, per sex, were used for weights and grip strength analysis.
Survival:
Each mouse was monitored daily after symptom onset. Mice that were unable to rear were given hydrogels and wetted food pellets at the bottom of the cage. Euthanasia time points for each mouse were determined by the inability to successfully right itself when flipped on either of its sides within 30s.
Brain and spinal cord tissue lysis
For analysis of mouse CNS tissue, animals were anesthetized with Avertin solution (500 mg kg−1, MilliporeSigma) and perfused with 20 ml of cold PBS before harvest. Brains and spinal cords were dissected in dish of cold PBS and stored at −80 C prior to tissue homogenization/lysis. Lysis buffer was prepared on ice as follows: 10 ml T-per buffer (Thermo #78510), 1 tablet protease inhibitor (Sigma #11836153001/Roche), 100ul HALT protease inhibitor (Thermo #87786), 100ul 0.5M EDTA (Thermo #87786), 1 tablet Phosstop™- phosphatase inhibitor tablets (Sigma #04906845001/ Roche). Tissue lysis was performed as previously described 66. Briefly, dissected and frozen tissue was resuspended in cold lysis buffer in a 2mL Eppendorf tube. One autoclaved metal bead (BB) was placed in each tube containing sample and lysed in a bead beater (Qiagen TissueLyser II) at a setting of 25 Hz for 5 minutes. Homogenized tissue samples were then incubated on a rotating tube rack at 4C for 30 min. Following incubation samples were clarified by spinning at 16000 × g for 15mins at 4C. Supernatants (lysate) were then taken and stored at −80 C prior to analysis. For immunoblot processing, sample lysates were diluted in Bolt 4X loading buffer (Thermo #B0007) containing 1X Bolt Sample Reducing Agent (Thermo #B0009) and beta-mercaptoethanol. Samples were then boiled for 10 min at 90 C, spun down and stored at −20 C.
Drugs and treatments
Raptinal (cat# SML1745), rotenone (cat# R8875), antimycin-A (cat# A8674) and 3-Nitropropionic acid (cat# N5636) were purchased from Sigma and resuspended in DMSO to make stock solutions. For raptinal treatments, cells were exposed to final concentrations ranging from 1–10uM for 1h, and then incubated with fresh media and assessed at later timepoints. For antimycin-A treatments, cells were exposed to final concentrations ranging from 5–20 uM for 30 min and then incubated with fresh media. For rotenone and 3-NP treatments, cells were exposed to working concentrations ranging from 10–30uM (Rotenone) and 1–3 mM (3-NP) for 2h and then incubated with fresh media. Z-VAD-FMK (R&D cat# FMK001) was resuspended in DMSO and used at a final concentration of 20 uM. For experiments using toxins and z-VAD, neurons were pretreated with 20uM z-VAD for 30 min, and then treated with a combination of zVAD (20uM) and toxins for the indicated timepoints.
Primary neuron transfection
Primary neurons were transfected at DIV 6–7 and analyzed at DIV9–10 (2–3 days following transfection). Transfections were performed using lipofectamine 2000 reagent (Thermo Scientific cat# 11668027) as previously described 67. Briefly DNA and lipofectamine mixes were made in plain neurobasal media (NBM, without PSG and B-27) with 0.25–1ug of DNA and 0.75–3uL of lipofectamine reagent (1:3 DNA/lipofectamine ratio). The DNA and lipofectamine mixes were gently vortexed (30s) and incubated at RT for 15 min. Prior to addition of the transfection mix, conditioned media was removed from neuronal plates and saved. Neurons were then washed 3 times with warmed plain NBM, and DNA/lipofectamine mix (100uL/well for a 24 well plate) was added to each well and incubated for 1h at 37C. Following incubation, each transfected well was washed 3 times with fresh plain NBM and the conditioned media was added back to each well. Neurons were then incubated for 2–3 days at 37C prior to imaging and analysis.
Lentivirus transductions of primary neurons
Neurons were transduced overnight with lentiviruses encoding control (eGFP) or PR-50 and TDP-43 proteins as described previously.33 Briefly, primary neurons plated in 96-well plates at a density of 50–75,000 cells/well were grown for 72 hours. The neurons were then treated with tittered viruses at MOIs of 2 or 3. Transduction volume was 40uL/well. Following overnight incubation with virus, neurons were washed 3x with warmed complete NBM and followed for TMRM staining, immunoblot analysis or Tuj1+ staining as described below.
Live cell imaging of neurons
For live-cell imaging of cortical neurons, neuronal cultures grown on glass bottom dishes at a density of 175,000 cells/cm2 were imaged on a DMI8 Zeiss microscope. The microscope was equipped with an environmental chamber that was supplied with humidified 5% CO2 and maintained at 37C. Images were acquired with an Andor Zyla sCMOS camera via a 20× Plan Apo objective. To monitor GSDME enrichment on mitochondria, images from neurons co-transfected GFP-GSDME and mKate2-OMP25 (referred to as mito-RFP) were captured every 15 minutes following treatment with toxins (raptinal and rotenone). To monitor mitochondrial motility, each well of neurons (350,000 cells/well) were sparsely transfected with mKate2- OMP25 (referred to as mito-RFP) and cytosolic GFP. Two days following transfection, the neurons were treated and imaged. Images of whole neurons (all visible neurites) were captured every 6s. Kymographs were generated from 3- to 5-min time-lapse movies and analyzed with a custom-written ImageJ macro for percent motility mitochondrial density, and length. High resolution 3–5 min timelapse movies were taken at 30 min, 1h and 2h post-raptinal treatment.
Immunoblotting
Cells were lysed on ice in 1x RIPA buffer (EMD Milipore cat# 20–188) supplemented with 0.5mM EDTA, 1X Halt Protease inhibitor cocktail (Thermo Scientific cat# 87786) and 1 Complete Mini protease inhibitor tablet (Sigma cat# 11836153001). Following a 15 min incubation in lysis buffer, cells were centrifuged at 18,000 × g for 15 min at 4C. Pellets were discarded and supernatants were diluted with 4X Laemmli buffer (to 1X final concentration) supplemented with 10X Bolt sample reducing agent (cat# B0009). Samples were then incubated on 90C heat block for 10 minutes and run on Bolt 4–12% Bis-Tris-Plus gels (Thermo Scientific cat# NW04125BOX). Gels were transferred to nitrocellulose iBlot 2 membranes (Fisher Scientific cat# IB23001), blocked with 5% Pierce Clear Milk Blocking Buffer (Thermo Scientific cat# 37587) for 30 minutes, washed 3x with TBST (TBS, 0.05% Tween-20), and incubated overnight in blocking buffer containing primary antibody at 4C. Following antibody incubation, blots were washed 3x with TBST for 10 min, incubated with secondary antibody for 1h at RT, followed by three additional 10 min washes with TBST. GSDME and caspase-3 immunoblots were developed with Supersignal West Pico Chemiluminescent Substrate (Thermo Scientific cat# 34080) on a ChemiDoc MP or Azure 300 chemiluminescent imaging system. GAPDH immunoblots were incubated with IR-fluorophore conjugated secondary antibodies (LI-COR Biosciences cat# 926–32213) and developed and imaged on a Li-COR imaging system.
Cell death assessment (LDH and PI assays)
Neurons were plated at 7.5 ×10⁴ cells/well of a tissue culture-treated black 96 well plate coated with laminin and poly-L-lysine with optically clear flat wells 7d prior to experimentation. Propidium iodide or SYTOX green were diluted in complete NBM to a final concentration of 1.5uM or 1uM respectively and added to neurons during treatment with toxin incubation as described above. Positive control wells were lysed by the addition of 5 ul of 10x lysis buffer (10% v/v Triton X-100) 45 min prior to the desired endpoint for analysis. Propidium iodide uptake was analyzed using the IncuCyte S3 Live cell analysis imaging system and associated software (Sartorius V2018B). To generate time course curves, images were acquired with the IncuCyte ZOOM Plan fluor 20X/0.45 objective (Sartorius cat#4465) every 30 min following PI staining and toxin treatment. PI positive neurons were scored as cells with a threshold signal greater than 2 red calibrated units (RCU) above background, using a Top-hat background subtraction method. Percent maximal uptake was calculated by normalizing experimental wells by the average PI uptake of the triton (positive control) treated wells. For LDH release assays, 50 uL of supernatants from the PI uptake experiments described above were transferred to a clear flat-bottom 96-well plate and assessed using the CytoTox LDH release assay from Promega (cat# G1780) in accordance with the manufacturer’s protocol. Absorbance values (490nm) were obtained on a Bio-Tek Synergy HTX plate reader and analyzed using Gen5 software.
TMRM assays
Image-iT TMRM (Thermo Scientific cat# I34361) reagent was used at a concentration of 100 nM (1:1000 dilution in NBM). Primary neurons were incubated with TMRM solution for 1h at 37C, and then washed with fresh NBM. Cells were treated with toxins or lentiviruses as described above and imaged every 30 min using the IncuCyte S3 Live Cell Imaging system. Image acquisition and data analysis were performed using the IncuCyte S3 Software (Sartorius V2018B) TMRM positive neurons were scored as cells with a threshold signal greater than 2.5 red calibrated units (RCU) above background, using a Top-hat background subtraction method. Total TMRM intensity was calculated for each well and normalized to DMSO control or vehicle conditions.
Beta-III-Tubulin (Tuj1) immunocytochemistry
Primary cortical neurons grown on laminin and poly-L-lysine-coated 96-well glass bottom plates were treated with mitochondrial toxins or TDP-43/PR-50 encoding lentiviruses and stained using standard immunocytochemistry. Briefly, cells were fixed with 4% paraformaldehyde and 15% sucrose in PBS for 1h at RT, rinsed 3 times with PBS, and permeabilized using 0.3% Triton-X-100 in PBS for 1h at RT. Following permeabilization, cells were blocked with 1% BSA in PBS for 1h at RT. Fluorescently conjugated 647-Tuj1 antibody (biolegend cat# 801210) was diluted 1:300 in 1% BSA + 0.3% Triton-X-100 in PBS. Cells were then incubated overnight in Tuj1antibody solution at 4C, and then rinsed 3x with PBS. Cells were then mounted with Prolong Diamond antifade mounting media (Cell Signaling cat# 8961S) and imaged using a Leica Thunder microscope with Andor Zyla sCMOS camera via a 20× Plan Apo objective.
RNA isolation and qPCR
For analysis of mouse brain tissue, animals were anesthetized with Avertin solution (500 mg/kg, Millipore Sigma) and perfused with 20 mL of cold PBS. Mouse brains were dissected on ice in cold PBS. RNA was then isolated using the RNeasy mini kit (Qiagen). Per the supplier, RNA was isolated by a modified guanidium thiocyanate method and integrity and purity was confirmed using an Agilent 2100 Bioanalyzer. Reverse transcription was performed using the iScript cDNA Synthesis Kit (Bio-Rad). Quantitative real-time PCR (RT-qPCR) was performed using the Power SYBR Green PCR Master Mix (ThermoFisher Scientific) on a StepOnePlus RT PCR system (Applied Biosystems) or a LightCycler 96 (Roche). Expression relative to Gapdh was calculated using the comparative CT method.
Microfluidic chamber assays
For fluidic isolation of local axon segments, neuronal cultures were established in microfluidic devices (RD450 or XC450 from Xona Microfluidics). The silicone microfluidic devices (RD450) were attached onto a glass coverslip (pre-coated with poly-L-Lysine and Laminin) before use.
The microfluidic devices were loaded with freshly dissociated neurons at a density of 500,000 cells per device. Following the initial loading of the neurons into one chamber of each device, they were incubated at 37C for 30 mins to allow the cells to adhere. Afterwards, both chambers of the microfluidic devices were filled with fresh media. The neurons were grown for 9 days in the microfluidic chambers prior to imaging, to allow for sufficient number of axons to grow through the 450μm chamber. During this establishment phase of the neuronal cultures, the growth media in the chamber housing the cell bodies was exchanged with 50% fresh media every 3 days. Neurons grown in microfluidic devices were transfected with lipofectamine 2000 in the same way as described for other cultures. The transfection was carried out in the chamber containing the cell bodies. Transfected neurons were imaged two days following transfection.
Mouse brain and spinal cord immunohistochemistry
Adult mice were perfused with 20mL of cold PBS and 20mL of 4% PFA. Brains or spinal cords were dissected, fixed overnight in 4% PFA at 4C, paraffin embedded and processed for IHC as described68. Briefly paraffin embedded sections were dehydrated in successive washes with xylene and ethanol. Sections were then washed in water and boiled in 1X EDTA unmasking solution (Cell Signaling cat#14746). Tissue sections were then incubated in a 3% H202 solution for 10 min, washed in TBST-Tween20 and blocked for 1h at room temperature with TBST/5% Normal Goat Serum (Cell Signaling Cat#5425). Following blocking, tissue sections were incubated in diluted primary antibody solutions (see below) overnight at 4C. The next day, sections were washed with 1X TBST and incubated for 30min at room temperature in SignalStain® Boost IHC detection Reagent (HRP rabbit, #8114 or HRP mouse, #8125) specific to the species of the primary antibody. Slides were washed with TBST prior to Tyramide Signal Amplification (TSA). Fluorescein conjugated TSA reagent (Akoya Biosciences, NEL745001KT) or Cy3 reagent (Akoya Biosciences, NEL744001KT) were diluted as per manufacturer’s instructions. Slides were incubated with TSA reagent for 10min at room temperature (protected from light). Slides were then washed three times with 1X TBST, counterstained with DAPI and mounted in prolong gold antifade mounting medium (Cell Signaling cat# 8961S) and imaged using a Leica Thunder microscope with Andor Zyla sCMOS camera via a 20× Plan Apo objective. For serial staining of sections (dual IHC) a stripping step was performed by boiling slides for 10 min in a 10mM sodium citrate buffer (Cell Signaling cat# 14746). Following stripping, slides were the incubated in primary antibody solution, washed, incubated with SignalStain Boost IHC secondary detection reagent and subject to TSA amplification as described above.
Human brain immunohistochemistry
Postmortem temporal cortical tissues from FTD/ALS patients with C9orf72 repeat expansions and TDP-43 pathology, patients with Lewy Body Dementia (LBD), and healthy controls were obtained from the UPenn Center for Neurodegenerative Disease Research Biobank. Information on human patients is provided in table S1. Written informed consent was obtained from legal next of kin. Human tissues were processed and stained as previously described69. Briefly, slides were deparaffinized in xylene, and dehydrated in successive EtOH washes. After a brief wash in dH20, slides were then incubated for 30 min in a 70% MeOH and 30% H2O2 solution, and then washed in tap water. Microwave antigen retrieval was performed for 20 min in a citrate buffer (Vector Labs #H-3300). Slides were then cooled to room temperature, rinsed in TBS (0.1 M Tris Buffer) and subject to blocking solution (TBS/2%FBS/3%BSA) for 5 min at room temperature. Following blocking, anti-Human GSDME antibody (abcam 230482, rabbit-anti-human) was diluted 1:100 in blocking solution. Sections were incubated in GSDME primary antibody overnight at 4C in a humidified chamber. The next day, slides were washed with TBS, blocked for an additional 5 minutes and exposed to vector biotinylated anti-Rb IgG secondary antibody (Vector #BA-1000) at a dilution of 1:1000 for 1h at room temperature. Slides were then washed in TBS and Vector ABC solution (Vector # PK-4001) was applied to each slide for 1h at RT. Slides were then exposed to Vector IMPAACT DAB solution at room temperature. Following development, samples were washed in dH20, counterstained using hematoxylin (Cell signaling #14166), rinsed in tap water, dehydrated in successive EtOH and xylene rinses and mounted for imaging.
Transmission Electron microcopy
Primary mouse neurons were cultured for 7d (as described above). WT and GSDME KO cells were then treated with 5uM raptinal for 1h, prior to processing for electron microscopy. Cells were fixed for at least 2 hours at RT in a 2.5% Glutaraldehyde 1.25% Paraformaldehyde and 0.03% picric acid in 0.1 M sodium cacodylate buffer (pH 7.4) solution. Following fixation, neurons were washed in 0.1M cacodylate buffer and postfixed with 1% Osmium tetroxide (OsO4)/1.5% Potassium ferrocyanide (KFeCN6) for 1 hour, washed twice with water, once with Maleate buffer (MB), and then incubated in 1% uranyl acetate in MB for 1h followed by 2 water washes and subsequent alcohol dehydration in the following gradations: 10min each; 50%, 70%, 90%, 2×10min 100%. After dehydration propyleneoxide was added to the dish and the cells were lifted off using a transfer pipet, pelleted and infiltrated ON in a 1:1 mixture of propyleneoxide and TAAB Epon (TAAB Laboratories Equipment Ltd, https://taab.co.uk). The following day the samples were embedded in TAAB Epon and polymerized at 60 degrees C for 48 hrs. Ultrathin sections (about 60nm) were cut on a Reichert Ultracut-S microtome, picked up on to copper grids stained with lead citrate and examined in a JEOL 1200EX Transmission electron microscope or a TecnaiG2 Spirit BioTWIN and images were recorded with an AMT 2k CCD camera. For analysis, the average mitochondrial length and number of mitochondria per cell was measured using ImageJ. These parameters were compared/normalized to values from WT and KO neurons treated with DMSO.
Data mining of sc-RNA-seq databases
Single cell transcriptomic data from mouse cortical and hippocampal neurons was obtained from the Allen Brain atlas: https://celltypes.brain-map.org/rnaseq/mouse_ctx-hpf_10x?selectedVisualization=Heatmap&colorByFeature=Cell±Type&colorByFeatureValue=Gad1. Human neuronal single cell data from cortex and hippocampus was obtained and mined from the Allen Brain atlas: https://portal.brain-map.org/atlases-and-data/rnaseq/human-m1-10x. RNA-seq data of FACS-isolated microglia was obtained from the Tabula Muris database co-hosted by the Chan-Zuckerberg Biohub and Broad Institute: https://tabula-muris.ds.czbiohub.org/
Stressing of human non-disease and ALS patient-specific induced pluripotent stem cell derived motor neurons.
For GSMDE knockdown experiments, MNs were plated at 100,000 live cells/well in a 96-well plates pre-coated with poly-L-ornithine (Cat. No. P3655, Sigma Aldrich), poly-D-lysine (Cat. No. A3890401, Life Technologies), fibronectin (Cat. No. 47743–654, VWR), and laminin (Cat. No. 23017015, Life Technologies). Cells were infected with an MOI of 6 and cultured for 7 days, with half media changes every 3–4 days. After 7 days, transduced cells were exposed to thapsigargin (0.5 μM) (Cat. No. T9033, Sigma Aldrich), tunicamycin (5 μM) (Cat. No. T7765, Sigma Aldrich), or MG132 (1 μM) (Cat. No. M8699, Sigma Aldrich) for 48 hours and subsequently fixed with 4% PFA. MNs were subsequently stained with anti-Tuj1 (Thermo #MA1–118X, 1:900) and anti-Islet 1/2 (Abcam ab109517, 1:2000).
GFP-GSDME image analysis:
Colocalization analysis of GSDME and mitochondria along neurites:
For analyzing the enrichment of GSDME on mitochondria along neurites, the neurites were tracked manually. The mitochondrial intensity and the GSDME intensity were then measured along the neurites. The mitochondrial intensity was then converted to 1-D masks (by thresholding according to local contrast) while the GSDME intensity was normalized to the average intensity along the neurite. The enrichment of GSDME was then calculated as the ratio of mean GSDME signal within the mitochondrial mask to the mean GSDME signal outside the mitochondrial masks.
Colocalization analysis of GSDME and mitochondria in cell bodies and SHSY5Y cells:
To analyze the enrichment of GSDME on mitochondria in cell bodies and SHSY5Y cells, the cell outline was drawn manually. The mitochondrial intensity within the cell outline was then used to create masks (by thresholding according to local contrast) and the GSDME intensity was normalized to the average intensity of the whole cell. As done in the case of neurites, enrichment of GSDME on mitochondria was reported as the ratio of mean GSDME signal within the mitochondrial mask to the mean GSDME signal outside the mitochondrial masks
Quantification of GSDME puncta:
To quantify the density of puncta along neurites, the neurites were manually traced. The intensity of GSDME was then measured along the neurites and normalized to the average intensity along the whole neurite. To detect GSDME puncta, the GSDME signal was then converted to a mask using a local thresholding window of 20px. The density of GSDME puncta in the cell bodies and SHSY5Y cells was quantified using a similar approach. In this case, the cells were traced manually, following which the GSDME puncta were detected by local thresholding.
Analysis of Beta-III-Tubulin (Tuj1) immunocytochemistry:
The microtubule (MT) depolymerization index was measured using a custom macro adapted from 33. Briefly, the polymerized microtubules were distinguished from depolymerized ones using brightness and circularity. Polymerized microtubules are less bright and less circular than the aggregated puncta formed by depolymerized microtubules. In this macro, a low threshold is set at first, to detect and mask all TUJ1 positive objects (including polymerized and depolymerized MTs). In the second step, a high threshold is set, which can distinguish only the bright spots formed by depolymerized MTs. Once detected and masked, the pixels marking depolymerized MTs are removed from the set of pixels (mask) marking all microtubules, as detected in the first step, to get the mask of pixels containing polymerized microtubules only. In the final step, the masks of polymerized and depolymerized microtubules are then refined using a circularity threshold. Any tubular objects detected in the mask of depolymerized microtubules or any solid round objects detected in the mask of polymerized microtubules are removed. The MT depolymerization index is then measured as the following ratio:
Quantification of mitochondrial motility in neurites:
To quantify mitochondrial movement in neurites, images of fluorescently marked mitochondria were captured every 6s. Kymographs were generated from 3 to 5-min time-lapse movies and analyzed with Kymolyzer 67, a custom-written ImageJ macro. Each data point in the percent motility quantifications represent the average percent time spent in motion by all mitochondria in a neurite segment.
QUANTIFICATION AND STATISTICAL ANALYSIS
For cell culture experiments, statistical analysis was performed with a two-tailed unpaired method (Student’s t-test) for two independent groups, two-tailed pairwise t-tests to assess the effect of toxin or agent on the same sample before and after treatment, and one-way ANOVA for multiple groups with a single variance, all calculated with GraphPad Prism 8. For experiments treating WT and GSDME KO cells with several different toxins or agents, two-way ANOVA (row factor = treatment, column factor = genotype) followed by multiple comparisons was done to compare each group (adj p-values were calculated by the Tukey method). Data shown throughout represents an average of at least 2–3 independent experiments ± SEM. Each independent experiment had at least > 3 technical replicates (e.g. wells in culture plate) per condition. Significant statistical figure outcomes must obey a p-value upper bound less than 0.05 and corrected using the Tukey method. Precise statistical details (number of biological replicates, exact comparisons and tests) are detailed in the relevant figure legends. For datasets from the SOD1 mouse model in Figure 7, Kaplan-Meier curves were constructed, and survival analysis was performed. Groups were compared for statistical differences using the log-rank test (Mantel-Cox). For datasets 7G and 7J, student’s t-tests were performed for comparisons between genotypes, and p-values were adjusted using the Tukey method. For dataset 7H, a two-way ANOVA (row factor = time, column factor = genotype) was performed, followed by multiple comparisons for each group (p-values adjusted by the Tukey method are shown).
Supplementary Material
Supplementary video 1: Live cell imaging of GFP-GSDME transfected SH-SY5Y cells treated with 5uM of raptinal and either DMSO (top) or 20uM of zVAD-fMK (bottom). Cells were imaged every 10 minutes and GFP (GSDME) and RFP (PI) channels were collected (Related to Fig 3).
Supplementary videos 2–3: Representative reconstructions of mitochondria from mouse neurons transfected with GFP-GSDME and either (video 2) OMP25-mCherry or (video 3) Cox8-mCherry. These cells were treated with 10uM raptinal were fixed and imaged using structured illumination microscopy (SIM) to assess marker colocalization (Related to Fig 3).
Supplementary video 4: Recordings of female (top row) and male (bottom row) of SOD1G93A transgenic mice that are either GSDME KO (left panels) or GSDME WT (right panels). All recordings were taken from mice at P150 (Related to Fig 8).
Highlights.
GSDME is expressed by neurons and activated by mitochondrial toxins
Neuronal GSDME drives local mitochondrial damage and axon loss prior to cell death
ALS/FTD proteins activate GSDME and drive neurite loss in mouse and human neurons.
SOD1G93A GSDME KO mice have rescued disease progression and motor neuron loss
Acknowledgements
We thank Aaron Gitler for plasmids; Laura Volpicelli-Daley, Ulf Dettmer, Thomas Schwarz, Beth Stevens, Francisco Quintana for feedback and advice; and Alex Yueting-Lu, Victoria Tong, Zane Russom and Samantha Choi for technical support. This work was supported by R01DK127257 (to IC), CZI Neurodegeneration Challenge Network (to IC and ACP); R01CA240955 (to JL); Cancer Research Institute fellowship (RM); R01AG055909 (TYP); R01NS115139 (ACP); U19 AG062418, P50 NS053488 (UPenn Brain Bank, EL), F31NS122292 (to DVN). ACP is supported by the Parker Family Chair/AHA/Allen Brain Health Initiative.
Footnotes
Declaration of interests
I.M.C. receives sponsored research support from Allergan Pharmaceuticals and is on the SAB for GSK and LIMM therapeutics. JL is a cofounder and SAB member of Ventus Therapeutics.
Publisher's Disclaimer: This is a PDF file of an unedited manuscript that has been accepted for publication. As a service to our customers we are providing this early version of the manuscript. The manuscript will undergo copyediting, typesetting, and review of the resulting proof before it is published in its final form. Please note that during the production process errors may be discovered which could affect the content, and all legal disclaimers that apply to the journal pertain.
References
- 1.Murali Mahadevan H, Hashemiaghdam A, Ashrafi G, and Harbauer AB (2021). Mitochondria in Neuronal Health: From Energy Metabolism to Parkinson’s Disease. Adv Biol 2100663, 2100663. 10.1002/adbi.202100663. [DOI] [PubMed] [Google Scholar]
- 2.Venderova K, and Park DS (2012). Programmed cell death in Parkinson’s disease. Cold Spring Harb Perspect Med 2, 1–23. 10.1101/cshperspect.a009365. [DOI] [PMC free article] [PubMed] [Google Scholar]
- 3.Baranov S. v., Baranova O. v., Yablonska S, Suofu Y, Vazquez AL, Kozai TDY, Tracy Cui X, Ferrando LM, Larkin TM, Tyurina YY, et al. (2019). Mitochondria modulate programmed neuritic retraction. Proc Natl Acad Sci U S A 116, 650–659. 10.1073/pnas.1811021116. [DOI] [PMC free article] [PubMed] [Google Scholar]
- 4.Fuentes L, Lebenkoff S, White K, Gerdts C, Hopkins K, Potter JE, Grossman D, Project PE, and Sciences R (2016). Releasing Syntaphilin Removes Stressed Mitochondria from Axons Independent of Mitophagy under Pathophysiological Conditions. Neuron 93, 292–297. 10.1016/j.neuron.2017.04.004.Releasing. [DOI] [PMC free article] [PubMed] [Google Scholar]
- 5.Bock FJ, and Tait SWG (2020). Mitochondria as multifaceted regulators of cell death. Nat Rev Mol Cell Biol 21, 85–100. 10.1038/s41580-019-0173-8. [DOI] [PubMed] [Google Scholar]
- 6.Rogers C, Fernandes-Alnemri T, Mayes L, Alnemri D, Cingolani G, and Alnemri ES (2017). Cleavage of DFNA5 by caspase-3 during apoptosis mediates progression to secondary necrotic/pyroptotic cell death. Nat Commun 8, 1–14. 10.1038/ncomms14128. [DOI] [PMC free article] [PubMed] [Google Scholar]
- 7.Wang Y, Gao W, Shi X, Ding J, Liu W, He H, Wang K, and Shao F (2017). Chemotherapy drugs induce pyroptosis through caspase-3 cleavage of a gasdermin. Nature 547, 99–103. 10.1038/nature22393. [DOI] [PubMed] [Google Scholar]
- 8.Shi J, Zhao Y, Wang K, Shi X, Wang Y, Huang H, Zhuang Y, Cai T, Wang F, and Shao F (2015). Cleavage of GSDMD by inflammatory caspases determines pyroptotic cell death. Nature. 10.1038/nature15514. [DOI] [PubMed] [Google Scholar]
- 9.Liu X, Zhang Z, Ruan J, Pan Y, Magupalli VG, Wu H, and Lieberman J (2016). Inflammasome-activated gasdermin D causes pyroptosis by forming membrane pores. Nature 535, 153–158. 10.1038/nature18629. [DOI] [PMC free article] [PubMed] [Google Scholar]
- 10.Kayagaki N, Stowe IB, Lee BL, O’Rourke K, Anderson K, Warming S, Cuellar T, Haley B, Roose-Girma M, Phung QT, et al. (2015). Caspase-11 cleaves gasdermin D for non-canonical inflammasome signalling. Nature. 10.1038/nature15541. [DOI] [PubMed] [Google Scholar]
- 11.de Vasconcelos NM, van Opdenbosch N, van Gorp H, Parthoens E, and Lamkanfi M (2019). Single-cell analysis of pyroptosis dynamics reveals conserved GSDMD-mediated subcellular events that precede plasma membrane rupture. Cell Death Differ 26, 146–161. 10.1038/s41418-018-0106-7. [DOI] [PMC free article] [PubMed] [Google Scholar]
- 12.de Torre-Minguela C, Gómez AI, Couillin I, and Pelegrín P (2021). Gasdermins mediate cellular release of mitochondrial DNA during pyroptosis and apoptosis. FASEB Journal 35. 10.1096/fj.202100085R. [DOI] [PubMed] [Google Scholar]
- 13.Weindel CG, Martinez EL, Zhao X, Mabry CJ, Bell SL, Vail KJ, Coleman AK, VanPortfliet JJ, Zhao B, Wagner AR, et al. (2022). Mitochondrial ROS promotes susceptibility to infection via gasdermin D-mediated necroptosis. Cell 185, 3214–3231.e23. 10.1016/j.cell.2022.06.038. [DOI] [PMC free article] [PubMed] [Google Scholar]
- 14.Orzalli MH, Prochera A, Payne L, Smith A, Garlick JA, and Kagan JC (2021). Virus-mediated inactivation of anti-apoptotic Bcl-2 family members promotes Gasdermin-E-dependent pyroptosis in barrier epithelial cells. Immunity, 1–16. 10.1016/j.immuni.2021.04.012. [DOI] [PMC free article] [PubMed] [Google Scholar]
- 15.Tan G, Huang C, Chen J, Chen B, and Zhi F (2021). Gasdermin-E-mediated pyroptosis participates in the pathogenesis of Crohn’s disease by promoting intestinal inflammation. Cell Rep 35, 109265. 10.1016/j.celrep.2021.109265. [DOI] [PubMed] [Google Scholar]
- 16.Xia W, Li Y, Wu M, Jin Q, Wang Q, Li S, Huang S, Zhang A, Zhang Y, and Jia Z (2021). Gasdermin E deficiency attenuates acute kidney injury by inhibiting pyroptosis and inflammation. Cell Death Dis 12. 10.1038/s41419-021-03431-2. [DOI] [PMC free article] [PubMed] [Google Scholar]
- 17.Cai B, Liao C, He D, Chen J, Han J, Lu J, Qin K, Liang W, Wu X, Liu Z, et al. (2021). Gasdermin E mediates photoreceptor damage by all-trans-retinal in the mouse retina. Journal of Biological Chemistry, 101553. 10.1016/j.jbc.2021.101553. [DOI] [PMC free article] [PubMed] [Google Scholar]
- 18.Yu J, Li S, Qi J, Chen Z, Wu Y, Guo J, Wang K, Sun X, and Zheng J (2019). Cleavage of GSDME by caspase-3 determines lobaplatin-induced pyroptosis in colon cancer cells. Cell Death Dis 10. 10.1038/s41419-019-1441-4. [DOI] [PMC free article] [PubMed] [Google Scholar]
- 19.Zhang Z, Zhang Y, Xia S, Kong Q, Li S, Liu X, Junqueira C, Meza-Sosa KF, Mok TMY, Ansara J, et al. (2020). Gasdermin E suppresses tumour growth by activating anti-tumour immunity. Nature 579, 415–420. 10.1038/s41586-020-2071-9. [DOI] [PMC free article] [PubMed] [Google Scholar]
- 20.Moloney EB, de Winter F, and Verhaagen J (2014). ALS as a distal axonopathy: Molecular mechanisms affecting neuromuscular junction stability in the presymptomatic stages of the disease. Front Neurosci. 10.3389/fnins.2014.00252. [DOI] [PMC free article] [PubMed] [Google Scholar]
- 21.Yu H, Chen L, Zhang S, He J, and Fan D (2021). Early Axonal Dysfunction of the Peripheral Nervous System Influences Disease Progression of ALS: Evidence From Clinical Neuroelectrophysiology. Front Neurol 12. 10.3389/fneur.2021.574919. [DOI] [PMC free article] [PubMed] [Google Scholar]
- 22.Schwarz TL (2013). Mitochondrial trafficking in neurons. Cold Spring Harb Perspect Biol 5. 10.1101/cshperspect.a011304. [DOI] [PMC free article] [PubMed] [Google Scholar]
- 23.Kong J, and Xu Z (1998). Massive Mitochondrial Degeneration in Motor Neurons Triggers the Onset of Amyotrophic Lateral Sclerosis in Mice Expressing a Mutant SOD1. The Journal of Neuroscience 18, 3241–3250. 10.1523/JNEUROSCI.18-09-03241.1998. [DOI] [PMC free article] [PubMed] [Google Scholar]
- 24.Liu J, Lillo C, Jonsson PA, Velde C vande, Ward CM, Miller TM, Subramaniam JR, Rothstein JD, Marklund S, Andersen PM, et al. (2004). Toxicity of Familial ALS-Linked SOD1 Mutants from Selective Recruitment to Spinal Mitochondria. Neuron 43, 5–17. 10.1016/j.neuron.2004.06.016. [DOI] [PubMed] [Google Scholar]
- 25.Bakken TE, Jorstad NL, Hu Q, Lake BB, Tian W, Kalmbach BE, Crow M, Hodge RD, Krienen FM, Sorensen SA, et al. (2021). Comparative cellular analysis of motor cortex in human, marmoset and mouse. Nature 598, 111–119. 10.1038/s41586-021-03465-8. [DOI] [PMC free article] [PubMed] [Google Scholar]
- 26.Yao Z, van Velthoven CTJ, Nguyen TN, Goldy J, Sedeno-Cortes AE, Baftizadeh F, Bertagnolli D, Casper T, Chiang M, Crichton K, et al. (2021). A taxonomy of transcriptomic cell types across the isocortex and hippocampal formation. Cell 184, 3222–3241.e26. 10.1016/J.CELL.2021.04.021. [DOI] [PMC free article] [PubMed] [Google Scholar]
- 27.Schaum N, Karkanias J, Neff NF, May AP, Quake SR, Wyss-Coray T, Darmanis S, Batson J, Botvinnik O, Chen MB, et al. (2018). Single-cell transcriptomics of 20 mouse organs creates a Tabula Muris. Nature 562, 367–372. 10.1038/s41586-018-0590-4. [DOI] [PMC free article] [PubMed] [Google Scholar]
- 28.Chu CT, Bayır H, and Kagan VE (2014). LC3 binds externalized cardiolipin on injured mitochondria to signal mitophagy in neurons: implications for Parkinson disease. Autophagy 10, 376–378. 10.4161/auto.27191. [DOI] [PMC free article] [PubMed] [Google Scholar]
- 29.Chu CT, Ji J, Dagda RK, Jiang JF, Tyurina YY, Kapralov AA, Tyurin VA, Yanamala N, Shrivastava IH, Mohammadyani D, et al. (2013). Cardiolipin externalization to the outer mitochondrial membrane acts as an elimination signal for mitophagy in neuronal cells. Nat Cell Biol 15, 1197–1205. 10.1038/ncb2837. [DOI] [PMC free article] [PubMed] [Google Scholar]
- 30.Lagomarsino VN, Pearse R. v., Liu L, Hsieh Y-C, Fernandez MA, Vinton EA, Paull D, Felsky D, Tasaki S, Gaiteri C, et al. (2021). Stem cell-derived neurons reflect features of protein networks, neuropathology, and cognitive outcome of their aged human donors. Neuron 109, 3402–3420.e9. 10.1016/j.neuron.2021.08.003. [DOI] [PMC free article] [PubMed] [Google Scholar]
- 31.Zhang Y, Pak C, Han Y, Ahlenius H, Zhang Z, Chanda S, Marro S, Patzke C, Acuna C, Covy J, et al. (2013). Rapid Single-Step Induction of Functional Neurons from Human Pluripotent Stem Cells. Neuron 78, 785–798. 10.1016/j.neuron.2013.05.029. [DOI] [PMC free article] [PubMed] [Google Scholar]
- 32.Lemasters JJ, Qian T, Bradham CA, Brenner DA, Cascio WE, Trost LC, Nishimura Y, Nieminen A-L, and Herman B (1999). Mitochondrial Dysfunction in the Pathogenesis of Necrotic and Apoptotic Cell Death. [DOI] [PubMed] [Google Scholar]
- 33.Maor-Nof M, Shipony Z, Lopez-Gonzalez R, Nakayama L, Zhang YJ, Couthouis J, Blum JA, Castruita PA, Linares GR, Ruan K, et al. (2021). p53 is a central regulator driving neurodegeneration caused by C9orf72 poly(PR). Cell 184, 689–708.e20. 10.1016/j.cell.2020.12.025. [DOI] [PMC free article] [PubMed] [Google Scholar]
- 34.Ertürk A, Wang Y, and Sheng M (2014). Local pruning of dendrites and spines by caspase-3-dependent and proteasome-limited mechanisms. Journal of Neuroscience 34, 1672–1688. 10.1523/JNEUROSCI.3121-13.2014. [DOI] [PMC free article] [PubMed] [Google Scholar]
- 35.Medana IM, and Esiri MM (2003). Axonal damage: A key predictor of outcome in human CNS diseases. Brain 126, 515–530. 10.1093/brain/awg061. [DOI] [PubMed] [Google Scholar]
- 36.Conforti L, Gilley J, and Coleman MP (2014). Wallerian degeneration: an emerging axon death pathway linking injury and disease. Nat Rev Neurosci 15, 394–409. 10.1038/nrn3680. [DOI] [PubMed] [Google Scholar]
- 37.Wang W, Wang L, Lu J, Siedlak SL, Fujioka H, Liang J, Jiang S, Ma X, Jiang Z, da Rocha EL, et al. (2016). The inhibition of TDP-43 mitochondrial localization blocks its neuronal toxicity. Nat Med 22, 869–878. 10.1038/nm.4130. [DOI] [PMC free article] [PubMed] [Google Scholar]
- 38.Yu CH, Davidson S, Harapas CR, Hilton JB, Mlodzianoski MJ, Laohamonthonkul P, Louis C, Low RRJ, Moecking J, de Nardo D, et al. (2020). TDP-43 Triggers Mitochondrial DNA Release via mPTP to Activate cGAS/STING in ALS. Cell 183, 636–649.e18. 10.1016/j.cell.2020.09.020. [DOI] [PMC free article] [PubMed] [Google Scholar]
- 39.Wang P, Deng J, Dong J, Liu J, Bigio EH, Mesulam M, Wang T, Sun L, Wang L, Lee AYL, et al. (2019). TDP-43 induces mitochondrial damage and activates the mitochondrial unfolded protein response 10.1371/journal.pgen.1007947. [DOI] [PMC free article] [PubMed] [Google Scholar]
- 40.Hayes LR, Duan L, Bowen K, Kalab P, and Rothstein JD (2020). C9orf72 arginine-rich dipeptide repeat proteins disrupt karyopherin-mediated nuclear import. Elife 9. 10.7554/eLife.51685. [DOI] [PMC free article] [PubMed] [Google Scholar]
- 41.Freibaum BD, and Taylor JP (2017). The role of dipeptide repeats in C9ORF72-related ALS-FTD. Front Mol Neurosci 10. 10.3389/fnmol.2017.00035. [DOI] [PMC free article] [PubMed] [Google Scholar]
- 42.Krach F, Batra R, Wheeler EC, Vu AQ, Wang R, Hutt K, Rabin SJ, Baughn MW, Libby RT, Diaz-Garcia S, et al. (2018). Transcriptome–pathology correlation identifies interplay between TDP-43 and the expression of its kinase CK1E in sporadic ALS. Acta Neuropathol 136, 405–423. 10.1007/s00401-018-1870-7. [DOI] [PMC free article] [PubMed] [Google Scholar]
- 43.Wu C, Watts ME, and Rubin LL (2019). MAP4K4 Activation Mediates Motor Neuron Degeneration in Amyotrophic Lateral Sclerosis. Cell Rep 26, 1143–1156.e5. 10.1016/j.celrep.2019.01.019. [DOI] [PubMed] [Google Scholar]
- 44.Gurney ME, Pu H, Chiu AY, Dal Canto MC, Polchow CY, Alexander DD, Caliendo J, Hentati A, Kwon YW, Deng H-X, et al. (1994). Motor Neuron Degeneration in Mice that Express a Human Cu,Zn Superoxide Dismutase Mutation. Science (1979) 264, 1772–1775. 10.1126/science.8209258. [DOI] [PubMed] [Google Scholar]
- 45.Bowling AC, Schulz JB, Brown RH, and Beal MF (1993). Superoxide Dismutase Activity, Oxidative Damage, and Mitochondrial Energy Metabolism in Familial and Sporadic Amyotrophic Lateral Sclerosis. J Neurochem 61, 2322–2325. 10.1111/j.1471-4159.1993.tb07478.x. [DOI] [PubMed] [Google Scholar]
- 46.Neel D. v., Basu H, Gunner G, and Chiu IM (2022). Catching a killer: Mechanisms of programmed cell death and immune activation in Amyotrophic Lateral Sclerosis. Immunol Rev 311, 130–150. 10.1111/imr.13083. [DOI] [PMC free article] [PubMed] [Google Scholar]
- 47.Gomes C, Cunha C, Nascimento F, Ribeiro JA, Vaz AR, and Brites D (2019). Cortical Neurotoxic Astrocytes with Early ALS Pathology and miR-146a Deficit Replicate Gliosis Markers of Symptomatic SOD1G93A Mouse Model. Mol Neurobiol 56, 2137–2158. 10.1007/s12035-018-1220-8. [DOI] [PubMed] [Google Scholar]
- 48.MacLean M, Juranek J, Cuddapah S, López-Díez R, Ruiz HH, Hu J, Frye L, Li H, Gugger PF, and Schmidt AM (2021). Microglia RAGE exacerbates the progression of neurodegeneration within the SOD1G93A murine model of amyotrophic lateral sclerosis in a sex-dependent manner. J Neuroinflammation 18, 139. 10.1186/s12974-021-02191-2. [DOI] [PMC free article] [PubMed] [Google Scholar]
- 49.Papadeas ST, Kraig SE, O’Banion C, Lepore AC, and Maragakis NJ (2011). Astrocytes carrying the superoxide dismutase 1 (SOD1 G93A ) mutation induce wild-type motor neuron degeneration in vivo. Proceedings of the National Academy of Sciences 108, 17803–17808. 10.1073/pnas.1103141108. [DOI] [PMC free article] [PubMed] [Google Scholar]
- 50.Pasinelli P, Houseweart MK, Brown RH, and Cleveland DW (2000). Caspase-1 and −3 are sequentially activated in motor neuron death in Cu,Zn superoxide dismutase-mediated familial amyotrophic lateral sclerosis. Proceedings of the National Academy of Sciences 97, 13901–13906. 10.1073/pnas.240305897. [DOI] [PMC free article] [PubMed] [Google Scholar]
- 51.Rogers C, Erkes DA, Nardone A, Aplin AE, Fernandes-Alnemri T, and Alnemri ES (2019). Gasdermin pores permeabilize mitochondria to augment caspase-3 activation during apoptosis and inflammasome activation. Nat Commun 10, 1–17. 10.1038/s41467-019-09397-2. [DOI] [PMC free article] [PubMed] [Google Scholar]
- 52.Medana IM, and Esiri MM (2003). Axonal damage: A key predictor of outcome in human CNS diseases. Brain 126, 515–530. 10.1093/brain/awg061. [DOI] [PubMed] [Google Scholar]
- 53.Carty M, Kearney J, Shanahan KA, Hams E, Sugisawa R, Connolly D, Doran CG, Muñoz-Wolf N, Gürtler C, Fitzgerald KA, et al. (2019). Cell Survival and Cytokine Release after Inflammasome Activation Is Regulated by the Toll-IL-1R Protein SARM. Immunity 50, 1412–1424.e6. 10.1016/j.immuni.2019.04.005. [DOI] [PubMed] [Google Scholar]
- 54.Yu J, Li S, Qi J, Chen Z, Wu Y, Guo J, Wang K, Sun X, and Zheng J (2019). Cleavage of GSDME by caspase-3 determines lobaplatin-induced pyroptosis in colon cancer cells. Cell Death Dis 10. 10.1038/s41419-019-1441-4. [DOI] [PMC free article] [PubMed] [Google Scholar]
- 55.Zhang Z, Zhang H, Li D, Zhou X, Qin Q, and Zhang Q (2021). Caspase-3-mediated GSDME induced Pyroptosis in breast cancer cells through the ROS/JNK signalling pathway. J Cell Mol Med 25, 8159–8168. 10.1111/jcmm.16574. [DOI] [PMC free article] [PubMed] [Google Scholar]
- 56.Yang J, Wu Z, Renier N, Simon DJ, Uryu K, Park DS, Greer PA, Tournier C, Davis RJ, and Tessier-Lavigne M (2015). Pathological axonal death through a Mapk cascade that triggers a local energy deficit. Cell 160, 161–176. 10.1016/j.cell.2014.11.053. [DOI] [PMC free article] [PubMed] [Google Scholar]
- 57.Choi SY, Lopez-Gonzalez R, Krishnan G, Phillips HL, Li AN, Seeley WW, Yao WD, Almeida S, and Gao FB (2019). C9ORF72-ALS/FTD-associated poly(GR) binds Atp5a1 and compromises mitochondrial function in vivo. Nat Neurosci 22, 851–862. 10.1038/s41593-019-0397-0. [DOI] [PMC free article] [PubMed] [Google Scholar]
- 58.Tan G, Huang C, Chen J, Chen B, and Zhi F (2021). Gasdermin-E-mediated pyroptosis participates in the pathogenesis of Crohn’s disease by promoting intestinal inflammation. Cell Rep 35. 10.1016/j.celrep.2021.109265. [DOI] [PubMed] [Google Scholar]
- 59.Wang Y, Gao W, Shi X, Ding J, Liu W, He H, Wang K, and Shao F (2017). Chemotherapy drugs induce pyroptosis through caspase-3 cleavage of a gasdermin. Nature 547, 99–103. 10.1038/nature22393. [DOI] [PubMed] [Google Scholar]
- 60.Humphries F, Shmuel-Galia L, Ketelut-Carneiro N, Li S, Wang B, Nemmara V. v, Wilson R, Jiang Z, Khalighinejad F, Muneeruddin K, et al. (2020). Succination inactivates gasdermin D and blocks pyroptosis. Science 369, 1633–1637. 10.1126/science.abb9818. [DOI] [PMC free article] [PubMed] [Google Scholar]
- 61.Hu JJ, Liu X, Xia S, Zhang Z, Zhang Y, Zhao J, Ruan J, Luo X, Lou X, Bai Y, et al. (2020). FDA-approved disulfiram inhibits pyroptosis by blocking gasdermin D pore formation. Nat Immunol 21, 736–745. 10.1038/s41590-020-0669-6. [DOI] [PMC free article] [PubMed] [Google Scholar]
- 62.Zhang Y, Pak CH, Han Y, Ahlenius H, Zhang Z, Chanda S, Marro S, Patzke C, Acuna C, Covy J, et al. (2013). Rapid single-step induction of functional neurons from human pluripotent stem cells. Neuron 78, 785–798. 10.1016/j.neuron.2013.05.029. [DOI] [PMC free article] [PubMed] [Google Scholar]
- 63.Pagliuca FW, Millman JR, Gürtler M, Segel M, Van Dervort A, Ryu JH, Peterson QP, Greiner D, and Melton DA (2014). Generation of Functional Human Pancreatic β Cells In Vitro. Cell 159, 428–439. 10.1016/j.cell.2014.09.040. [DOI] [PMC free article] [PubMed] [Google Scholar]
- 64.Alami NH, Smith RB, Carrasco MA, Williams LA, Winborn CS, Han SSW, Kiskinis E, Winborn B, Freibaum BD, Kanagaraj A, et al. (2014). Axonal Transport of TDP-43 mRNA Granules Is Impaired by ALS-Causing Mutations. Neuron 81, 536–543. 10.1016/j.neuron.2013.12.018. [DOI] [PMC free article] [PubMed] [Google Scholar]
- 65.Maury Y, Côme J, Piskorowski RA, Salah-Mohellibi N, Chevaleyre V, Peschanski M, Martinat C, and Nedelec S (2015). Combinatorial analysis of developmental cues efficiently converts human pluripotent stem cells into multiple neuronal subtypes. Nat Biotechnol 33, 89–96. 10.1038/nbt.3049. [DOI] [PubMed] [Google Scholar]
- 66.Yang NJ, Isensee J, Neel D. v, Quadros AU, Zhang H-XB, Lauzadis J, Liu SM, Shiers S, Belu A, Palan S, et al. (2021). Anthrax toxins regulate pain signaling and can deliver molecular cargoes into ANTXR2+ DRG sensory neurons. Nat Neurosci. 10.1038/s41593-021-00973-8. [DOI] [PMC free article] [PubMed] [Google Scholar]
- 67.Basu H, Pekkurnaz G, Falk J, Wei W, Chin M, Steen J, and Schwarz TL (2021). FHL2 anchors mitochondria to actin and adapts mitochondrial dynamics to glucose supply. J Cell Biol 220. 10.1083/jcb.201912077. [DOI] [PMC free article] [PubMed] [Google Scholar]
- 68.Lim Y, Kehm VM, Li C, Trojanowski JQ, and Lee VMY (2010). Forebrain overexpression of α-synuclein leads to early postnatal hippocampal neuron loss and synaptic disruption. Exp Neurol 221, 86–97. 10.1016/j.expneurol.2009.10.005. [DOI] [PMC free article] [PubMed] [Google Scholar]
- 69.Elden AC, Kim HJ, Hart MP, Chen-Plotkin AS, Johnson BS, Fang X, Armakola M, Geser F, Greene R, Lu MM, et al. (2010). Ataxin-2 intermediate-length polyglutamine expansions are associated with increased risk for ALS. Nature 466, 1069–1075. 10.1038/nature09320. [DOI] [PMC free article] [PubMed] [Google Scholar]
Associated Data
This section collects any data citations, data availability statements, or supplementary materials included in this article.
Supplementary Materials
Supplementary video 1: Live cell imaging of GFP-GSDME transfected SH-SY5Y cells treated with 5uM of raptinal and either DMSO (top) or 20uM of zVAD-fMK (bottom). Cells were imaged every 10 minutes and GFP (GSDME) and RFP (PI) channels were collected (Related to Fig 3).
Supplementary videos 2–3: Representative reconstructions of mitochondria from mouse neurons transfected with GFP-GSDME and either (video 2) OMP25-mCherry or (video 3) Cox8-mCherry. These cells were treated with 10uM raptinal were fixed and imaged using structured illumination microscopy (SIM) to assess marker colocalization (Related to Fig 3).
Supplementary video 4: Recordings of female (top row) and male (bottom row) of SOD1G93A transgenic mice that are either GSDME KO (left panels) or GSDME WT (right panels). All recordings were taken from mice at P150 (Related to Fig 8).
Data Availability Statement
Enrichment analysis of GSDME on mitochondria, quantification of GSDME puncta and analysis of microtubule depolymerization was done using custom Fiji (ImageJ) macros. The DOI is listed in the key resources table. Any additional information required to reanalyze the data reported in this paper is available from the lead contact upon request.
Key resources table.
| REAGENT or RESOURCE | SOURCE | IDENTIFIER (Cat# ; RRID) |
|---|---|---|
| Antibodies | ||
| Rabbit monoclonal anti-GSDME | Abcam | #ab215191 ; RRID:AB_2737000 |
| Rabbit monoclonal anti-GSDMD | Abcam | #ab209845 ; RRID:AB_2783550 |
| Rabbit monoclonal anti-Caspase-3 | Cell Signaling | #9662S ; RRID:AB_331439 |
| Mouse monoclonal anti-GAPDH | EMD Millipore | #CB1001 ; RRID:AB_2107426 |
| Rabbit monoclonal anti-Cytochrome-C | Cell Signaling | #11940S; RRID:AB_2637071 |
| Mouse monoclonal anti-ATPF1 | Abcam | #ab117991; RRID:AB_10901555 |
| Mouse monoclonal anti- ATP5A | Abcam | #ab14748; RRID:AB_301447 |
| Rabbit polyclonal anti-FLAG | Sigma | #F7425-.2MG; RRID:AB_439687 |
| Mouse monoclonal anti-Tuj1 | Thermo Scientific | #MA1-118X; RRID:AB_2536830 |
| Mouse monoclonal anti-GFAP | Cell Signaling | #3670S; RRID:AB_561049 |
| Rabbit monoclonal anti-Iba1 | Cell Signaling | #17198S; RRID:AB_2820254 |
| Rabbit monoclonal anti-CD68 | Cell Signaling | #97778S; RRID:AB_2928056 |
| Anti-rabbit IgG, HRP-linked Antibody | Cell Signaling | #7074; RRID:AB_2099233 |
| Biotinylated anti-Rb IgG secondary antibody | Vector | #BA-1000; RRID:AB_2313606 |
| Rabbit monoclonal anti-Isl1/2 | Abcam | #ab109517; RRID:AB_10866454 |
| Biological samples | ||
| Sections of human brain tissue, see table S1 | UPenn Center for Neurodegenerative Disease Research Biobank | NA |
| Chemicals, peptides, and recombinant proteins | ||
| Poly-ornithine | Sigma | #P3655-50mg |
| Laminin | Life Technologies | #23017-015 |
| Matrigel Basement Membrane Matrix | Corning | #354234 |
| Neurobasal Medium | Gibco | #21103 |
| Glutamax | Gibco | #35050 |
| Dextrose | Sigma | #D9434-250g |
| MEM NEAA | Invitrogen | #11140-050 |
| B27 | Life Technologies | #17504-044 |
| BDNF | Peprotech | #450-02 |
| GDNF | Peprotech | #450-13 |
| CNTF | Peprotech | #450-10 |
| Puromycin | Life Technologies | #A11138-03 |
| Doxycycline hyclate | Sigma | #D9891-5g |
| ROCKi (Y-27632) | Stemcell Technologies | #72304 |
| Raptinal | Sigma | #SML1745 |
| Rotenone | Sigma | #R8875 |
| Antimycin-A | Sigma | #A8674 |
| 3-NP | Sigma | #N5636 |
| T-per buffer | Thermo | #78510 |
| tablet protease inhibitor | Sigma | #11836153001 |
| HALT protease inhibitor | Thermo | #87786 |
| 1 tablet Phosstop™- phosphatase inhibitor tablets | Sigma/Roche | #04906845001 |
| RIPA lysis buffer | EMD Milipore | #20-188 |
| Z-VAD-FMK | R&D | #FMK001 |
| BOLT 4X Loading Buffer | Thermo | #B0007 |
| BOLT 10X Reducing Agent | Thermo | #B0009 |
| Propidium Iodide | Abcam | #ab14083 |
| Image-iT TMRM | Thermo Scientific | #I34361 |
| Sytox Green | Thermo Scientific | #S7020 |
| Rabbit SignalStain® Boost IHC detection Reagent | Cell Signaling | #8114 |
| Mouse SignalStain® Boost IHC detection Reagent | Cell Signaling | #8125 |
| TSA Fluorescien reagent | Akoya Biosciences | #NEL745001KT |
| TSA Cy3 reagent | Akoya Biosciences | #NEL744001KT |
| Prolong gold antifade mounting medium | Cell Signaling | #8961S |
| Sodium Citrate Buffer | Cell Signaling | #14746 |
| Hematoxylin | Cell Signaling | #14166 |
| Tunicamycin | Sigma | #T7765 |
| Thapsigargin | Sigma | #T9033 |
| MG-132 | Sigma | #M8699 |
| poly-D-lysine | Life Technologies | #A3890401 |
| Fibronectin | VWR | #47743-654 |
| EDTA unmasking solution | Cell Signaling | #14746 |
| Nissl Neurotrace Green | Thermo Scientific | #N21480 |
| Critical commercial assays | ||
| CytoTox LDH release assay | Promega | #G1780 |
| Supersignal West Pico Chemiluminescent Substrate | Thermo Scientific | #34080 |
| CellTiter-Glo® 2.0 Cell Viability Assay | Promega | #G9241 |
| Experimental models: Cell lines | ||
| SH-SY5Y | ATCC | #CRL-2266 |
| HEK-293 | ATCC | #CRL-1573 |
| NGN2 tetracycline-inducible iPSC | Tracey-Young Pearse Lab | NA |
| Experimental models: Organisms/strains | ||
| C57BL/6NJ mouse | Jackson Labs | RRID:IMSR_JAX:005304 |
| C57BL/6N-Gsdmeem1Fsha/J | Jackson Labs | RRID:IMSR_JAX:032411 |
| B6.Cg-Tg(SOD1*G93A)dl1Gur/J | Jackson Labs | RRID:IMSR_JAX:002299 |
| Oligonucleotides | ||
| Primer for GSDME RT-qPCR, see Table S2 | This paper | NA |
| Primer for GAPDH RT-qPCR, see Table S2 | This paper | NA |
| Primer for TDP-43 (iMN sequencing), see Table S2 | Wu et al., 2019 | NA |
| Recombinant DNA | ||
| EF1a-GFP-GSDME | Vector Builder | #VB201104-1086dgk |
| CMV-GFP PR50 | Gift from Petrucelli lab | NA |
| CMV-GFP PR50 | Gift from Petrucelli lab | NA |
| CMV-GFP | Gift from Petrucelli lab | NA |
| pLVX-Puro TDP43 WT | Addgene | #133753 |
| Syn1-mKate-OMP-25 | Vector Builder | #VB210702-1212jtf |
| Cox8-GFP | Addgene | #172481 |
| mTagRFP-Membrane-1 | Addgene | #57992 |
| Cardiolipin shRNA 1, see in Table S2 | This paper | NA |
| Cardiolipin shRNA 2, see in Table S2 | This paper | NA |
| Cardiolipin shRNA 3, see in Table S2 | This paper | NA |
| Scrambled shRNA, see in Table S2 | This paper | NA |
| GSDME shRNA 1, see in Table S2 | This paper | NA |
| GSDME shRNA 2, see in Table S2 | This paper | NA |
| GSDME shRNA 3, see in Table S2 | This paper | NA |
| Lenti-Syn-PR50 | Gift from Gitler lab 33 | NA |
| Lenti-Syn-eGFP | Gift from Gitler lab 33 | NA |
| Lenti-Syn-TDP43 | Gift from Gitler lab 33 | NA |
| Software and algorithms | ||
| ImageJ v 1.4 | National Institutes of Health | https://imagej.nih.gov/ij/ |
| Graphpad Prism v 8.0 | GraphPad Software | https://www.graphpad.com |
| ImageJ code for depolymerization index | This paper: | https://www.doi.org/10.5281/zenodo.7622539 |