

Abstract
Background:
Programmed cell death-1 (PD-1) blockade has been shown to confer clinical benefit in cancer patients. Here, we assessed the level of serum interleukin 14α (IL14α) in patients receiving anti-PD-1 treatment.
Methods:
This prospective study recruited 30 patients with advanced solid cancer who received pembrolizumab treatment in Northern Jiangsu People’s Hospital between April 2016 and June 2018. The western blot analysis was used to assess the expression level of serum IL14α in patients at baseline and after 2 cycles of treatment. Interleukin 14α was performed using the unpaired 2-tailed Student test. The progression-free survival (PFS) and overall survival (OS) were calculated using the Kaplan-Meier method and compared by the log-rank test.
Results:
The early change of IL14α after 2 cycles of anti-PD-1 therapy was calculated as delta IL14α % change = (IL14α level after 2 cycles − IL14α level before treatment)/IL14α level before treatment × 100%. Receiver operating characteristic (ROC) was analyzed to get a cutoff point of delta IL14α % change as 2.46% (sensitivity = 85.71%, specificity = 62.5%; area under the ROC curve [AUC] = 0.7277, P = .034). Using this cutoff to subgroup the patients, an improved objective response rate was observed in patients with a delta IL14α change higher than 2.46% (P = .0072). A delta IL14α change over 2.46% was associated with a superior PFS (P = .0039).
Conclusions:
Early changes of serum IL14α levels may be a promising biomarker to predict outcomes in patients with solid cancer following anti-PD-1 treatment.
Keywords: Interleukin 14α, programmed cell death-1 inhibitor, prognosis, cancer
Immune checkpoint inhibitors (ICIs) targeting programmed cell death-1 (PD-1)/programmed cell death-ligand 1 (PD-L1) have been shown to conferred impressive benefit in cancer and have shifted the treatment paradigm across various cancer types.1-5 Despite the tremendous advantage of ICIs in cancer patients, some of them experienced accelerated progression and a majority of them ultimately failed treatment. 6 Considering limitations of the interval of radiological assessment, investigations have been conducted to identify optimal biomarkers to predict the efficacy of ICIs. Recently, PD-L1 expression level measured by immunohistochemistry of the tumor tissue, T-cell infiltration in the tumor microenvironment, and tumor mutation burden have been proposed to be predictive of ICIs treatment.7-10 Unfortunately, with the inconsistent results of different studies, the variety of antibodies, the inaccessible tumor tissue, and the difficulty in serial tissue sampling, it is an urgent need to identify a reliable and accessible biomarker to monitor and predict patient response to ICIs.
Interleukin 14 α (IL14α) is a B-cell growth factor, initially known as high molecular weight B-cell growth factor and in recent also known as taxilin. It was first discovered by Ambrus et al from the body cavity effusion of a patient with Burkitt lymphoma.11-13 B-cell has various functions in antitumor immune response tumor-infiltrating B lymphocytes (TIBs), and tumor tertiary lymphoid structures (TLSs) were found to play an important role in antitumor therapy.14,15 The activation of B-cells and its antitumor immune response are influenced by the tumor immune microenvironment. 16 In immune checkpoint therapy, B-cells are activated by T follicular helper cells that subsequently promote T-cells and generate antibodies which become a key to immunotherapy response. The activities of both B-cells and T-cells are altered by ICIs therapy. 17 Therefore, monitoring B-cell activity by IL14α levels may give us a new window to evaluate the efficacy of ICI treatments.
At present, there are no data to study the relationship between IL14α and prognostic factors after PD-1/PD-L1 inhibitor treatment. To further elucidate the role of IL14α as a biomarker in antitumor response, we investigated the expression of IL14α in the serum from various types of cancer patients (lung cancer, gynecological cancer, lymphoma, neuroendocrine tumor, sarcoma, breast cancer, kidney cancer, and digestive cancer) after exposure to anti-PD-1/PD-L1 inhibitors, followed by analysis of the relationship of IL14α levels with progression-free survival (PFS), overall survival (OS), and prognosis of various tumors. This will provide us with a new tool to predict the response of ICIs therapy.
Methods
Patients
A total of 30 cancer patients treated with pembrolizumab admitted to the Northern Jiangsu People’s Hospital between April 2016 and June 2018 were recruited in this prospective study. Serum was obtained at baseline and after 2 cycles. The study was approved by the Ethics Committee of the Northern Jiangsu People’s Hospital (approval no. ID2016008). All enrolled patients had signed informed consents.
Sample size determination
This study is a single-arm single-center phase II study. The maximum sample size enrollment for this single-arm phase II trial is approximately 31 patients with stage II patient accrual capped at no more than 8 patients. Enrolled patients who withdraw consent prior to receiving study therapy or who are unable to begin study therapy will be replaced.
Western blot assays
The western blot was run according to the instructions. The patient’s serum was diluted by 4 μL of serum into 20 μL phosphate-buffered saline (PBS) and 6 μL 5× loading buffer (Beyotime, Shanghai, China) (1:100 dilution). The sample was denatured in boiling water for 8 min, loaded onto 10% sodium dodecyl-sulfate polyacrylamide gel electrophoresis (SDS-PAGE) and transferred to PVDF (polyvinylidene fluoride) membranes. The membrane was immersed in blocking buffer (5% skimmed milk with Tris-buffered saline plus 0.1% Tween [TBST]) and incubated at room temperature for 2 h. After washing with TBST (TBST: 50 mL 20× TBST, 950 mL ultrapure water, 50 μL Tween) for 5 min, the membrane was incubated with IL14α primary antibody (1:4000) in blocking buffer at 4°C overnight. After washing with TBST 3 times for 5 min, the membrane was incubated with horseradish peroxidase-labeled goat antimouse immunoglobulin G (IgG) secondary antibody (diluted 1:5000 in blocking buffer) at room temperature for 2 h. Before visualizing the results in the machine (LI-COR, Lincoln, NE, USA), the membrane was washed 3 times with TBST for 5 min each time.
The relative intensity ratio of serum IL14α level was determined after the western blot. For comparison, the same internal positive control was used throughout the study to reflect the actual relative expression level of IL14α.
Statistical analysis
Continuous variables were presented as mean value ± standard deviation. To compare the difference between 2 groups, we performed the unpaired 2-tailed Student test. We used the Pearson χ2 test or the Fisher exact test to compare the clinical pathologic features between the groups. Response was evaluated per RECIST 1.1. Progression-free survival was the interval from the initiation of anti-PD-1 treatment to the first disease progression or death from any cause. Receiver operating characteristic (ROC) analysis was employed to determine the optimal cutoff point for continuous variables. Overall survival was defined as the time from the initiation of anti-PD-1 treatment to death from any cause or the date of the last follow-up information of a living patient. Overall survival and PFS were calculated using the Kaplan-Meier method and compared by the log-rank test. A 2-sided P-value of .05 or less was considered significant. Data were statistically analyzed with Prism (version 8.0, GraphPad software).
Data availability
The data set analyzed during this study is available from the corresponding author on a reasonable request.
Results
Patient characteristics
Overall, 18 male and 12 female patients were included. Median age of the 30 patients was 59.5 years (range = 27-80 years). Of the 30 patients, 12 of them had lung cancer (n = 12; 40%), followed by digestive cancer (n = 7; 23.3%), breast cancer (n = 4; 13.3%), and lymphoma (n = 3; 10%). Six patients (20%) underwent prior radiation therapy. Nine patients responded to anti-PD-1 treatment, and all of them achieved partial response (PR). Stable disease (SD) was observed in 8 patients (26.7%). Disease control was achieved in 17 (56.7%) patients. With a median follow-up of 703 days, 8 patients died (Table 1).
Table 1.
Clinicopathological characteristics of patient samples.
| Characteristics, N (%) | |
|---|---|
| Age, median (range) | 59.5 (27-80) |
| Sex (male) | 18 (60.0) |
| Type of tumor | |
| Lung cancer | 12 (40.0) |
| Gynecological cancer | 1 (3.3) |
| Lymphoma | 3 (10.0) |
| Neuroendocrine tumor | 1 (3.3) |
| Sarcoma | 1 (3.3) |
| Breast cancer | 4 (13.3) |
| Kidney cancer | 1 (3.3) |
| Digestive cancer | 7 (23.3) |
| Prior radiation therapy | |
| Yes | 6 (20.0) |
| No | 24 (80.0) |
| ORR | |
| CR | - |
| PR | 9 (30.0) |
| SD | 8 (26.7) |
| PD | 13 (43.3) |
| Response | |
| Yes | 17 (56.7) |
| No | 13 (43.3) |
| Death | |
| Yes | 22 (73.3) |
| No | 8 (26.6) |
Abbreviations: CR, complete response; ORR, objective response rate; PD, progressive disease; PR, partial response; SD, stable disease.
The correlation between levels of IL14α and clinical outcomes following PD-1 treatment
The level of IL14α at baseline and after 2 cycles of treatment was 2.1 ± 1.21 and 1.99 ± 0.82, respectively. Using mean level of baseline IL14α as a cutoff, we divided patients Group A (⩽mean IL14α before treatment) and Group B (>mean IL14α before treatment). No significant difference was identified in patient clinical characteristics or responses between the 2 groups (Table 2). There is no significant correlation between the baseline levels of IL14α and patient PFS (hazard ratio [HR] = 2.93, 95% confidence interval [CI] = 0.44-19.15, P = .4920) or OS (HR = 1.70, 95% CI = 0.50-5.70, P = .6339) (Figure 1A and B).
Table 2.
Correlation between serum levels of IL14α and clinical features.
| Characteristics | IL14α mean before treatment | P | IL14α mean after 2 cycles | P | ||
|---|---|---|---|---|---|---|
| Group A (N = 17) | Group B (N = 13) | Group C (N = 16) | Group D (N = 14) | |||
| Age median (range) | 63 (36-72) | 56 (27-80) | .740 | 63.5 (36-76) | 58 (27-80) | .556 |
| Sex, n (%) | ||||||
| Male | 12 (29.4) | 6 (53.9) | .175 | 11 (68.8) | 7 (50.0) | .295 |
| Female | 5 (70.6) | 7 (46.2) | 5 (31.3) | 7 (50.0) | ||
| Type of tumor, n (%) | ||||||
| Lung cancer | 7 (41.2) | 5 (38.5) | .478 | 8 (50.0) | 4 (28.6) | .226 |
| Gynecological cancer | - | 1 (7.7) | 1 (6.3) | - | ||
| Lymphoma | 1 (5.9) | 2 (15.4) | - | 3 (21.4) | ||
| Neuroendocrine tumor | 1 (5.9) | - | 1 (6.3) | - | ||
| Sarcoma | 1 (5.9) | - | 1 (6.3) | - | ||
| Breast cancer | 1 (5.9) | 3 (23.09) | 1 (6.3) | 3 (21.4) | ||
| Kidney cancer | 1 (5.9) | - | - | 1 (7.1) | ||
| Digestive cancer | 5 (29.4) | 2 (15.38) | 4 (25.0) | 3 (21.4) | ||
| Radiotherapy | ||||||
| RT | 3 (17.7) | 3 (23.1) | .712 | 4 (25.0) | 2 (14.3) | .464 |
| No RT | 14 (82.4) | 10 (76.9) | 12 (75.0) | 12 (85.7) | ||
| Response | ||||||
| Response | 10 (58.8) | 7 (53.9) | .785 | 9 (56.3) | 8 (57.1) | .960 |
| Non-response | 7 (41.2) | 6 (46.2) | 7 (43.8) | 6 (42.9) | ||
| IL14α level by intensity ratio (mean ± SD) | 1.411 ± 0.4486 | 3.012 ± 1.313 | <.001 | 1.373 ± 0.4027 | 2.704 ± 0.555 | <.001 |
Abbreviations: Group A, ⩽mean IL14α before treatment; Group B, >mean IL14α mean before treatment; Group C, ⩽mean IL14α mean after 2 cycles; Group D, >mean IL14α mean after 2 cycles; IL14α, interleukin 14α; RT, radiotherapy; SD, standard deviation.
Figure 1.

PFS and OS stratified by mean levels of IL14α at (A and B) baseline and (C and D) after 2 cycles of anti-PD-1 therapy.
IL14α indicates interleukin 14α; OS, overall survival; PD-1, programmed cell death-1; PFS, progression-free survival.
With mean level of IL14α post 2 cycles as a cutoff, we divided patients Group C (⩽mean IL14 α post 2 cycles) and Group D (>mean IL14 α post 2 cycles). There were no significant differences between Groups C and D in the patient characteristics (Table 2). No significant difference was identified in patient PFS (HR = 1.076, 95% CI = 0.375-3.087, P = .891) between Group C and Group D. A worse OS (HR = 3.136, 95% CI = 1.137-8.647, P = .0176) was observed in low expression groups after 2 cycles of anti-PD-1 therapy (Figure 1C and D).
The correlation between early change of IL14α and clinical outcomes following anti-PD-1 treatment
A total of 14 patients had elevated IL14α levels after 2 cycles of anti-PD-1 treatment. Of them, 10 patients (71.4%) had their disease controlled. Although 16 patients had a decrease in IL14α levels after treatment, only 7 patients (43.8%) achieved disease control. To better explore the predictive role of early changes in IL14α levels, we defined delta IL14α change as (IL14α level post 2 cycles − baseline IL14α level/baseline IL14α level × 100%). Receiver operating characteristic was applied to get an optimal cutoff based on the response to anti-PD-1 treatment. The cutoff of delta IL14α change is 2.46%, with an area under the ROC curve [AUC] of 0.7277 (sensitivity = 85.71%, specificity = 62.5%; P = .034; Figure 2). Delta IL14α change was significantly correlated to patient response to the anti-PD-1 treatment (Table 3). An improved objective response rate was observed in patients with a delta IL14α change over 2.46% (83.3% vs 33.3%, P = .0072) (Table 3 and Figure 3). In addition, univariate analysis suggested patients with a delta IL14α change over 2.46% had superior PFS (HR = 6.132, 95% CI = 2.151-17.48, P = .0039) compared with those had a lower delta IL14α change (Figure 4A). No difference was identified in OS between patients with different delta IL14α change levels (HR = 1.336, 95% CI = 0.577-3.095, P = .499) (Figure 4B).
Figure 2.

Receiver operating characteristic (ROC) analysis predicting therapeutic response after treatments. The crease line indicates AUC of the reference variable (delta IL14α change post 2 cycles); the dotted line indicates the area under the ROC curve (AUC) where the null hypothesis (P < .05) is not rejected, and the variable would have no predictive value.
AUC indicates area under the ROC curve; IL14α, interleukin 14α.
Table 3.
Correlation between dynamic change of IL14α and clinical features.
| Characteristics | Delta IL14α change after 2 cycles | P | |
|---|---|---|---|
| Group E (N = 18) | Group F (N = 12) | ||
| Age, median (range) | 58 (27-80) | 60.5 (45-72) | .785 |
| Sex, n (%) | |||
| Male | 10 (55.6) | 8 (66.7) | .542 |
| Female | 8 (44.4) | 4 (33.3) | |
| Type of tumor, n (%) | |||
| Lung cancer | 9 (50.0) | 3 (25.0) | |
| Gynecological cancer | 1 (5.6) | - | |
| Lymphoma | 2 (11.1) | 1 (8.3) | |
| Neuroendocrine tumor | 1 (5.6) | - | |
| Sarcoma | 1 (5.6) | - | .357 |
| Breast cancer | 2 (11.1) | 2 (16.7) | |
| Kidney cancer | - | 1 (8.3) | |
| Digestive cancer | 2 (11.1) | 5 (41.7) | |
| Radiotherapy, n (%) | |||
| RT | 5 (27.8) | 1 (8.3) | .192 |
| n-RT | 13 (72.2) | 11 (91.7) | |
| Response, n (%) | |||
| Response | 6 (33.3) | 10 (83.3) | .0072 |
| Non-response | 12 (66.7) | 2 (16.7) | |
| IL14α % increase after 2 cycles (mean ± SD) | −16.04 ± 15.31 | 31.46 ± 25.98 | <.0001 |
Abbreviations: Group E, ⩽ delta IL14α change (2.46%) after 2 cycles; Group F, >delta IL14α change (2.46%) after 2 cycles; IL14α, interleukin 14α; RT, radiotherapy.
Figure 3.
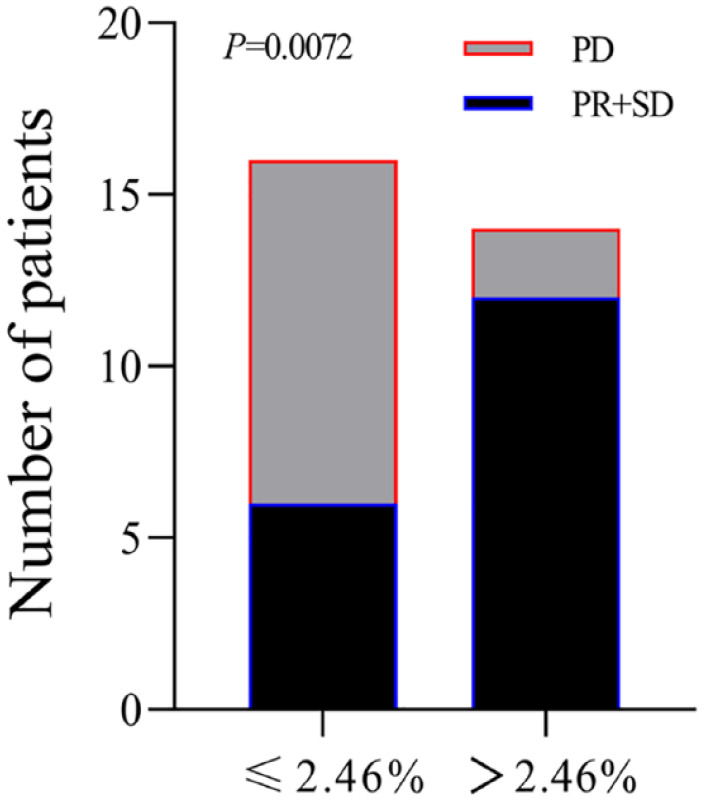
Overall response distribution of patients with cutoff as 2.46% of delta IL14α change.
IL14α indicates interleukin 14α; PD, progressive disease; PR, partial response; SD, stable disease.
Figure 4.

(A) PFS and (B) OS stratified by delta IL14α change cutoff (2.46%) after 2 cycles anti-PD-1 therapy.
IL14α indicates interleukin 14α; OS, overall survival; PFS, progression-free survival.
Discussion
In the last decade, anti-PD-1/PD-L1 agents have revolutionized the clinical management of various cancers. Despite of the tremendous benefit, hyper progressive disease has been reported following anti-PD-1/PD-L1 treatment and pseudoprogression has remained an unsolved challenge. Several biomarkers have been investigated, and PD-L1 expression has been approved as a determinative biomarker in many indications. However, the predictive role of response is overall limited.18,19 Within tumor tissue sampling, the variety in antibodies, pathological reports, and the heterogeneity in cancer type are obstacles for PD-L1 expression to be a pan-cancer biomarker for anti-PD-1/PD-L1 treatment. Therefore, serial liquid biomarkers hold the promise for predicting response to anti-PD-1/PD-L1 treatment and optimizing the treatment approach.
Interleukin 14α, also defined as taxilin, was initially identified as a high molecular weight B-cell growth factor that can promote B-cell proliferation, especially of B-cells within the germinal center. 20 Previous studies have shown that IL14α can selectively act on memory B-cells to enhance memory B-cell function.12,14,21 IL14α has also been correlated with the presence of autoantibodies [anti-Sjogren’s syndrome A (anti-SSA)/Ro and novel tissue-specific autoantibodies (TSA)] in the non-Hodgkin lymphoma patients. 22 Despite of the evidence of the active role of B-cell in anti-PD1 treatment, the association between IL14 α and the response to ICIs has not been reported. 23 Abundant in many human tumors, B-cells may play an active role in regulating antitumor response.13,18,24,25 In this report, we retrospectively included solid cancer patients treated with anti-PD-1 inhibitors in multiple trials and assessed the level of IL14α dynamically. Although no correlations were identified between patient survival and IL14α levels at baseline or post 2 cycles, the early changes of IL14α (presented as the increase % of IL14α post 2 cycles) was found to be associated with patient response and PFS following anti-PD-1 treatment. This study indicated IL14α changes as a biomarker to monitor response to anti-PD-1 treatment and predict patient survival across different tumor types.
This study has several limitations. First, we lack detailed information regarding prior treatment, PD-L1 expression, and tumor mutation burden in this study. Second, small sample size has limitations. However, in this study, we observed the serum change level of IL14 associated with response to anti-PD-1 therapy, even it is slightly weak in statistical power. The major limitation of a low n (number of patients/samples) was that it cannot be further analyzed by stratification. Stratified analysis can reduce the influence of confounding factors in the research results. Therefore, in this study, it cannot be achieved. Further studies conducted in large prospective cohorts of patients are warranted to confirm the prognostic role of early changes of IL14α in patients under anti-PD-1 treatment.
Conclusions
The early changes of serum IL14α level may be a promising biomarker for predicting the prognosis of solid cancer patients following anti-PD-1 treatment. It will help further optimize the ICIs paradigm of personalized medicine for patients with solid cancer.
Footnotes
The author(s) declared no potential conflicts of interest with respect to the research, authorship, and/or publication of this article.
Funding: The author(s) disclosed receipt of the following financial support for the research, authorship, and/or publication of this article: This study was supported by the Science and Technology Projects Fund of Yangzhou City (no. YZ2019057).
Author Contributions: JJG, LS, and BW contributed to conception and design of the study. JJG, CC, SJ, YL, BW, YH, YZ, LL, MW, JG, QJ, and JC helped with the acquisition of data. JJG, XZ, and YL analyzed and interpreted the retrospective clinical study and data. JJG, SJ, CC, and XZ wrote sections of the manuscript. JJG, YL, and BHW reviewed the article. All authors contributed to the article and approved the submitted version.
ORCID iDs: Caiyue Chen  https://orcid.org/0000-0001-8214-7142
References
- 1.Kooshkaki O, Derakhshani A, Safarpour H, et al. The latest findings of PD-1/PD-L1 inhibitor application in gynecologic cancers. Int J Mol Sci. 2020;21:5034. doi: 10.3390/ijms21145034 [DOI] [PMC free article] [PubMed] [Google Scholar]
- 2.Tumeh PC, Harview CL, Yearley JH, et al. PD-1 blockade induces responses by inhibiting adaptive immune resistance. Nature. 2014;515:568-571. doi: 10.1038/nature13954 [DOI] [PMC free article] [PubMed] [Google Scholar]
- 3.Chedgy EC, Black PC. Nivolumab: the new second line treatment for advanced renal-cell carcinoma commentary on: nivolumab versus everolimus in advanced renal-cell carcinoma. Urology. 2016;89:8-9. doi: 10.1016/j.urology.2015.12.003 [DOI] [PubMed] [Google Scholar]
- 4.Goodman A, Patel SP, Kurzrock R. PD-1-PD-L1 immune-checkpoint blockade in B-cell lymphomas. Nat Rev Clin Oncol. 2017;14:203-220. doi: 10.1038/nrclinonc.2016.168 [DOI] [PubMed] [Google Scholar]
- 5.Hamanishi J, Mandai M, Matsumura N, Abiko K, Baba T, Konishi I. PD-1/PD-L1 blockade in cancer treatment: perspectives and issues. Int J Clin Oncol. 2016;21:462-473. doi: 10.1007/s10147-016 [DOI] [PMC free article] [PubMed] [Google Scholar]
- 6.Pardoll DM. The blockade of immune checkpoints in cancer immunotherapy. Nat Rev Cancer. 2012;12:252-264. doi: 10.1038/nrc3239 [DOI] [PMC free article] [PubMed] [Google Scholar]
- 7.Havel JJ, Chowell D, Chan TA. The evolving landscape of biomarkers for checkpoint inhibitor immunotherapy. Nat Rev Cancer. 2019;19:133-150. doi: 10.1038/s41568-019 [DOI] [PMC free article] [PubMed] [Google Scholar]
- 8.Hellmann MD, Paz-Ares L, Bernabe Caro R, et al. Nivolumab plus ipilimumab in advanced non-small-cell lung cancer. N Engl J Med. 2019;381:2020-2031. doi: 10.1056/NEJMoa1910231 [DOI] [PubMed] [Google Scholar]
- 9.Long GV, Dummer R, Hamid O, et al. Epacadostat plus pembrolizumab versus placebo plus pembrolizumab in patients with unresectable or metastatic melanoma (ECHO-301/KEYNOTE-252): a phase 3, randomised, double-blind study. Lancet Oncol. 2019;20:1083-1097. doi: 10.1016/S1470-2045(19)30274 [DOI] [PubMed] [Google Scholar]
- 10.Ready N, Hellmann MD, Awad MM, et al. First-line nivolumab plus ipilimumab in advanced non-small-cell lung cancer (CheckMate 568): outcomes by programmed death ligand 1 and tumor mutational burden as biomarkers. J Clin Oncol. 2019;37:992-1000. [DOI] [PMC free article] [PubMed] [Google Scholar]
- 11.Qiao M, Jiang T, Ren S, Zhou C. Combination strategies on the basis of immune checkpoint inhibitors in non-small-cell lung cancer: where do we stand. Clin Lung Cancer. 2018;19:1-11. doi: 10.1016/j.cllc.2017.06.005 [DOI] [PubMed] [Google Scholar]
- 12.Ambrus JL, Jr, Fauci AS. Human B lymphoma cell line producing B cell growth factor. J Clin Invest. 1985;75:732-739. doi: 10.1172/JCI111754 [DOI] [PMC free article] [PubMed] [Google Scholar]
- 13.Ambrus JL, Jr, Chesky L, Stephany D, McFarland P, Mostowski H, Fauci AS. Functional studies examining the subpopulation of human B lymphocytes responding to high molecular weight B cell growth factor. J Immunol. 1990;145:3949-3955. [PubMed] [Google Scholar]
- 14.Ford R, Tamayo A, Martin B, et al. Identification of B-cell growth factors (interleukin-14; high molecular weight-B-cell growth factors) in effusion fluids from patients with aggressive B-cell lymphomas. Blood. 1995;86:283-293. [PubMed] [Google Scholar]
- 15.Sautès-Fridman C, Petitprez F, Calderaro J, Fridman WH. Tertiary lymphoid structures in the era of cancer immunotherapy. Nat Rev Cancer. 2019;19:307-325. doi: 10.1038/s41568-019 [DOI] [PubMed] [Google Scholar]
- 16.Wang SS, Liu W, Ly D, Xu H, Qu L, Zhang L. Tumor-infiltrating B cells: their role and application in anti-tumor immunity in lung cancer. Cell Mol Immunol. 2019;16:6-18. doi: 10.1038/s41423-018 [DOI] [PMC free article] [PubMed] [Google Scholar]
- 17.Tokunaga R, Naseem M, Lo JH, et al. B cell and B cell-related pathways for novel cancer treatments. Cancer Treat Rev. 2019;73:10-19. doi: 10.1016/j.ctrv.2018.12.001 [DOI] [PMC free article] [PubMed] [Google Scholar]
- 18.Hollern DP, Xu N, Thennavan A, et al. B cells and T follicular helper cells mediate response to checkpoint inhibitors in high mutation burden mouse models of breast cancer. Cell. 2019;179:1191-1206.e21. doi: 10.1016/j.cell.2019.10.028. [DOI] [PMC free article] [PubMed] [Google Scholar]
- 19.Rizvi NA, Hellmann MD, Snyder A, et al. Cancer immunology. Mutational landscape determines sensitivity to PD-1 blockade in non-small cell lung cancer. Science. 2015;348:124-128. doi: 10.1126/science.aaa1348 [DOI] [PMC free article] [PubMed] [Google Scholar]
- 20.Ayers M, Lunceford J, Nebozhyn M, et al. IFN-gamma-related mRNA profile predicts clinical response to PD-1 blockade. J Clin Invest. 2017;127:2930-2940. doi: 10.1172/JCI91190 [DOI] [PMC free article] [PubMed] [Google Scholar]
- 21.Shen L, Zhang C, Wang T, et al. Development of autoimmunity in IL-14alpha-transgenic mice. J Immunol. 2006;177:5676-5686. doi: 10.4049/jimmunol.177.8.5676 [DOI] [PubMed] [Google Scholar]
- 22.Xian Z, Fu D, Liu S, Yao Y, Gao C. Association between B cell growth factors and primary Sjögren’s syndrome-related autoantibodies in patients with non-Hodgkin’s lymphoma. J Immunol Res. 2019;2019:7627384. doi: 10.1155/2019/7627384 [DOI] [PMC free article] [PubMed] [Google Scholar]
- 23.Griss J, Bauer W, Wagner C, et al. B cells sustain inflammation and predict response to immune checkpoint blockade in human melanoma. Nat Commun. 2019;10:4186. doi: 10.1038/s41467-019 [DOI] [PMC free article] [PubMed] [Google Scholar]
- 24.Gallego-Valle J, Perez-Fernandez VA, Correa-Rocha R, Pion M. Generation of human Breg-like phenotype with regulatory function in vitro with bacteria-derived oligodeoxynucleotides. Int J Mol Sci. 2018;19:1737. doi: 10.3390/ijms19061737 [DOI] [PMC free article] [PubMed] [Google Scholar]
- 25.Khan AR, Hams E, Floudas A, Sparwasser T, Weaver CT, Fallon PG. PD-L1hi B cells are critical regulators of humoral immunity. Nat Commun. 2015;6:5997. doi: 10.1038/ncomms6997 [DOI] [PubMed] [Google Scholar]
Associated Data
This section collects any data citations, data availability statements, or supplementary materials included in this article.
Data Availability Statement
The data set analyzed during this study is available from the corresponding author on a reasonable request.