

Abstract
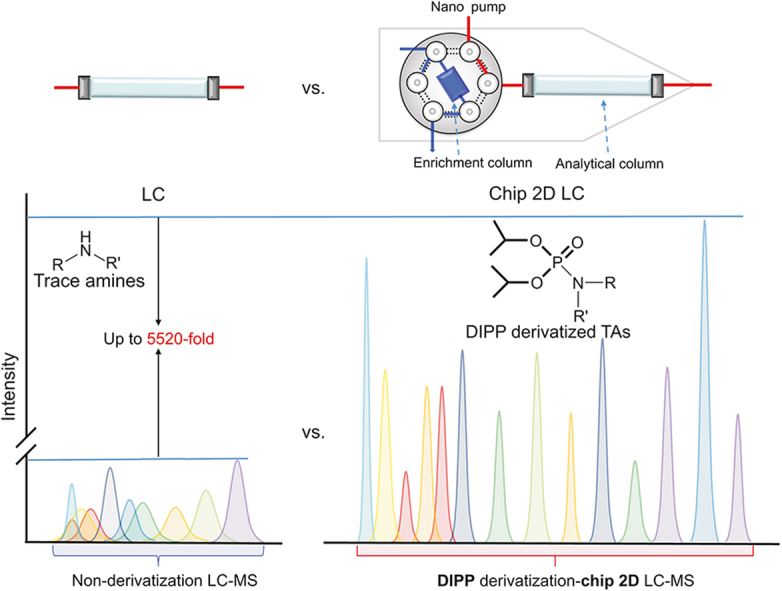
Trace amines (TAs) are metabolically related to catecholamine and associated with cancer and neurological disorders. Comprehensive measurement of TAs is essential for understanding pathological processes and providing proper drug intervention. However, the trace amounts and chemical instability of TAs challenge quantification. Here, diisopropyl phosphite coupled with chip two-dimensional (2D) liquid chromatography tandem triple-quadrupole mass spectrometry (LC-QQQ/MS) was developed to simultaneously determine TAs and associated metabolites. The results showed that the sensitivities of TAs increased up to 5520 times compared with those using nonderivatized LC-QQQ/MS. This sensitive method was utilized to investigate their alterations in hepatoma cells after treatment with sorafenib. The significantly altered TAs and associated metabolites suggested that phenylalanine and tyrosine metabolic pathways were related to sorafenib treatment in Hep3B cells. This sensitive method has great potential to elucidate the mechanism and diagnose diseases considering that an increasing number of physiological functions of TAs have been discovered in recent decades.
Keywords: Chip 2D LC-QQQ/MS, Trace amines, Derivatization, Hepatoma
Graphical abstract
Highlights
-
•
DIPP derivatization-chip 2D LC-QQQ/MS was developed to sensitively quantify TAs.
-
•
Sensitivities increased up to 5520 times compared with nonderivatization-UHPLC-QQQ/MS.
-
•
The lowest LOQ reached to 1 pg/mL level.
-
•
Phenylalanine and tyrosine metabolic pathways were closely related to sorafenib treatment.
1. Introduction
Trace amines (TAs), which are endogenous compounds, classically comprise phenylethylamine (PEA), tryptamine (TRA), octopamine (Oct), tyramine (TYA), and their metabolites [1]. Some TAs not only overlap functionally with classical biogenic amines regarding their structures but also play important roles in modulating monoamine systems as agonists of trace amine-associated receptors [[2], [3], [4]]. The physiological function of the human body is complex, and determination of disturbed TA catabolism is important for the diagnosis of diseases and proper therapy. Additionally, increasing evidence [[5], [6], [7]] suggests that TAs play important roles in cancer progression and can promote tumor cell survival and invasion through the β-2 adrenergic receptor, which facilitates hepatocellular carcinoma (HCC) progression. HCC is the fourth most common malignancy worldwide [8]. Therefore, characterizing trace-level amines is important in deciphering HCC progression.
It is well known that the detection of low molecular weight endogenous metabolites requires proper sample preparation steps to separate them from a complex matrix. However, TAs are structurally unstable and easily oxidized, which deteriorates them during sample preparation and makes them unsuitable for long-term storage. Additionally, the concentrations of TAs are usually 700-fold lower than those of classical monoamines and are detectable only at trace levels in human body fluids [9,10]. Precolumn derivatization should be a suitable strategy for not only addressing the problems of stability by the incorporation of derivatization reagents [11], but also improving the sensitivity. However, until now, only PEA, TYA, and TRA have been reported to be analyzed through three different derivatization approaches [[12], [13], [14], [15], [16]], and using several different reported methods would bring other issues. For example, many more samples, complex sample preparation, and long running time will be needed. Therefore, a method with high sensitivity and wide coverage for TAs is necessary. Fortunately, diisopropyl phosphite (DIPP) has been applied to selectively target amine groups of amino acids [17,18], peptides [19], and histamine [20], which show high sensitivity through liquid chromatography (LC)-mass spectrometry (MS) analysis. Thus, DIPP was used to label TAs in this study (Scheme S1).
Chip two-dimensional (2D) LC tandem triple-quadrupole (QQQ) MS (Chip 2D LC-QQQ/MS) has recently been frontier research by not only utilizing 75 μm i.d. columns and nanoflow rate that would lead to a significant increase in the detection sensitivity [21] but also merging injection, separation, and detection functionalities on a microfluidic chip, thus leading to a minimization of void volumes and better ionization efficiency of analytes. Chip 2D LC-QQQ/MS has already proven its superiority in the analysis of low levels of interest from complex biosamples [22]. In the present study, DIPP derivatization combined with chip 2D LC-QQQ/MS was established to provide high sensitivity and validated for the comprehensive detection of TAs as well as their associated metabolites (Table 1). Then, the newly developed approach was used to quantify TAs and associated metabolites in HCC cells after treatment with sorafenib.
Table 1.
Multiple reaction monitoring (MRM) parameters of each analyte for diisopropyl phosphite (DIPP) derivatization-chip two dimensional (2D) liquid chromatography tandem triple-quadrupole mass spectrometry (LC-QQQ/MS) approach.
| Classification | Analytes | Molecular formula for DIPP derivatives | Precursor ion (m/z) | Product ion (m/z) | Collision energy (eV) |
|---|---|---|---|---|---|
| Trace amines | Octopamine | C14H24NO5P | 318.2 | 216.1 | 13 |
| Tyramine | C14H24NO4P | 302.2 | 121.0 | 16 | |
| 3-methoxytyramine | C15H26NO5P | 332.2 | 151.0 | 12 | |
| N-methyltyramine | C15H26NO4P | 316.2 | 121.1 | 18 | |
| Tryptamine | C16H25N2O3P | 325.2 | 144.1 | 16 | |
| Phenethylamine | C14H24NO3P | 286.2 | 105.0 | 20 | |
| N-methyltryptamine | C17H27N2O3P | 339.2 | 144.1 | 15 | |
| N-methylphenethylamine | C15H26NO3P | 300.2 | 105.1 | 20 | |
| Associated metabolites | 5-hydroxytryptophan | C17H25N2O6P | 385.2 | 175.0 | 27 |
| Norepinephrine | C14H24NO6P | 334.1 | 232.0 | 10 | |
| Epinephrine | C15H26NO6P | 348.2 | 246.1 | 12 | |
| Levodopa | C15H24NO7P | 362.1 | 232.0 | 14 | |
| Dopamine | C14H24NO5P | 318.1 | 137.0 | 16 | |
| Serotonin | C16H25N2O4P | 341.1 | 160.0 | 18 |
2. Materials and methods
2.1. Chemicals and reagents
MS-grade methanol and acetonitrile (ACN) were purchased from Anaqua Chemicals Supply (Houston, TX, USA), and MS-grade formic acid was provided by Sigma-Aldrich Chemical Pvt., Ltd. (St. Louis, MO, USA). Ultrapure water (18.2 MΩ·cm) was produced by a Milli-Q purification system (Millipore Corporation, Burlington, MA, USA). Analytical-grade ethanol, triethylamine (TEA), and carbon tetrachloride (CCl4) were obtained from Tianjin Damao Chemical Reagent Factory (Tianjin, China).
The N-phosphorylation labeling reagent, DIPP, was obtained from Alfa Aesar Chemical Ltd. (Heysham, UK). Serotonin-α,α,β,β-d4 (5-HT-d4) was obtained from Sigma-Aldrich Chemical Pvt., Ltd.. All detailed information on the standards is shown in the Supplementary data.
2.2. Cell culture
HCC cell lines, including Hep3B and Huh7 cells, were purchased from the Shanghai Cell Bank of the Chinese Academy of Sciences (Shanghai, China). All cells were routinely cultured in Dulbecco's Modified Eagle's Medium (Invitrogen, Waltham, MA, USA) supplemented with 10% fetal bovine serum (Life Technologies, Hyclone, Hackensack, NJ, USA) in an atmosphere of humidified air containing 5% CO2 at 37 °C. According to the IC50 values, the initial sorafenib drug concentration was selected as 1 μmol/L. After 24 h of induction, a new culture medium was used. The drug concentration was increased by 0.1 μmol/L each time until the maximum induction concentration was 10 μmol/L. The drug-resistant cell lines were finally maintained in medium containing 4 μmol/L sorafenib.
2.3. Sample preparation
2.3.1. Preparation of standards
The stable isotope-labeled internal standard (IS), 5-HT-d4, was first dissolved in ACN and diluted to 5 ng/mL. All 14 standards were accurately weighed and dissolved in 50% (V/V) ACN, and then they were serially diluted to obtain a series of working solutions for the calibration curve. All solutions were stored at −20 °C before use.
2.3.2. Preparation of cell samples
HCC cells (105) were rinsed twice with phosphate-buffered saline and extracted with a mixture of ACN, water, and formic acid (80:19:1, V/V/V) on dry ice. Cells were then detached, subjected to two freeze-thaw cycles, and centrifuged. The residue was re-extracted twice with a mixture of ACN, methanol, and water (6:1:3, V/V/V), and the supernatants were combined and evaporated under vacuum. The residue was stored at −20 °C prior to derivatization.
2.4. N-phosphorylation labeling
The N-phosphorylation labeling reaction was performed according to previous reports [18,23] with some modifications. The standards or pretreated cell samples (50 μL) were first mixed with 50 μL of solution A (ethanol:TEA = 1:1, V/V). Subsequently, 25 μL of solution B (DIPP:CCl4 = 1:5, V/V) was gently added. After 5 min of reaction at 0 °C in an ice-water bath, derivatization was terminated by timely addition of formic acid (25 μL). Then, the mixture was evaporated to dryness under nitrogen stream. Finally, the residues were dissolved in 100 μL of H2O (0.1% (V/V) formic acid) and cleaned up by solid phase extraction (SPE) using hydrophilic lipophilic balanced (HLB) cartridges (30 mg, particle size 30 μm; Waters, Milford, MA, USA) according to the manufacturer's instructions. Then, the supernatants were dried under a nitrogen stream. The residues were dissolved in 50 μL of 20% ACN, and centrifuged at 13,000 rpm for 5 min at 4 °C. The supernatants were stored at −20 °C prior to analysis.
2.5. Chip 2D LC-QQQ/MS analysis
Chromatographic separation of high performance liquid chromatography (HPLC)-chip was performed on an ultra-high-capacity chip (No.: G4240-63001; Agilent Technologies, Santa Clara, CA, USA) that comprised an enrichment column (25 mm × 500 nL) and an analytical reversed-phase column (75 μm × 150 mm), which were both packed with Zorbax 80SB-C18 column (5 μm; Agilent Technologies) as the stationary phase. Each sample (2 μL) was first loaded onto the enrichment column with an isocratic loading solvent (20% ACN with 0.1% formic acid) at a flow rate of 3 μL/min. For the analytical column, the mobile phase consisted of (A) 0.1% formic acid in water and (B) 0.1% formic acid in ACN. After 2 min of sample loading and desalting, the stream-select module was switched where the enrichment column became in-line with the analytical nanocolumn. The separation was finally achieved using a linear gradient schedule at a flow rate of 0.5 μL/min: 40% of B at 0–2 min, 40%–95% of B at 2–10 min, and 95% of B at 10–12 min, and then equilibrated with 40% B for 2 min before the next run.
Quantitative analysis was carried out using an Agilent QQQ mass spectrometer, and quantification was achieved by using electrospray ionization in the positive ion mode and dynamic multiple reaction monitoring (MRM) mode. The MS parameters were set as follows: capillary voltage at 1750 V, sheath gas temperature at 225 °C, and a flow rate at 11 L/min. Other specific parameters of these analytes after derivatization, such as MRM transition and collision energy, are listed in Table 1.
2.6. Data analysis
Raw data were collected using an Agilent MassHunter Workstation and processed by QQQ Quantitative Analysis. Principal component analysis (PCA) was performed to assess the relationship between HCC cells and sorafenib treated HCC cells using SIMCA-P software (version 14.0; Umetrics, Umea, Sweden). The concentrations of these analytes in samples were calculated according to the standard curves and represented as the mean ± standard deviation (SD). Then, multivariate analysis of each analyte in group discrimination was measured by t-test using GraphPad Prism 8.0. The violin plot was analyzed through Hiplot (https://hiplot.com.cn/). Heatmap and clustering analyses were performed using TBtools (https://github.com/CJ-Chen/TBtools/releases). Differences with P < 0.05 were considered significant.
3. Results and discussion
3.1. Optimization of derivatization conditions
As we know, the reaction reagents are usually excessive to ensure complete reaction, which might lead to the production of byproducts. In our study, we investigated the influence of quenching the reaction using formic acid (FA) on the levels of TAs and associated metabolites. As shown in Fig. S1, without quenching the reaction, the contents of TRA significantly decreased within 30 min at 20 °C. Meanwhile, other TAs such as TYA, N-methyltyramine (NMTYA), N-methyltryptamine (NMTRA), PEA, and N-methylphenethylamine (NMPEA) showed degradation trends over time. However, after quenching the reaction using FA, the levels of these TAs only slightly changed with the extension of time. The associated metabolites such as norepinephrine (NE), epinephrine (E), and 5-HT had similar changing trends compared with those of TAs, except that dopamine (DA) showed an increasing trend without a quenching reaction. Thus, quenching the reaction is necessary for accurate determination.
Although DIPP derivatization has been applied to label amine groups [17,20,23], the long time and room temperature reaction [18] may not be suitable for TAs and their associated metabolites, as the existence of catechol groups is usually unstable in alkaline conditions and TAs are light-sensitive [10]. In our study, the reaction temperature (0 and 25 °C) was first optimized. From Fig. S2A, we found that the levels of TAs (Oct and NMTYA) and associated metabolite (NE) after reaction at 25 °C were lower than those after reaction at 0 °C. Next, the reaction time (1, 5, 10, 20, and 30 min) was optimized at 0 °C. All TAs (Fig. S2B) were close to the maximum levels after reaction for 5 min. In addition, some TAs such as Oct, NMTYA, TRA, and NMTRA gradually decreased after reaction from 10 to 30 min, while other TAs (TYA, 3-methoxytyramine (3-MT), PEA, and NMPEA) remained steady. Considering the lower contents of TAs in biological samples, 5 min was selected for the sensitive detection of TAs in our following study.
Taken together, unlike amino acids or peptides, the DIPP derivatization reaction for TAs must be quenched. Additionally, a low reaction temperature and short reaction time should be suitable for TAs. Finally, the optimal conditions of the DIPP derivatization reaction for TAs and associated metabolites were set as follows: standards or pretreated biological samples were derivatized with DIPP for 5 min at 0 °C, and terminated with FA.
3.2. Optimization of extraction procedures with the SPE clean-up step
Given that the derivatization reagents, byproducts, and coeluting matrix components may affect the ionization efficiency of TAs and lead to low sensitivity or block the following 2D chip-LC system, a clean-up procedure after derivatization was tried to remove them as much as possible. Two kinds of SPE columns, HLB and mixed-mode cation exchange (MCX), were applied in this research. Briefly, the standard mixture was added to the extracted cell sample residues, reacted with DIPP, and then evaporated under nitrogen. The residues were treated with or without SPE and analyzed through LC-MS. As shown in Fig. S3, the responses of two TAs, Oct and TYA, indeed increased after HLB purification compared to those without SPE clean-up or using MCX purification. Meanwhile, other TAs, including 3-MT, NMTYA, TRA, and NMTRA, had the similar responses after HLB purification with that without SPE clean-up, and their responses were higher than that of MCX purification. For the associated metabolites, such as NE, levodopa (l-DOPA), and DA, HLB purification was better than that without SPE or with MCX clean-up. Therefore, HLB was the most effective in removing the interferences of the matrix and was applied in our following research.
3.3. Improvement of separation efficiency and sensitivity after DIPP derivatization
The main purpose of derivatization is to improve the separation efficiency and detection sensitivities of TAs and associated metabolites during LC-MS analysis. The MRM parameters of nonderivatized TAs and associated metabolites were optimized (Table S1), and the MRM chromatograms of nonderivatized and derivatized metabolites are shown in Figs. 1A and B. The nonderivatized chromatogram showed that the retention of these metabolites was relatively weak on the C18 column, and most of the amines, such as Oct, DA, NE, and E, as well as 3-MT, 5-HT, and 5-hydroxytryptophan (5-HTP), were coeluted at approximately 0.6–1.1 min and 1.6–1.85 min, respectively. However, their retention on the C18 column increased and reached baseline separation after DIPP derivatization. Moreover, the peaks of some derivatized metabolites (3-MT, NMTYA, NMTRA, NMPEA, NE, E, 5-HTP, and l-DOPA) were narrower than those of their prototype compounds (Figs. 1A and B), which could increase their signal-to-noise (S/N) values.
Fig. 1.

Multiple reaction monitoring (MRM) chromatograms of trace amines (TAs) and associated metabolites. (A) MRM chromatograms of non-derivatized TAs and associated metabolites through ultra-high performance liquid chromatography (UHPLC)-triple quadrupole mass spectrometry (QQQ/MS) (inset: the partially expanded chromatogram, retention time from 0.5 to 2.0 min). (B) MRM chromatograms of diisopropyl phosphite (DIPP) derivatized TAs and associated metabolites through UHPLC-QQQ/MS (inset: the partially expanded chromatogram, retention time from 6.0 to 11.5 min and 14.5–16.8 min). (C) MRM chromatograms of DIPP derivatized TAs and associated metabolites through chip two dimensional (2D) liquid chromatography (LC)-QQQ/MS analysis (inset: the partially expanded chromatogram, retention time from 3.6 to 4.4 min). NE: norepinephrine; E: epinephrine; Oct: octopamine; DA: dopamine; l-DOPA: levodopa; TYA: tyramine; 5-HT: Serotonin; 5-HTP: 5-hydroxytryptophan; 3-MT: 3-methoxytyramine; PEA: phenylethylamine; NMPEA: N-methylphenethylamine; TRA: tryptamine; NMTRA: N-methyltryptamine; NMTYA: N-methyltyramine.
In addition to the improved LC separation, the detection sensitivities of TAs also increased compared to the nonderivatives (Table 2) [[24], [25], [26], [27], [28], [29]]. The sensitivities of TAs increased by 23-fold for NMTYA, 27.3-fold for TRA, and 10-fold for PEA, and the limit of quantifications (LOQs) reached 0.27, 0.44, and 1.14 ng/mL, respectively. Similarly, DIPP derivatization could also increase the sensitivities of associated metabolites. For instance, the sensitivities increased by 50-fold and 26.2-fold for 5-HTP and NE with LOQs of 0.32 and 0.45 ng/mL, respectively. The increased sensitivity might be attributed to the following reasons. First, after derivatization, the increased separation efficiency of these metabolites on the C18 column led to lower ionization suppression. Secondly, the introduction of a neutral phosphoryl group to TAs and associated metabolites could increase their proton affinity in the electrospray ionization process.
Table 2.
Linearity and sensitivity of each analyte using different quantitative methods.
| Analytes | Nonderivatization-UHPLC-QQQ/MS |
Derivatization-UHPLC-QQQ/MS |
Derivatization-chip 2D LC-QQQ/MS |
Reported LOQ (pg) | Refs. | ||||||||||
|---|---|---|---|---|---|---|---|---|---|---|---|---|---|---|---|
| Linear range (ng/mL) | r2 | LOQ (ng/mL) | Linear range (ng/mL) | r2 | LOQ (ng/mL) | Increased folds a | Linear range (pg/mL) | r2 | LOQ (pg/mL) | Increased folds b | Increased folds c | LOQ (pg) | |||
| Oct | 8.20–5436.00 | 0.984 | 8.20 | 0.80–2500.00 | 0.999 | 0.80 | 10.3 | 32.0–20,000.0 | 0.997 | 32.0 | 256.3 | 25.00 | 0.064 | 29.0 | [24] |
| TYA | 3.11–9733.00 | 0.990 | 3.11 | 2.50–3942.00 | 0.993 | 2.50 | 1.20 | 8.0–3980.0 | 0.991 | 8.00 | 388.8 | 312.5 | 0.016 | 0.00100 | [25] |
| 3-MT | 13.00–8177.00 | 0.992 | 13.0 | 1.31–4088.00 | 0.997 | 1.31 | 9.90 | 8.0–10,000.0 | 0.999 | 8.00 | 1625 | 163.7 | 0.016 | 16.5 | [26] |
| NMTYA | 6.20–4230.00 | 0.991 | 6.20 | 0.27–166.00 | 0.991 | 0.27 | 23.0 | 8.0–20,000.0 | 0.996 | 8.00 | 775.0 | 33.70 | 0.016 | 15.0 | [27] |
| TRA | 12.00–37,777.00 | 0.989 | 12.0 | 0.44–1374.00 | 0.993 | 0.44 | 27.3 | 16.0–20,000.0 | 0.995 | 16.0 | 750.0 | 27.50 | 0.032 | 0.0100 | [26] |
| PEA | 11.40–7140.00 | 0.981 | 11.4 | 1.14–3570.00 | 0.990 | 1.14 | 10.0 | 5.8–2920.0 | 0.998 | 5.80 | 1966 | 196.5 | 0.012 | 1.16 | [28] |
| NMTRA | 5.52–6900.00 | 0.983 | 5.52 | 2.21–1725.00 | 0.995 | 2.21 | 2.50 | 1.0–3310.0 | 0.999 | 1.00 | 5520 | 2210 | 0.0020 | 40.0 | [29] |
| NMPEA | 2.13–6666.00 | 0.984 | 2.13 | 0.34–720.00 | 0.991 | 0.34 | 6.30 | 5.5–2730.0 | 0.998 | 5.50 | 387.3 | 61.80 | 0.011 | – | – |
| 5-HTP | 16.00–49,870.00 | 0.994 | 16.0 | 0.32–4987.00 | 0.999 | 0.32 | 50.0 | 16.0–4080.0 | 0.997 | 16.0 | 1000 | 20.00 | 0.032 | – | – |
| NE | 11.80–7337.00 | 0.992 | 11.8 | 0.45–1435.00 | 0.999 | 0.45 | 26.2 | 10.0–98,000.0 | 0.998 | 10.0 | 1180 | 45.00 | 0.020 | – | – |
| E | 11.80–37,037.00 | 0.995 | 11.8 | 2.29–3588.00 | 0.991 | 2.29 | 5.10 | 200.0–99,670.0 | 0.991 | 200 | 59.00 | 11.40 | 0.40 | – | – |
| l-DOPA | 16.20–40,566.00 | 0.993 | 16.2 | 13.00–4057.00 | 0.993 | 13.00 | 1.20 | 200.0–100,330.0 | 0.996 | 200 | 81.00 | 65.00 | 0.40 | – | – |
| DA | 11.90–37,333.00 | 0.999 | 11.9 | 2.40–1503.00 | 0.990 | 2.40 | 4.90 | 210.0–104,400.0 | 0.991 | 210 | 56.70 | 11.40 | 0.42 | – | – |
| 5-HT | 11.70–36,648.00 | 0.999 | 11.7 | 1.17–3664.00 | 0.995 | 1.17 | 10.0 | 13.0–6420.0 | 0.999 | 13.0 | 900.0 | 90.00 | 0.026 | – | – |
a Increased fold was the comparison of LOQ using DIPP derivatization-UHPLC-QQQ/MS with that of nonderivatization-UHPLC-QQQ/MS approach. b Increased fold was the comparison of LOQ using DIPP derivatization-chip 2D LC-QQQ/MS with that of nonderivatization-UHPLC-QQQ/MS approach. c Increased fold was the comparison of LOQ using DIPP derivatization-chip 2D LC-QQQ/MS with that of DIPP derivatization-UHPLC-QQQ/MS approach. –: no data. UHPLC-QQQ-MS: ultra-high-performance liquid chromatography tandem triple-quadrupole mass spectrometry; 2D: two dimensional; LOQ: limit of quantification; DIPP: diisopropyl phosphite; Oct: octopamine; TYA: tyramine; 3-MT: 3-methoxytyramine; NMTYA: N-methyltyramine; TRA: tryptamine; PEA: phenylethylamine; NMTRA: N-methyltryptamine; NMPEA: N-methylphenethylamine; 5-HTP: 5-hydroxytryptophan; NE: norepinephrine; E: epinephrine; l-DOPA: levodopa; DA: dopamine; 5-HT: serotonin.
3.4. Optimization of chip 2D LC-MS platform
Although DIPP derivatization ultra-high performance liquid chromatography (UHPLC)-QQQ/MS improved the sensitivity of TAs and associated metabolites, the low levels of TAs (<10 ng/g or <1 nM) in biological samples challenged their detection [9,10]. For example, the concentration of 3-MT in plasma was below 10.02 pg/mL [30], which was lower than the LOQ (1.31 ng/mL) using DIPP derivatization UHPLC-QQQ/MS (Table 2). Additionally, the reported concentrations of Oct, TYA, and PEA in blood were 0.11, 0.067, and 0.6 ng/mL, respectively. These concentrations were lower than the LOQs (0.80, 2.50, and 1.14 ng/mL) using DIPP derivatization-UHPLC-QQQ/MS (Table 2). In our study, chip 2D LC-QQQ/MS was applied to solve the above difficulties, as it exhibits a nano-flow rate of the mobile phase and a smaller dead volume in connection with the HPLC-chip, which can provide high sensitivity [31]. Moreover, enrichment columns can trap the targeted metabolites and remove impurities to enhance the detection sensitivity. The optimized elution procedure with the proper analytical column would reach a higher separation efficiency. After optimization, the sensitivity and separation efficiency were greatly improved (Fig. 1C and Table 2).
3.5. Method development and validation of chip 2D LC-QQQ/MS
The calibration curves of all analytes after DIPP derivatization-chip 2D LC-MS were constructed by plotting the peak area ratio of the DIPP derivatized standards to the DIPP-labeled IS, 5-HT-d4-DIPP. The results showed that the LOQs of 3-MT, Oct, TYA, and PEA (8.0, 32.0, 8.0, and 5.8 pg/mL) were low enough for their detection in biological samples. All analytes exhibited good linearities (correlation coefficients r2 ≥ 0.991), and the LOQs of TAs were in the range of 1.0–32.0 pg/mL (0.0057–0.21 nmol/L) (Table 2).
The precision was assessed by using replicate analyses of quality control (QC) samples at low, middle, and high concentrations (Table S2) three times in one day (intra-assay) and three consecutive days (inter-assay), while the accuracy was evaluated by the percentage ratio of the measured concentration to the real concentration of the QC samples. The largest RSD of intra- and inter-day precision at three levels of QCs were 14.07% and 14.82%, and accuracies were in the range of 81.29%–118.67% (Table S3), which were also within the acceptable criteria.
To evaluate the extraction efficiency of TAs and matrix effects in cell samples, all 14 standards were dissolved in ACN (referred to neat solvent standards), while three levels of QC samples were also spiked into cell samples before or after the extraction procedure. Matrix effect and recovery were calculated according to the following equations: matrix effect (%) = (Rpost – Rnon)/Rs × 100%; recovery (%) = (Rpre – Rnon)/(Rpost – Rnon) × 100%. Here, Rs is the peak area of standards obtained in neat solution, while Rnon is their response in the matrix without standard spiking. Rpre and Rpost are the corresponding peak areas of spiked standards before and after extraction, respectively. The results showed that the matrix effects of all TAs and associated metabolites ranged from 84.29% to 112.0%, while the extraction recoveries ranged from 83.30% to 119.7% (Table S4). The results indicated that no significant matrix effect was derived from the matrix, and a good extraction procedure was obtained.
3.6. Comparison of chip 2D LC-QQQ/MS and UHPLC-QQQ/MS
The performance of DIPP derivatization-chip 2D LC-QQQ/MS and DIPP derivatization-UHPLC-QQQ/MS was further compared using LOQs (Table 2). The sensitivities of most TAs were found to be enhanced up to 2210 times. The LOQ of NMTRA was approximately 1.0 pg/mL using DIPP derivatization-chip 2D LC-QQQ/MS, which was significantly improved compared with that using DIPP derivatization-UHPLC-QQQ/MS (2.21 ng/mL). Compared with the reported method [29], the LOQ of NMTRA was approximately 20,000 times lower. The sensitivities of PEA increased 1966-fold and 196-fold compared with that using nonderivatization and DIPP derivatization-UHPLC-QQQ/MS approaches. Moreover, the LOQs of 3-MT, Oct, NMTYA, and PEA increased by 1031-, 453-, 937-, and 96.7- fold compared with those of the reported most sensitive literature [24,[26], [27], [28]]. In addition, the sensitivities of the associated metabolites increased approximately 59 to 1180- and 11 to 90-fold using DIPP derivatization-chip 2D LC-QQQ/MS compared with that using nonderivatization and DIPP derivatization-UHPLC-QQQ/MS approaches. The chip 2D LC-QQQ/MS system also exhibited higher S/N values than HPLC-QQQ/MS, when injecting the same amount of TAs or associated metabolites into the instruments (Fig. 1B and C). In addition, the shorter elution time of nano LC (Fig. 1C) indicated that the sample throughput would be increased when analyzing a series of complex biological samples. It should be especially noted that enough clean-up should be conducted to avoid blockage prior to chip 2D LC-MS analysis. The above results showed that chip 2D LC-QQQ/MS provided feasibility for the analysis of TAs and associated metabolites in a complex matrix.
3.7. Application
HCC is one of the main causes of cancer-related death worldwide [32]. Sorafenib is the first-line U.S. Food and Drug Administration-approved targeted drug for HCC [33]. However, the potential mechanism by which sorafenib affects HCC cells is unclear. It was reported that glutathione S-transferase zeta 1, which induced the catabolism of phenylalanine (Phe) to fatty acids, enhanced sorafenib-induced ferroptosis in HCC [34]. The reprogramming of Phe and tyrosine (Tyr) metabolism is one of the characteristics of HCC [35]. TAs, which are involved in Phe and Tyr metabolism, play important roles in cancer progression [5], and we proposed that TAs might be associated with the effects of sorafenib. Thus, TAs and associated metabolites in two kinds of HCC cells, Hep3B and Huh7, were quantified, and their changes after sorafenib treatment were investigated through our newly developed derivatization-chip 2D LC-QQQ/MS approach to reveal the potential mechanism of sorafenib treatment.
After quantification, the concentrations of TAs ranged from 0.0099 ± 0.0010 to 5.5000 ± 0.3380 ng/mL (mean ± SD) (Table 3). Then, PCA indicated that Hep3B cells could be separated well from the sorafenib-treated group (Fig. 2A), whereas the discrimination of Huh7 cells from those under sorafenib treatment was poor (Fig. 2B). Biplot, which could intuitively and quickly elaborate the relationships of metabolites with HCC cells, and the cells after sorafenib treatment, showed that NMTYA, NMPEA, PEA, NMTRA, and NE had strong effects on Hep3B cells, while Tyr, Phe, TYA, Oct, and 5-HTP contributed considerably to that treated with sorafenib (Fig. 2C). However, we could not find obvious correlations of these metabolites with Huh7 cells treated with or without sorafenib (Fig. 2D). Thus, Hep3B cells were used for our following research. The fold changes (FCs) and P values of each metabolite between Hep3B cells and those under treatment were further evaluated (Table 3). We found that NMTYA, NMPEA, PEA, NE, and TYA (P < 0.05, |FC| > 1.4), which are mainly involved in the Phe and Tyr metabolic pathways, exhibited significant differences in sorafenib-treated Hep3B cell samples compared with nontreated Hep3B cells (Fig. 3). Briefly, sorafenib induced decreased levels of PEA (FC = −1.45), NMPEA (FC = −3.19), NMTYA (FC = −1.71), and NE (FC = −1.72) in our study, which was consistent with previous reports that the catecholamines, such as NE, NMTYA, PEA, and NMPEA, could promote hepatocarcinogenesis and provide energy for the rapid proliferation of HCC cells [7,36]. Considering that catechol-O-methyltransferase (COMT) catalyzes the metabolism from TYA to NMTYA [37], we propose that COMT might be involved in the effects of sorafenib in Hep3B cells. In addition, Phe could be metabolized to PEA and NMPEA, and the different changing levels of these metabolites indicated that aromatic l-amino acid decarboxylase (AADC), which metabolizes Phe to PEA [38], might be a possible reason for sorafenib treatment in Hep3B cells. Moreover, NE also showed significant changing trends. Considering that Tyr could be successively metabolized to DOPA, DA, and NE, the decreased trend of NE in Hep3B cells after sorafenib treatment indicated that dopamine beta-hydroxylase, which catalyzes DA to NE [39], might also contribute to sorafenib treatment in Hep3B cells.
Table 3.
Concentrations (ng/mL, mean ± standard deviation (SD)) and statistical analysis of trace amines (TAs) and associated metabolites in hepatocellular carcinoma (HCC) cells.
| Analytes | Hep3B cells |
Huh7 cells |
||||||
|---|---|---|---|---|---|---|---|---|
| Control | Sorafenib treatment | Fold change a | P value | Control | Sorafenib treatment | Fold change a | P value | |
| Oct | 5.1000 ± 0.0738 | 5.3000 ± 0.0781 | 1.04 | 0.022 | 5.5000 ± 0.3380 | 5.4000 ± 0.5060 | ‒1.02 | 0.36 |
| TYA | 0.2700 ± 0.0393 | 0.5200 ± 0.1340 | 1.92 | 0.033 | 0.2700 ± 0.0496 | 0.2400 ± 0.0215 | ‒1.15 | 0.35 |
| NMTYA | 0.0240 ± 0.0030 | 0.0140 ± 0.0154 | ‒1.71 | 0.015 | 0.0170 ± 0.0025 | 0.0099 ± 0.0010 | ‒1.71 | 0.028 |
| TRA | 0.0200 ± 0.0015 | 0.0190 ± 0.0012 | ‒1.06 | 0.17 | 0.0200 ± 0.0014 | 0.0180 ± 0.0007 | ‒1.12 | 0.040 |
| PEA | 0.0520 ± 0.0108 | 0.0360 ± 0.0060 | ‒1.45 | 0.025 | 0.0460 ± 0.0113 | 0.0280 ± 0.0051 | ‒1.66 | 0.089 |
| NMTRA | 0.0670 ± 0.0210 | 0.0370 ± 0.0015 | ‒1.78 | 0.036 | 0.0540 ± 0.0110 | 0.0360 ± 0.0010 | ‒1.53 | 0.021 |
| NMPEA | 0.2400 ± 0.0303 | 0.0750 ± 0.0120 | ‒3.19 | 0.0011 | 0.0600 ± 0.0088 | 0.0650 ± 0.0185 | 1.07 | 0.72 |
| 5-HTP | 1.0000 ± 0.4510 | 3.3000 ± 0.8240 | 3.12 | 0.0072 | 0.7900 ± 0.2460 | 0.9100 ± 0.1680 | 1.15 | 0.25 |
| NE | 0.7600 ± 0.1220 | 0.4400 ± 0.1170 | ‒1.72 | 0.031 | 0.6600 ± 0.0506 | 0.4800 ± 0.0564 | ‒1.39 | 0.014 |
| E | 0.3200 ± 0.0229 | 0.3300 ± 0.0182 | 1.01 | 0.39 | 0.3500 ± 0.0206 | 0.3400 ± 0.0158 | ‒1.04 | 0.21 |
| 5-HT | 0.0780 ± 0.0157 | 0.0670 ± 0.0177 | ‒1.16 | 0.23 | 0.0750 ± 0.0114 | 0.0530 ± 0.0027 | ‒1.42 | 0.015 |
a Fold change was calculated (sorafenib treatment group/control group) from the mean values of each group. Fold change with a positive value indicates a relatively higher concentration present in sorafenib treated group compared with control group, while a negative value means a relatively lower concentration as compared to the control group. Oct: octopamine; TYA: tyramine; NMTYA: N-methyltyramine; TRA: tryptamine; PEA: phenylethylamine; NMTRA: N-methyltryptamine; NMPEA: N-methylphenethylamine; 5-HTP: 5-hydroxytryptophan; NE: norepinephrine; E: epinephrine; 5-HT: serotonin.
Fig. 2.

Principal component analysis (PCA) model. (A) Score plots of PCA model separating Hep3B cells (green color) from that treated with sorafenib (blue color). (B) Score plots of PCA model separating HuH7 cells (green color) from that treated with sorafenib (blue color). (C) PCA biplot was generated using the samples (green: Hep3B cells, blue: Hep3B cells after sorafenib treatment) and the metabolites (yellow: metabolites). (D) PCA biplot was generated using the samples (green: Huh7 cells, blue: Huh7 cells after sorafenib treatment) and the metabolites (yellow: metabolites). NMPEA: N-methylphenethylamine; TRA: tryptamine; PEA: phenylethylamine; NMTRA: N-methyltryptamine; NMTYA: N-methyltyramine; NE: norepinephrine; 5-HT: 5-hydroxytryptophan; 3-MT: 3-methoxytyramine; E: epinephrine; DA: dopamine; l-DOPA: levodopa; Tyr: tyrosine; Phe: phenylalanine; Oct: octopamine; TYA: tyramine; 5-HTP: 5-hydroxytryptophan.
Fig. 3.

Developmental the changes of trace amines (TAs) and associated metabolites in phenylalanine (Phe) and tyrosine (Tyr) metabolic pathways. (A) Changing levels of TAs associated with Phe and Tyr metabolic pathways in Hep3B cells treated with or without sorafenib. (B) Pathways invloved in Phe and Tyr metabolism; red boxes represent the increased levels and blue boxes represent the decreased levels of TAs and associated metabolites in Hep3B cells after sorafenib treatment. ∗P < 0.05 and ∗∗P < 0.01. TYA: tyramine; PEA: phenylethylamine; NMPEA: N-methylphenethylamine; NE: norepinephrine; NMTYA: N-methyltyramine; AADC: l-amino acid decarboxylase; DA: dopamine; l-DOPA: levodopa; DBH: dopamine beta-hydroxylase; COMT: catechol-O-methyltransferase.
Overall, the improvement of sensitivity achieved by the combination of DIPP derivatization and chip 2D LC-MS detection showed important significance for the discovery of the new potential mechanism of sorafenib on Hep3B. Using our newly developed approach, seven TAs were quantified in HCC cells for the first time. In particular, NMTYA could not be quantified using the reported methods (Table S5) [24,25,[27], [28], [29]] and NMPEA has not been studied in HCC cells. The decreased trends of these two metabolites and PEA, and the increased level of TYA in Hep3B cells after sorafenib treatment facilitated the finding that the relevant enzymes, AADC and COMT, might be involved in the effects of sorafenib on Hep3B cells.
4. Conclusion
In this study, DIPP derivatization coupled with chip 2D LC-QQQ/MS approach was developed to sensitively quantify TAs and their associated metabolites. The sensitivities were increased up to 5520 times compared with that using the nonderivatization UHPLC-QQQ/MS approach. This method was successfully applied to the investigation of TAs and associated metabolite alterations in HCC cells. Finally, these extremely low levels of TAs and associated metabolites such as TYA, NMTYA, PEA, and NE were quantified and their significant differences manifested the potential mechanism of sorafenib treatment on HCC cells. Due to the important roles of TAs and associated metabolites, the presently developed method should have great potential for the mechanism and diagnosis of diseases in the future.
CRediT author statement
Xiqing Bian: Methodology, Investigation, Formal analysis, Writing - Original draft preparation; Yida Zhang: Methodology, Investigation, Writing - Original draft preparation; Na Li: Conceptualization, Supervision, Funding acquisition, Writing - Reviewing and Editing; Menglin Shi: Resources; Xiaolin Chen: Data curation; Hui-Lu Zhang: Methodology; Jie Liu: Supervision; Jian-Lin Wu: Conceptualization, Supervision.
Declaration of competing interest
The authors declare that there are no conflicts of interest.
Acknowledgments
This work was supported by the Science and Technology Development Fund, Macao, China (Grant No.: FDCT 0044/2018/AFJ).
Footnotes
Peer review under responsibility of Xi'an Jiaotong University.
Supplementary data to this article can be found online at https://doi.org/10.1016/j.jpha.2023.02.003.
Contributor Information
Jie Liu, Email: jieliu@fudan.edu.cn.
Jian-Lin Wu, Email: jlwu@must.edu.mo.
Appendix A. Supplementary data
The following is the Supplementary data to this article.
References
- 1.Pradhan T., Jung H.S., Jang J.H., et al. Chemical sensing of neurotransmitters. Chem. Soc. Rev. 2014;43:4684–4713. doi: 10.1039/c3cs60477b. [DOI] [PubMed] [Google Scholar]
- 2.Black S.W., Schwartz M.D., Chen T.M., et al. Trace amine-associated receptor 1 agonists as narcolepsy therapeutics. Biol. Psychiatry. 2017;82:623–633. doi: 10.1016/j.biopsych.2016.10.012. [DOI] [PMC free article] [PubMed] [Google Scholar]
- 3.Rutigliano G., Accorroni A., Zucchi R. The case for TAAR1 as a modulator of central nervous system function. Front. Pharmacol. 2018;8:987. doi: 10.3389/fphar.2017.00987. [DOI] [PMC free article] [PubMed] [Google Scholar]
- 4.Narang D., Tomlinson S., Holt A., et al. Trace amines and their relevance to psychiatry and neurology: A brief overview. Klin. Psikofarmakol. Bul. 2011;21:73–79. [Google Scholar]
- 5.Stohs S.J., Shara M., Ray S.D. p-Synephrine, ephedrine, p-octopamine and m-synephrine: Comparative mechanistic, physiological and pharmacological properties. Phytother Res. 2020;34:1838–1846. doi: 10.1002/ptr.6649. [DOI] [PMC free article] [PubMed] [Google Scholar]
- 6.Vogelsang T.L.R., Vattai A., Schmoeckel E., et al. Trace amine-associated receptor 1 (TAAR1) is a positive prognosticator for epithelial ovarian cancer. Int. J. Mol. Sci. 2021;22:8479. doi: 10.3390/ijms22168479. [DOI] [PMC free article] [PubMed] [Google Scholar]
- 7.Wu F.-Q., Fang T., Yu L.-X., et al. ADRB2 signaling promotes HCC progression and sorafenib resistance by inhibiting autophagic degradation of HIF1α. J. Hepatol. 2016;65:314–324. doi: 10.1016/j.jhep.2016.04.019. [DOI] [PubMed] [Google Scholar]
- 8.Singal A.G., Lampertico P., Nahon P. Epidemiology and surveillance for hepatocellular carcinoma: New trends. J. Hepatol. 2020;72:250–261. doi: 10.1016/j.jhep.2019.08.025. [DOI] [PMC free article] [PubMed] [Google Scholar]
- 9.Gainetdinov R.R., Hoener M.C., Berry M.D. Trace amines and their receptors. Pharmacol. Rev. 2018;70:549–620. doi: 10.1124/pr.117.015305. [DOI] [PubMed] [Google Scholar]
- 10.Wong J.-M.T., Malec P.A., Mabrouk O.S., et al. Benzoyl chloride derivatization with liquid chromatography-mass spectrometry for targeted metabolomics of neurochemicals in biological samples. J. Chromatogr. A. 2016;1446:78–90. doi: 10.1016/j.chroma.2016.04.006. [DOI] [PMC free article] [PubMed] [Google Scholar]
- 11.Deng P., Zhan Y., Chen X., et al. Derivatization methods for quantitative bioanalysis by LC-MS/MS. Bioanalysis. 2012;4:49–69. doi: 10.4155/bio.11.298. [DOI] [PubMed] [Google Scholar]
- 12.Khan H.A., Ullah Q., Ahmad A., et al. Elsevier, Amsterdam; 2016. Methods of trace amine analysis in mammalian brain. Trace Amines and Neurological Disorders; pp. 11–26. [Google Scholar]
- 13.Gao P.-F., Guo X.-F., Wang H., et al. Determination of trace biogenic amines with 1,3,5,7-tetramethyl-8-(N-hydroxysuccinimidyl butyric ester)-difluoroboradiaza-s-indacene derivatization using high-performance liquid chromatography and fluorescence detection. J. Sep. Sci. 2011;34:1383–1390. doi: 10.1002/jssc.201100120. [DOI] [PubMed] [Google Scholar]
- 14.Cai Y., Sun Z., Chen G., et al. Rapid analysis of biogenic amines from rice wine with isotope-coded derivatization followed by high performance liquid chromatography-tandem mass spectrometry. Food Chem. 2016;192:388–394. doi: 10.1016/j.foodchem.2015.07.024. [DOI] [PubMed] [Google Scholar]
- 15.Shen N.-Y., Zheng S.-Y., Wang X.-Q. Determination of biogenic amines in Pu-erh tea with precolumn derivatization by high-performance liquid chromatography. Food Anal. Methods. 2017;10:1690–1698. [Google Scholar]
- 16.Płotka-Wasylka J., Simeonov V., Namieśnik J. An in situ derivatization - dispersive liquid-liquid microextraction combined with gas-chromatography-mass spectrometry for determining biogenic amines in home-made fermented alcoholic drinks. J. Chromatogr. A. 2016;1453:10–18. doi: 10.1016/j.chroma.2016.05.052. [DOI] [PubMed] [Google Scholar]
- 17.Chen X., Gao D., Liu F., et al. A novel quantification method for analysis of twenty natural amino acids in human serum based on N-phosphorylation labeling using reversed-phase liquid chromatography-tandem mass spectrometry. Anal. Chim. Acta. 2014;836:61–71. doi: 10.1016/j.aca.2014.05.053. [DOI] [PubMed] [Google Scholar]
- 18.Gao X., Bi X., Wei J., et al. N-phosphorylation labeling for analysis of twenty natural amino acids and small peptides by using matrix-assisted laser desorption/ionization time-of-flight mass spectrometry. Analyst. 2013;138:2632–2639. doi: 10.1039/c3an00036b. [DOI] [PubMed] [Google Scholar]
- 19.Chen J., Chen Y., Gong P., et al. Novel phosphoryl derivatization method for peptide sequencing by electrospray ionization mass spectrometry. Rapid Commun. Mass Spectrom. 2002;16:531–536. doi: 10.1002/rcm.604. [DOI] [PubMed] [Google Scholar]
- 20.Hu X., Bian X., Gu W.-Y., et al. Stand out from matrix: Ultra-sensitive LC-MS/MS method for determination of histamine in complex biological samples using derivatization and solid phase extraction. Talanta. 2021;225:122056. doi: 10.1016/j.talanta.2020.122056. [DOI] [PubMed] [Google Scholar]
- 21.Dams M., Dores-Sousa J.L., Lamers R.J., et al. High-resolution nano-liquid chromatography with tandem mass spectrometric detection for the bottom-up analysis of complex proteomic samples. Chromatographia. 2019;82:101–110. [Google Scholar]
- 22.Piendl S.K., Raddatz C.R., Hartner N.T., et al. 2D in seconds: Coupling of chip-HPLC with ion mobility spectrometry. Anal. Chem. 2019;91:7613–7620. doi: 10.1021/acs.analchem.9b00302. [DOI] [PubMed] [Google Scholar]
- 23.Dašková V., Buter J., Schoonen A.K., et al. Chiral amplification of phosphoramidates of amines and amino acids in water. Angew Chem. Int. Ed. Engl. 2021;60:11120–11126. doi: 10.1002/anie.202014955. [DOI] [PMC free article] [PubMed] [Google Scholar]
- 24.Gosetti F., Mazzucco E., Gennaro M.C., et al. Simultaneous determination of sixteen underivatized biogenic amines in human urine by HPLC-MS/MS. Anal. Bioanal. Chem. 2013;405:907–916. doi: 10.1007/s00216-012-6269-z. [DOI] [PubMed] [Google Scholar]
- 25.Fu Y., Zhou Z., Li Y., et al. High-sensitivity detection of biogenic amines with multiple reaction monitoring in fish based on benzoyl chloride derivatization. J. Chromatogr. A. 2016;1465:30–37. doi: 10.1016/j.chroma.2016.08.067. [DOI] [PubMed] [Google Scholar]
- 26.Tufi S., Lamoree M., de Boer J., et al. Simultaneous analysis of multiple neurotransmitters by hydrophilic interaction liquid chromatography coupled to tandem mass spectrometry. J. Chromatogr. A. 2015;1395:79–87. doi: 10.1016/j.chroma.2015.03.056. [DOI] [PubMed] [Google Scholar]
- 27.Guo X.-F., Wang J.-Y., Wang H., et al. Simultaneous determination of primary and secondary phenethylamines in biological samples by high-performance liquid chromatographic method with fluorescence detection. J. Chromatogr. B. 2014;967:69–74. doi: 10.1016/j.jchromb.2014.07.017. [DOI] [PubMed] [Google Scholar]
- 28.Zheng J., Mandal R., Wishart D.S. A sensitive, high-throughput LC-MS/MS method for measuring catecholamines in low volume serum. Anal. Chim. Acta. 2018;1037:159–167. doi: 10.1016/j.aca.2018.01.021. [DOI] [PubMed] [Google Scholar]
- 29.McIlhenny E.H., Pipkin K.E., Standish L.J., et al. Direct analysis of psychoactive tryptamine and harmala alkaloids in the Amazonian botanical medicine ayahuasca by liquid chromatography-electrospray ionization-tandem mass spectrometry. J. Chromatogr. A. 2009;1216:8960–8968. doi: 10.1016/j.chroma.2009.10.088. [DOI] [PubMed] [Google Scholar]
- 30.van Faassen M., Bischoff R., Eijkelenkamp K., et al. In matrix derivatization combined with LC-MS/MS results in ultrasensitive quantification of plasma free metanephrines and catecholamines. Anal. Chem. 2020;92:9072–9078. doi: 10.1021/acs.analchem.0c01263. [DOI] [PMC free article] [PubMed] [Google Scholar]
- 31.Liu Q., Cobb J.S., Johnson J.L., et al. Performance comparisons of nano-LC systems, electrospray sources and LC-MS-MS platforms. J. Chromatogr. Sci. 2014;52:120–127. doi: 10.1093/chromsci/bms255. [DOI] [PMC free article] [PubMed] [Google Scholar]
- 32.Llovet J.M., Montal R., Sia D., et al. Molecular therapies and precision medicine for hepatocellular carcinoma. Nat. Rev. Clin. Oncol. 2018;15:599–616. doi: 10.1038/s41571-018-0073-4. [DOI] [PMC free article] [PubMed] [Google Scholar]
- 33.Xie L., Zeng Y., Dai Z., et al. Chemical and genetic inhibition of STAT3 sensitizes hepatocellular carcinoma cells to sorafenib induced cell death. Int. J. Biol. Sci. 2018;14:577–585. doi: 10.7150/ijbs.22220. [DOI] [PMC free article] [PubMed] [Google Scholar]
- 34.Wang Q., Bin C., Xue Q., et al. GSTZ1 sensitizes hepatocellular carcinoma cells to sorafenib-induced ferroptosis via inhibition of NRF2/GPX4 axis. Cell Death Dis. 2021;12:426. doi: 10.1038/s41419-021-03718-4. [DOI] [PMC free article] [PubMed] [Google Scholar]
- 35.Stepien M., Duarte-Salles T., Fedirko V., et al. Alteration of amino acid and biogenic amine metabolism in hepatobiliary cancers: Findings from a prospective cohort study. Int. J. Cancer. 2016;138:348–360. doi: 10.1002/ijc.29718. [DOI] [PubMed] [Google Scholar]
- 36.Thaker P.H., Han L.Y., Kamat A.A. Chronic stress promotes tumor growth and angiogenesis in a mouse model of ovarian carcinoma. Nat. Med. 2006;12:939–944. doi: 10.1038/nm1447. [DOI] [PubMed] [Google Scholar]
- 37.Dhakal S., Macreadie I. Potential contributions of trace amines in Alzheimer's disease and therapeutic prospects. Neural Regen. Res. 2021;16:1394–1396. doi: 10.4103/1673-5374.300985. [DOI] [PMC free article] [PubMed] [Google Scholar]
- 38.Han S.-W., Choi Y.-R., Shin J.-S. Biocatalytic decarboxylation of aromatic l-amino acids with in situ removal of both products for enhanced production of biogenic amines. Catal. Lett. 2021;151:2996–3003. [Google Scholar]
- 39.Gonzalez-Lopez E., Vrana K.E. Dopamine beta-hydroxylase and its genetic variants in human health and disease. J. Neurochem. 2020;152:157–181. doi: 10.1111/jnc.14893. [DOI] [PubMed] [Google Scholar]
Associated Data
This section collects any data citations, data availability statements, or supplementary materials included in this article.