

Abstract
Fabry disease (FD), a lysosomal storage disorder, is caused by defective α-galactosidase (GLA) activity, which results in the accumulation of globotriaosylceramide (Gb3) in endothelial cells and leads to life-threatening complications such as left ventricular hypertrophy (LVH), renal failure, and stroke. Enzyme replacement therapy (ERT) results in Gb3 clearance; however, because of a short half-life in the body and the high immunogenicity of FD patients, ERT has a limited therapeutic effect, particularly in patients with late-onset disease or progressive complications. Because vascular endothelial cells (VECs) derived from FD-induced pluripotent stem cells display increased thrombospondin-1 (TSP1) expression and enhanced SMAD2 signaling, we screened for chemical compounds that could downregulate TSP1 and SMAD2 signaling. Fasudil reduced the levels of p-SMAD2 and TSP1 in FD-VECs and increased the expression of angiogenic factors. Furthermore, fasudil downregulated the endothelial-to-mesenchymal transition (EndMT) and mitochondrial function of FD-VECs. Oral administration of fasudil to FD mice alleviated several FD phenotypes, including LVH, renal fibrosis, anhidrosis, and heat insensitivity. Our findings demonstrate that fasudil is a novel candidate for FD therapy.
Keywords: Fabry disease, iPSCs, vascular endothelial cells, drug screening, fasudil
Graphical abstract
This study highlights the utility of a functional platform using iPSC-derived specialized cells to screen for clinical drugs that could be repurposed. Using this platform, Han and colleagues identified fasudil as a novel candidate for therapy of FD patients.
Introduction
Fabry disease (FD) is an X-linked lysosomal storage disorder caused by α-galactosidase A (GLA) deficiency.1,2 The disease is characterized by a buildup of globotriaosylceramide (Gb3) in various cell types, especially endothelial cells.3 Vascular lesions, including angiokeratomas, usually develop at an early age in FD patients4 and advance to life-threatening vasculopathies such as left ventricular hypertrophy (LVH), renal failure, and brain stroke.5,6 These complications are assumed to be associated with abnormalities of microvascular function.7 Nowadays, FD patients are typically treated via enzyme replacement therapy (ERT) using recombinant human α-galactosidase (agalsidase-β), or via pharmacological chaperone therapy.8,9 Although ERT can improve the pathophysiologic symptoms of FD temporarily, it is unable to prevent the progression of complications, specifically renal disease, in FD patients.10,11,12 Moreover, the therapeutic effects of ERT are limited because of a short half-life in the body and the high immunogenicity of FD patients.13 Chaperone therapy is also limited in that it is only effective in FD patients who have particular GLA mutational variations.14,15 Therefore, there is a need to develop new therapeutic strategies for vasculopathy in FD.
Induced pluripotent stem cells (iPSCs) with human disease-specific phenotypes can be employed as an effective and powerful tool for new drug discovery. We previously reported that vascular endothelial cells (VECs) in renal biopsies from FD patients show increased expression of thrombospondin-1 (TSP1) and decreased expression of angiogenic factors (vascular endothelial growth factor receptor 2 [KDR] and endothelial nitric oxide synthase [eNOS]).16 Furthermore, VECs derived from FD-iPSCs (FD-VECs) display enhanced levels of TSP1 and p-SMAD2, as well as hyperactive TGF-β signaling, resulting in defective angiogenesis in vitro. Notably, knockout of TSP1 and/or suppression of TGF-β signaling rescues the impaired angiogenesis of FD-VECs. These findings suggest that FD-VECs can be used as a screening tool to identify chemicals or molecules that may alleviate the vasculopathy of FD patients.
TGF-β signaling plays a key role in the endothelial-to-mesenchymal transition (EndMT) of VECs,17 and EndMT results in the development of fibrosis in various tissues.18 As a hallmark of FD, tissue ischemia due to a buildup of Gb3 in the microvasculature can result in fibrosis.19 Although Gb3 accumulation is cleared to some extent by ERT, the therapy is inefficient in FD patients with progressive tissue fibrosis12; therefore, pharmacological manipulation to regulate EndMT would be a useful therapeutic strategy to improve ERT in FD patients.
Here, we screened a library of 2,107 U.S. Food and Drug Administration (FDA)-approved and biologically annotated preclinical and clinical compounds to identify those that may be useful therapeutic agents for FD. One compound (fasudil) reduced the levels of p-SMAD2 and TSP1 in FD-VECs, and increased those of the angiogenic factors KDR and eNOS. In addition, fasudil inactivated TGF-β-induced EndMT and reduced reactive oxidative stress (ROS) and maximal respiration in FD-VECs. In vivo, oral administration of fasudil to transgenic mice expressing human TSP1 (Gla−/−/TSP1Tg [FD mice]) rescued several FD phenotypes, including LVH, renal fibrosis, anhidrosis, and heat insensitivity. We suggest that fasudil is a potent clinical compound that could be used to rescue dysfunctional angiogenesis and improve several symptoms in FD patients.
Results
Screening of compounds from a clinical chemical library using FD-VECs
Figure 1A shows a schematic overview of the process for screening clinical compounds. FD-VECs were differentiated from FD-iPSCs as described previously.16 Briefly, magnetic activated cell sorting (MACS)-sorted CD31+ cells were approximately 15%–20% of total cells and were matured to FD-VECs for 7 days in vitro. A library of 2,107 FDA-approved and biologically annotated preclinical and clinical compounds was used in the chemical screening assay. In the first screening, 451 chemical compounds were selected on the basis of a lack of cytotoxicity and/or no aberrant morphological changes of FD-VECs. In the second screening, 15 compounds were selected on the basis of their ability to promote the formation of tube-like structures by FD-VECs. The total tube lengths of FD-VECs incubated with these 15 compounds (at 5 μM) were at least 1.5-fold higher than those of control FD-VECs treated with DMSO and were also higher than those of FD-VECs treated with the TGF-β inhibitor SB431542 (Figure 1B). Next, we repeated the tube-like structure forming assay using various concentrations (0.5, 1, and 5 μM) of the 15 compounds and found that six compounds induced a relative total tube length that was longer than that induced by the DMSO control (Figure 1C). The selected compounds included two preclinical compounds, a TGF-β receptor inhibitor (D-4476) and a PPARγ antagonist (T0070907), and four clinical compounds such as a calcium channel blocker (lomerizine), a COX inhibitor (tolfenamic acid), a member of the class of piperazines (eprazinone), and a RhoA/Rho kinase (ROCK) inhibitor (fasudil). FD-VECs treated with the six selected compounds were able to form tube-like structures, respectively (Figure S1A). An immunofluorescence analysis confirmed that the six compounds reduced the TSP1 protein level in FD-VECs (Figure S1B). In addition, immunoblotting revealed that each compound downregulated the levels of p-SMAD2 and TSP1 in FD-VECs, and significantly increased the levels of the angiogenic factors KDR and eNOS (Figure 1D). Thus, we established a novel phenotypic screening platform for drug repurposing that involves examination of the in vitro functionality of FD-VECs.
Figure 1.

Screening of hit compounds from a clinical chemical library using FD-VECs
(A) Schematic overview of the drug screening procedure using FD-VECs that were differentiated from FD-iPSCs. The abilities of 2,107 preclinical or clinical chemical compounds to improve the endothelial functionality of FD-VECs were examined. In the first screen, compounds inducing cytotoxicity and/or aberrant morphological changes of FD-VECs were excluded. The effects of the compounds on the ability of FD-VECs to form tube-like structures were evaluated in the second and third screens. (B) Scatterplot showing the total tube lengths of FD-VECs treated with DMSO (negative control), the TGF-β inhibitor SB431542 (SB; positive control, 5 μM), and the first screened clinical compounds (5 μM). Two independent experiments were conducted. FD, FD1-VECs. (C) The relative total tube lengths of FD-VECs treated with DMSO (negative control), the TGF-β inhibitor SB431542 (SB; positive control), or the second screened clinical compounds at different concentrations (0.5, 1, or 5 μM). Data are represented as mean ± SEM (n = 3); ∗p < 0.05 and ∗∗∗p < 0.001 (Student’s t test). 1, D-4476; 2, fasudil; 3, T0070907; 4, N-(4-butoxyphenyl)acetamide; 5, lomerizine; 6, aconitine; 7, tolfenamic acid; 8, quinine-ethyl-carbonate; 9, corticosterone; 10, nialamide; 11, amikacin; 12, bromocriptine; 13, GR-159897; 14, PK 11195; 15, eprazinone. (D) Western blot analysis of p-SMAD2, SMAD2, TSP1, KDR, eNOS, and GAPDH in WT-VECs, untreated FD-VECs, and FD-VECs treated with the indicated compounds. Data are represented as mean ± SEM (n = 5); ∗p < 0.05, ∗∗p < 0.01, and ∗∗∗p < 0.001 (Student’s t test). WT, WT-VECs; FD, FD1-VECs; E, eprazinone; L, lomerizine; TA, tolfenamic acid; F, fasudil; D, D-4476; T, T0070907.
Fasudil improves the defective tube formation ability of FD-VECs
Among the six compounds selected via the screening analysis, fasudil was chosen for further analysis because it was repeatedly the most effective at promoting the tube-like structure formation of FD-VECs. On the basis of the total tube length, we determined that the optimal concentration and half maximal effective concentration (EC50) of fasudil were 5 μM and 0.4183 μM, respectively (Figure S2A). Therefore, a 5 μM concentration was used in subsequent experiments. Treatment with 5 μM fasudil significantly increased the tube length of FD-VECs compared with the nontreated group, and the tube length of the fasudil-treated FD-VECs was comparable with that of gene-corrected FD-VECs (FD[c]-VECs) (Figure 2A). Fasudil also enhanced the tubular formation ability of VECs derived from FD-iPSC lines with distinct GLA mutations (Figure S2B). Furthermore, compared with nontreated FD-VECs, both FD(c)-VECs and fasudil-treated FD-VECs had reduced expression levels of p-SMAD2 and TSP1 and increased expression levels of KDR and eNOS (Figure 2B). These results were confirmed by immunostaining of TSP1 and KDR (Figure 2C). Overall, these findings demonstrate that fasudil is effective in alleviating the defective angiogenesis of FD-VECs in vitro.
Figure 2.

The effect of fasudil on the angiogenesis of FD-VECs
(A) Tube-like structure formation by WT-VECs, untreated (FD) or fasudil-treated FD-VECs, and gene-corrected FD-VECs (FD[c]). Data are represented as mean ± SEM (n = 3; p < 0.05 (Student’s t test). WT, WT-VECs; FD, FD1-VECs; FD(c), gene-corrected FD1-VECs. Scale bar: 200 μm. (B) Western blot analysis of p-SMAD2, SMAD2, TSP1, KDR, eNOS, and GAPDH in the cells described in (A). Data are represented as mean ± SEM (n = 7); ∗p < 0.05 and ∗∗∗p < 0.001 (Student’s t test). (C) Immunostaining of TSP1 and KDR in the cells described in (A). Scale bar: 50 μm.
Fasudil improves the functionality of FD-VECs by downregulating EndMT
Next, we examined the mechanism by which fasudil improves the defective angiogenic ability of FD-VECs. Hyperactive SMAD2 signaling induces EndMT in VECs, thereby reducing angiogenic functionality.17 Given its ability to reduce the expression of p-SMAD2 in FD-VECs, we examined the effect of fasudil on the EndMT of these cells. Before the chemical treatment, we performed bulk RNA sequencing of FD-VECs and FD(c)-VECs to examine the mechanism underlying the defective vasculopathy of FD-VECs. Unsupervised hierarchical clustering of the RNA sequencing data showed a distinct segregation of gene profiles between FD-VECs and FD(c)-VECs (Figure S3A). A Gene Ontology (GO) functional analysis revealed that genes related to the regulation of SMAD phosphorylation, blood vessel remodeling, and smooth muscle cell proliferation were upregulated in FD-VECs compared with FD(c)-VECs (Figure S3B), suggesting that Gb3 accumulation induces hyperactivated TGF-β signaling and leads to the transition of endothelial cell properties of FD-VECs. The RNA sequencing analysis also revealed that compared with those in FD(c)-VECs, the expression levels of mesenchymal-related genes (COL1A2, ACTA2, SERPINE1, VIM, and FN) were upregulated, and those of endothelial-related genes (VEGFR, NOS3, ANGPT2, BMPER, and VWF) were downregulated in FD-VECs (Figure S3C). Compared with those in WT-VECs and FD(c)-VECs, the protein level of CD31 was downregulated, and those of mesenchymal-related genes (COL1A1, ACTA2, SNAI1, and TWIST) were upregulated in FD-VECs (Figure 3A). Inhibition of TGF-β signaling using SB431542 increased the protein level of CD31 and reduced those of mesenchymal-related markers in FD-VECs (Figure S3D), and fasudil had comparable effects (Figure 3B). Immunostaining confirmed that the fluorescence intensities of ACTA2, SNAI1, and COL1A1 were reduced following treatment of FD-VECs with fasudil (Figure 3C). Collectively, these results demonstrate that the impaired angiogenesis of FD-VECs is associated with increased EndMT caused by hyperactive TGF-β signaling, and fasudil is able to suppress TGF-β-induced EndMT.
Figure 3.

Fasudil downregulates the EndMT of FD-VECs
(A) Western blot analysis of EndMT-associated factors (CD31, COL1A1, ACTA2, SNAI1, and TWIST) in WT-VECs, FD-VECs, and gene-corrected FD-VECS (FD[c]). GAPDH expression was used as a loading control. Data are represented as mean ± SEM (n = 4); ∗p < 0.05 and ∗∗∗p < 0.001 (Student’s t test). WT, WT-VECs; FD, FD1-VECs; FD(c), gene-corrected FD1-VECs. (B) Western blot analysis of EndMT-associated factors in WT-VECs, untreated (FD) or fasudil-treated FD-VECs, and gene-corrected FD-VECs (FD[c]). Data are represented as mean ± SEM (n = 4); ∗∗p < 0.01 (Student’s t test). (C) Immunostaining of EndMT-associated factors in the cells described in (B). Scale bar: 50 μm.
Fasudil alleviates impaired metabolic processes in FD-VECs
Next, we examined the mechanism by which fasudil suppresses TGF-β-induced EndMT in FD-VECs. ROS is a key contributor to the vascular damage caused by TGF-β-induced EndMT.20 The RNA sequencing analysis showed that FD-VECs had aberrant expression profiles of various metabolic genes related to lysosomes, oxidative stress, and peroxisomes (Figures S4A and S4B). Treatment of FD-VECs with fasudil reduced the mRNA levels of ROS-related genes (GSTM1, NCF2, and PPARGC1A) in FD-VECs (Figure 4A). In addition, as reported previously,21 FD-VECs had a higher level of ROS than WT-VECs (Figure 4B), but treatment with fasudil reduced the level of ROS to that seen in WT-VECs and FD(c)-VECs. Measurement of the oxygen consumption rate (OCR) in WT-VECs and FD-VECs showed that the latter displayed enhanced basal respiration (I), ATP production (II), maximal respiration (III), and spare capacity (IV). Treatment of FD-VECs with fasudil partially reduced maximal respiration but did not alter basal respiration, ATP production, or spare capacity (Figure 4C). These results indicate that fasudil promotes ROS clearance in FD-VECs.
Figure 4.

Fasudil alleviates impaired metabolic processes in FD-VECs
(A) The transcriptional levels of ROS-related genes (GSTM1, NCF2, and PPARGC1A) in WT-VECs, untreated (FD) or fasudil-treated FD-VECs, and gene-corrected FD-VECs (FD[c]). Data are represented as mean ± SEM (n = 4); ∗p < 0.05 and ∗∗p < 0.01 (Student’s t test). WT, WT-VECs; FD, FD1-VECs; FD(c), gene-corrected FD1-VECs. (B) Representative images showing the fluorescence intensity of ROS in the cells described in (A). Data in the graph are represented as mean ± SEM (n = 4); ∗p < 0.05 and ∗∗p < 0.01 (Student’s t test). Scale bar: 50 μm. (C) Extracellular flux analysis of the oxygen consumption rate (OCR) in the cells described in (A). Data are represented as mean ± SEM (n = 6). O, oligomycin; F, FCCP; R&A, rotenone and antimycin A.
Fasudil alleviates FD phenotypes in FD mice after oral administration
Currently available animal models of FD with GLA deficiency do not fully exemplify the vasculopathy of human FD patients.22,23,24 In our previous study, we found that renal tissue biopsies from FD patients had higher levels of TSP1 than those from healthy donors.16 Therefore, we hypothesized that Gla−/− mice expressing human TSP1 (Gla−/−/TSP1Tg) might be an appropriate animal model of FD-related vasculopathy. To produce transgenic mice representing FD phenotypes, we first generated Gla−/− mice using the CRISPR-Cas9 system (Figures S5A and S5B) and transgenic mice expressing human TSP1 (TSP1Tg) (Figure S5C). Then, we produced a large number of Gla−/−/TSP1Tg mice by crossbreeding the Gla−/− mice with TSP1Tg mice to subject to subsequent experiments for efficacy test of fasudil. Before oral administration with fasudil, we examined FD phenotypes in four different groups (WT, TSP1Tg, Gla−/−, and Gla−/−/TSP1Tg mice). It is reported that LVH occurs in up to half of males and one-third of females in FD patients.25 So, we investigated the cardiac functionality in each mouse group via echocardiography. As results, Gla−/−/TSP1Tg mice specifically exhibited a higher ratio of left ventricular (LV) mass to body weight (BW) compared with other mice (Figure S5D). Moreover, Gla−/− mice and Gla−/−/TSP1Tg mice showed reduced values of cardiac ejection fraction and fractional shortening compared with WT and TSP1Tg mice, and the value of cardiac output decreased only in Gla−/−/TSP1Tg mice. Thus, Gla−/−/TSP1Tg mice showed a FD phenotype of impaired cardiac functionality. Next, we additionally performed the sweat test in four different groups (WT, TSP1Tg, Gla−/−, and Gla−/−/TSP1Tg mice) to see another FD phenotype, anhidrosis. Interestingly, Gla−/− mice and Gla−/−/TSP1Tg mice displayed reduced number of sweat spots compared with WT and TSP1Tg mice, respectively (Figure S5E). Collectively, Gla−/−/TSP1Tg mice had evident FD phenotypes in terms of LVH and anhidrosis. Hence, we orally administered fasudil (10 or 30 mg/kg/day) into Gla−/−/TSP1Tg mice (hereafter named FD mice) for 6 months, starting from approximately 2 months of age (Figure 5A). Compared with WT mice, FD mice had a higher LV mass/body weight and lower cardiac ejection fraction, fractional shortening of the heart, and cardiac output (Figure 5B). The LV mass/BW was significantly reduced in FD mice treated with fasudil (10 or 30 mg/kg) for 6 months (Figure 5B). Furthermore, fasudil administration enhanced the cardiac ejection fraction, fractional shortening of the heart, and cardiac output in FD mice (Figure 5B). These results indicate that fasudil administration improves the defective cardiac functionality of FD mice. We also examined the effect of fasudil on other FD phenotypes, including anhidrosis and heat insensitivity. Compared with WT mice, FD mice showed a reduced number of sweat spots and an increased paw withdrawal latency in a heat tolerance test, and the fasudil administration significantly improved the anhidrosis and heat sensitivity in FD mice, respectively (Figures 5C and 5D). Overall, these findings suggest that in vivo administration of fasudil alleviates several FD clinical phenotypes in FD mice, including LVH, anhidrosis, and heat insensitivity.
Figure 5.

Fasudil alleviates FD phenotypes in FD mice after oral administration
(A) Schematic overview of the treatment of FD mice (Gla−/−/TSP1Tg) with fasudil (10 or 30 mg/kg/day for 6 months). As a control, FD mice were administered PBS. (B) Echocardiography analysis of WT mice (n = 6) and FD mice treated with PBS (n = 4) or fasudil at 10 or 30 mg/kg (n = 9). The left ventricular mass/body weight ratio, ejection fraction, fractional shortening, and cardiac output were measured. Data are represented as mean ± SEM; ∗p < 0.05, ∗∗p < 0.01, and ∗∗∗p < 0.001 (Student’s t test). (C) Analysis of sweat secretion by WT mice and FD mice treated with or without fasudil. Data are represented as mean ± SEM (n = 3); ∗p < 0.05 (Student’s t test). (D) Heat tolerance analysis of WT mice and FD mice treated with or without fasudil. Increased latency of paw withdrawal indicates hyposensitivity to thermal pain. Data are represented as mean ± SEM (n = 5); ∗p < 0.05 (Student’s t test).
Fasudil alleviates fibrosis and inflammation in the renal tissues of FD mice
Another major symptom of FD patients is renal fibrosis by which eventually leads to renal failure.19 In general, fibrosis occurs via EndMT along with inflammation in VECs of various tissues.18 Before the chemical administration, we investigated the fibrosis and inflammation in renal tissues of WT, Gla−/−, TSP1Tg, and FD mice at 12 months old, respectively. As results, expression of EndMT (ACTA2 and COL1A1) and inflammation markers (LCN2 and F4/80) was significantly elevated in the renal tissues of Gla−/− mice and FD mice compared with WT, respectively (Figure S6A). In addition, Gla−/−, TSP1Tg, and FD mice showed a higher TSP1 expression in renal tissues than WT mice, and the level of p-SMAD2 increased only in TSP1Tg and FD mice. Similarly, EndMT and inflammation markers were highly expressed in renal tissues of 6-month-old FD mice compared with WT and Gla−/− mice (Figure S6B). Collectively, the results indicate that FD mice exhibit renal FD phenotypes including fibrosis and inflammation. Next, we tested the effects of Fausdil on the expression of fibrosis and inflammation related genes in FD mice (Figure 6A). An immunohistochemical analysis revealed that CD31+ACTA2+ cells reduced in FD mice after administration of fasudil (Figure 6B). In addition, fasudil administration downregulated the expression of COL1A1 in renal tissues of FD mice (Figure 6C). The expression levels of LCN2 and F4/80 were also reduced by fasudil administration (Figure 6D). These findings were confirmed by western blot analysis of renal tissues from FD mice treated with and without fasudil (Figure 6E). Together, our findings show that fasudil can successfully reduce renal fibrosis and inflammation in FD mice, indicating that its application for treating human FD patients should be investigated.
Figure 6.

Fasudil alleviates fibrosis and inflammation in the renal tissues of FD mice
(A) Schematic overview of the treatment of FD mice (Gla−/−/TSP1Tg) with fasudil (30 mg/kg/day for 6 months). As a control, FD mice were administered PBS. (B) Immunohistochemical analysis of CD31 and ACTA2 in renal tissues from WT mice (n = 3) and FD mice (Gla−/−/TSP1Tg) administered PBS (n = 3) or fasudil (n = 4). Data in the graph are represented as mean ± SEM; ∗∗p < 0.01 (Student’s t test). Scale bar: 100 μm. (C) Immunohistochemical analysis of COL1A1 in renal tissues from WT mice (n = 3) and FD mice (Gla−/−/TSP1Tg) administered PBS (n = 3) or fasudil (n = 4). Data in the graph are represented as mean ± SEM; ∗p < 0.05 (Student’s t test). Scale bar: 100 μm. (D) Immunohistochemical analysis of inflammation-associated markers (LCN2 and F4/80) in renal tissues from WT mice (n = 3) and FD mice (Gla−/−/TSP1Tg) administered PBS (n = 3) or fasudil (n = 4). Data in the graphs are represented as mean ± SEM; ∗p < 0.05 and ∗∗p < 0.01 (Student’s t test). Scale bar: 100 μm. (E) Western blot analysis of fibrosis-related markers (ACTA2 and COL1A1), inflammation markers (LCN2 and F4/80), p-SMAD2, SMAD2, and GAPDH in kidney lysates from FD mice (Gla−/−/TSP1Tg) treated with or without fasudil. Data are represented as mean ± SEM (n = 3); ∗p < 0.05 and ∗∗p < 0.01 (Student’s t test). (F) A schematic illustration for the underlying mechanism of fasudil in FD models.
Discussion
Here, we identified fasudil as a novel compound capable of recovering vasculopathy in FD patients. Treatment of FD-VECs with fasudil reduced the levels of p-SMAD2 and TSP1 and increased the levels of angiogenic factors (KDR and eNOS). In addition, fasudil inactivated TGF-β-induced EndMT via reduction of ROS and maximal respiration in FD-VECs. Finally, oral administration of fasudil reversed several clinical phenotypes of FD in mice, including LVH, anhidrosis, heat insensitivity, and renal fibrosis.
Vasculopathy in a diverse range of tissues, including the brain, heart, and kidney, is a common clinical complication of FD.3 Although recombinant ERT is used widely to treat FD, its therapeutic effect is limited in patients with vascular complications and certain GLA mutational variations.10,11,12,14,15 Therefore, there is a need to develop new therapeutic approaches for FD patients. We reported previously that over-expression of TSP1 and enhanced activation of SMAD2 signaling are responsible for the endothelial dysfunction of FD-VECs.16 Here, we screened a library of clinical compounds to identify those capable of reducing the levels of p-SMAD2 and TSP1, and thereby improving the angiogenic dysfunction of FD-VECs (Figure 1A). Six hit compounds were able to downregulate SMAD2 signaling and TSP1 expression, enhance the expression of angiogenic factors, and recover the tube formation ability of FD-VECs. Thus, we have developed a functional cell-based drug screening platform using disease-specific specialized cells derived from patient iPSCs. This platform will be useful for identifying new drug candidates for other rare disorders.
TGF-β signaling plays a crucial role in the EndMT of VECs17 and is hyperactivated in FD-VECs.16 EndMT induces fibrosis in various tissues,18 which is a key clinical feature of FD19 that renders ERT ineffective.12 Therefore, it is likely that hyperactive TGF-β signaling-induced progressive EndMT is responsible for fibrosis development in FD patients. Furthermore, Gb3 accumulation reportedly causes mitochondrial dysfunction in FD, including dysregulated ROS generation.21,26 Here, we found that FD-VECs had higher expression levels of EndMT- and fibrosis-associated genes than WT-VECs and FD(c)-VECs (Figures 3A, S3C, and S3D), and fasudil downregulated the expression levels of fibrosis-associated genes (COL1A1, ACTA2, SNAI1, and TWIST) (Figure 3B) and reduced ROS production and maximal respiration (OCR) in FD-VECs (Figures 4B and 4C). Overall, these findings indicate that fasudil rescues the endothelial dysfunction of FD-VECs by regulating EndMT and mitochondrial functionality, highlighting it as a candidate to reduce fibrosis in FD patients.
Currently available animal models of FD do not fully represent the complications of human FD.23,24,27 Given that TSP1 expression is upregulated in renal tissues biopsied from FD patients,16 we hypothesized that transgenic mice expressing human TSP1 (Gla−/−/TSP1Tg [FD mice]) might be an effective model of FD. At 6 months of age, FD mice showed typical clinical phenotypes of FD, including LVH, renal fibrosis, anhidrosis, and heat insensitivity (Figures S5 and S6). Oral administration of fasudil to FD mice improved the defective heart function and anhidrosis, and reduced renal fibrosis, inflammation, and heat insensitivity. Thus, fasudil rescues several clinical phenotypes of FD in vivo.
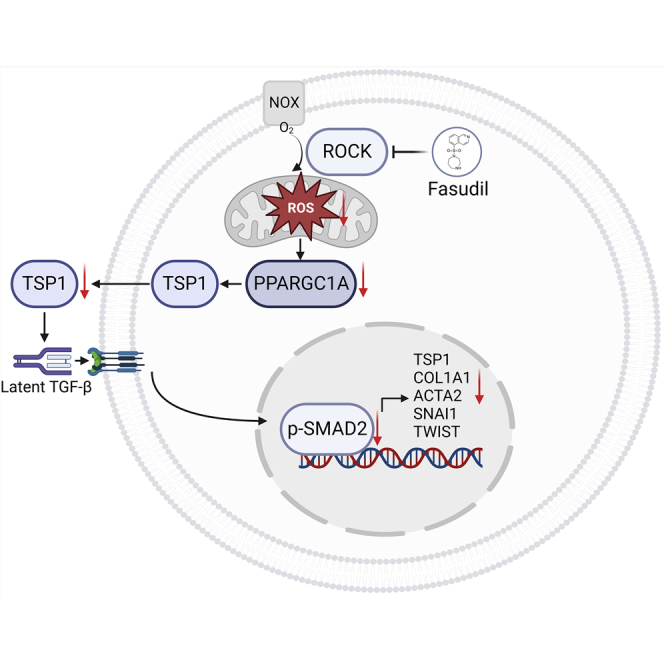
Fasudil is a selective ROCK inhibitor that targets the ATP-dependent kinase domain of ROCK1 and ROCK2.28 ROCK mediates the NADPH oxidase (NOX)-mediated production of ROS in endothelial cells.29 Over-produced ROS by Gb3 accumulation involves with the pathophysiology of FD.30 Increased ROS production reportedly contributes to the vascular endothelial dysfunction, thereby leading to cardiovascular disease and renal fibrosis.31,32 Given that ROCK inhibition is effective on reducing ROS generation in FD, we thought that fasudil administration would improve FD phenotypes, including LVH, anhidrosis, heat insensitivity, and renal fibrosis. In this study, we found that fasudil treatment downregulates overproduction of ROS and expression of ROS-related genes (GSTM1, NCF2, and PPARGC1A) in FD-VECs (Figures 4A and 4B). Because PPARGC1A reportedly upregulates TSP1 expression in VECs,33 it is likely that fasudil treatment reduces TSP1 over-expression and then decreases in a cascade manner the levels of p-SMAD2 and EndMT-associated proteins in FD. In this study, we confirmed therapeutic potentials of fasudil in FD-VECs (in vitro) and FD mice (in vivo). On the basis of our results, we propose a schematic model for action of fasudil in FD models (Figure 6F). In FD models, briefly, inhibition of ROCK by fasudil reduces ROS production, downregulates TSP1 expression, alleviates hyperactivated SMAD2 signaling, and suppresses TGF-β-induced EndMT in a cascade manner, thereby probably leading to improve several FD phenotypes. Nonetheless, agalsidase-β treatment removed Gb3 accumulation in FD-VECs, not but fasudil (Figure S7), which probably results in a partial reduction of maximal respiration in OCR (Figure 4C). When fasudil was co-treated with a recombinant enzyme Fabrazyme, therapeutic effects were significantly enhanced in improvement of FD phenotypes with additive reduction of maximal respiration in FD-VECs (data not shown). Therefore, the combined treatment of fasudil with ERT will be a novel strategy for FD therapy.
In conclusion, we have established a novel cell-based platform for the identification and development of new FD drugs. Remarkably, fasudil was able to improve several FD symptoms in vitro and in vivo, including vascular endothelial function, LVH, anhidrosis, heat insensitivity, and renal fibrosis. In humans, fasudil has been used as a drug for cerebral vasospasm and brain ischemia.34 And phase 2 clinical trials of fasudil have been completed in vascular diseases (Raynaud’s phenomenon (NCT00498615), cardiovascular heart disease (NCT03404843), and atherosclerosis (NCT00120718)) (https://clinicaltrials.gov/ct2/home). Thus, fasudil appears to have a good safety profile. Here we suggest that fasudil is a potent candidate for treatment of FD patients.
Materials and methods
Generation and maintenance of FD-iPSCs
We used FD-iPSC lines that were generated from fibroblasts of three FD patients with a GLA variant (Table S1).16 A wild-type (WT) iPSC line derived from foreskin fibroblasts and a FD1 isogenic iPSC line were used as controls.35,36 All experiments using FD-iPSCs were approved by the institutional review board of the Korea Advanced Institute of Science and Technology (KAIST; KH2016-52). Human iPSCs (hiPSCs) were maintained in mTeSR1 medium (STEMCELL Technologies, Vancouver, BC, Canada) on culture plates precoated with Corning Matrigel hESC-Qualified Matrix. The cells were maintained at 37°C in a 5% CO2 incubator. After 7 days of culture, hiPSC colonies were split at a 1:50 ratio using Accutase solution (eBioscience, San Diego, CA) and incubated in the same culture conditions for expansion.
Differentiation of FD-iPSCs into VECs
Human iPSCs were differentiated into VECs as described previously, with further optimization.37,38 Briefly, hiPSCs were transferred to dishes coated with Matrigel (BD Biosciences, Franklin Lakes, NJ) and cultured for 2 days in mTESR1 medium (STEMCELL Technologies) at 37°C and 5% CO2. Subsequently, the cells were cultured for a further 2 days in VEC medium (RPMI [HyClone, Logan, MI], 1% B27 [Invitrogen, Carlsbad, CA], and penicillin/streptomycin [Invitrogen]) supplemented with 50 ng/mL Activin A (PeproTech, Rocky Hill, NJ) and 20 ng/mL BMP4 (PeproTech), at 37°C and 5% CO2. Next, the cells were cultured for 3 days in VEC medium containing 50 ng/mL VEGF-A (PeproTech) and 50 ng/mL bFGF, at 37°C and 5% CO2. To differentiate the vascular progenitors into VECs, CD31+ cells were sorted from the differentiated cells by MACS using CD31+ Dynabeads (Thermo Fisher Scientific, Waltham, MA). The CD31+ cells were transferred to gelatin-coated plates and incubated for 3 days in EGM-2 medium (Lonza, Basel, Switzerland) supplemented with 100 ng/mL VEGF-A and 50 ng/mL bFGF, at 37°C and 5% CO2. The culture medium was changed daily. Finally, the vascular progenitors were cultured in EGM-2 medium without growth factors for 4 days with daily medium change.
Screening of clinical compounds using FD-VECs
To screen for clinical compounds that could rescue FD-VEC dysfunction, VECs were seeded onto gelatin-coated 96-well plates (SPL Life Sciences, Pocheon, Korea) at a density of 3 × 10³ cells/cm2 and maintained in EGM-2 medium without growth factors for 24 h. FD-VECs were treated with each compound (5 μM) for 24 h, and chemical compounds that did not affect cell viability or morphology were selected. Subsequently, we examined whether FD-VECs treated with each selected compound could form tube-like structures on Matrigel-coated plates. The tube-like structure forming assay was repeated at least three times using different concentrations of each selected compound (0.5, 1, and 5 μM).
Tube-like structure assay
FD-VECs were dissociated after treatment with Accutase at 37°C for 5 min. Dissociated cells (1 × 10⁴) were transferred to Matrigel matrix in EGM-2 medium supplemented with 100 ng/mL VEGF-A, and then incubated at 37°C and 5% CO2 for 24 h. Images of the vascular tube-like structures were taken using an inverted microscope (Olympus, Tokyo, Japan). Total tube lengths were measured using ImageJ software, which was freely provided by the National Institute of Mental Health (NIMH; Bethesda, MD), and its Angiogenesis Analyzer plugin.39
Western blotting
Western blotting was performed as described previously.40 Cells were lysed in RIPA buffer (GenDEPOT, Katy, TX) supplemented with protease and phosphatase inhibitor cocktail (GenDEPOT) via gentle agitation at 4°C for 2 h. Tissue samples were homogenized in the same lysis buffer using a Dounce Tissue Grinder (Wheaton, Millville, NJ) with gentle agitation at 4°C for 2 h. For both cells and tissues, the supernatant was collected after the samples were centrifuged at 16,000 × g for 15 min, and the protein concentration was measured using a Bradford protein assay (Bio-Rad, Hercules, CA). Lysates were denatured in SDS-PAGE buffer at 95°C for 5 min, and then separated on a 12% SDS-PAGE gel and transferred to a nitrocellulose membrane (Whatman, Maidstone, United Kingdom). After blocking in TBST buffer containing 5% BSA for 1 h, membranes were incubated with the primary antibodies (Table S2) at 4°C overnight. Subsequently, the membranes were washed with TBST and then incubated with a horseradish peroxidase-conjugated secondary antibody (Cell Signaling Technology, Beverly, MA) at room temperature (RT) for 1 h. After washing with TBST, protein bands were developed using ECL reagent (Merck Millipore, Billerica, MA) and detected using a LAS-4000 Mini biomolecular imager (Fuji Film, Tokyo, Japan). The intensity of each band was measured using ImageJ software.
Immunostaining
After fixation in 10% formalin solution (Sigma-Aldrich, St. Louis, MO) at 4°C for 30 min, cells were washed three times with phosphate-buffered saline (PBS) containing 0.1% Tween 20 (PBST) and then permeabilized in PBS containing 0.1% Triton X-100 (Sigma-Aldrich) for 20 min. Next, the cells were blocked with 2% BSA for 1 h and then incubated with each primary antibody at 4°C overnight. After washing with PBST, samples were incubated with secondary antibodies (Alexa Fluor 488, 594, 647; Abcam, Cambridge, MA) at RT for 1 h. For nucleus staining, samples were incubated with 4′-6-diamidino-2-phenylindole (DAPI; Sigma-Aldrich) and observed on a fluorescence microscope (Olympus) or a Zeiss LSM 800 confocal microscope (Carl Zeiss). The primary antibodies used are listed in Table S3.
Immunohistochemistry
Mice were anesthetized via intraperitoneal (i.p.) injection of avertin (0.2 g/mL; Sigma-Aldrich) and then perfused with Dulbecco’s PBS (DPBS) followed by 4% paraformaldehyde (PFA; Wako, Richmond, VA). The isolated kidneys were postfixed in 4% PFA at 4°C overnight and then transferred to DPBS 30% sucrose (Sigma-Aldrich) and incubated at 4°C overnight. To prepare frozen sections, tissues were embedded in Optimal Cutting Temperature compound (Leica Biosystems, Wetzlar, Germany) and frozen at −20°C for 3 h. The frozen tissues were sectioned at 20 μm using a cryostat (Leica Biosystems). For immunofluorescence staining, the frozen sections were permeabilized with blocking buffer (PBS containing 5% normal donkey serum [Jackson ImmunoResearch, West Grove, PA] and 1% Triton X-100 [Sigma-Aldrich]) at RT for 1 h and then incubated with the primary antibodies at 4°C overnight. After washing with PBS six times, the samples were incubated with the secondary antibodies and DAPI at RT for 1 h. The washing steps were then repeated, and the samples were mounted using fluorescent mounting medium (Dako) and a cover glass, and analyzed using a Zeiss LSM 980 confocal microscope (Carl Zeiss). The primary antibodies used are listed in Table S3. All images were measured above threshold and normalized to the cell area using ImageJ software. For colocalization analysis of the number of CD31+ACTA2+ cells, the Distance Analysis (DiAna) plugin was used as reported previously.41
Measurement of ROS in VECs
ROS detection was performed using CellROX Green Reagent (Invitrogen), according to the manufacturer’s protocol. Briefly, VECs (3 × 10⁴ cells/well) were plated in 24-well glass-bottomed plates and preincubated in EGM-2 medium supplemented with a clinical compound for 24 h at 37°C and 5% CO2. Subsequently, the cells were incubated with 5 μM CellROX Green Reagent for 3 h, washed with PBS three times, and then fixed in 10% formalin solution for 30 min. The fluorescence intensity of ROS was measured using a TECAN Spark microplate reader (TECAN, Männedorf, Switzerland) and then normalized via DAPI staining.
Measurement of the oxygen consumption rate in VECs
The oxygen consumption rate of VECs was measured using a XF96 Extracellular Flux Analyzer and the XF Cell Mito Stress Test Kit (Agilent Technologies, Santa Clara, CA), following the manufacturer’s protocol. Briefly, VECs were seeded into XF 96-well culture plates at a density of 1.5 × 10⁴ cells/well and incubated in EGM-2 medium containing fasudil (5 μM) for 24 h. For 1 h prior to the measurement, the cells were preincubated with XF DMEM media (pH 7.4) containing 10 mM glucose, 1 mM pyruvate, and 2 mM glutamine. After sequential treatment with 3 μM oligomycin, 1 μM FCCP, and 1.5 μM rotenone/antimycin A, the OCR was determined and then normalized via a BCA assay (Thermo Fisher Scientific).
Processing of RNA sequencing data
The FastQC software (version 0.11.7) was used to check the quality of paired-end sequencing reads (151 bp) generated using an Illumina instrument. Before starting the analysis, the Trimmomatic program (version 0.38) was used to remove adapter sequences and bases with base quality lower than 3 from the ends of the reads.42 A sliding window trim method was also used to remove bases that did not meet the following criteria: window size = 4 and mean quality = 15. Reads with a minimum length of 36 bp were also deleted. The cleaned reads were aligned to the human genome (GRCh38) using HISAT version 2.1.0.43 Transcript assembly was then performed with the aligned reads using StringTie version 2.1.3b, on the basis of reference gene annotation.44,45 To generate normalized metrics for expression levels considering the transcript length and depth of coverage, gene/transcript-level expression was quantified as the read count, and normalized values such as FPKM (fragments per kilobase of exon per million fragments mapped) and TPM (transcripts per kilobase of transcript per million mapped reads) were generated.
Analysis of differentially expressed genes
The HISAT-StringTie pipeline expression profile was used to examine genes that were differentially expressed between samples. Genes with one more than zero read count values in the samples were excluded through the data preprocessing step. To facilitate the comparison of samples without bias, size factors and gene-wise variations were estimated from the read count data, which was normalized using the Relative Log Expression (RLE) method in the DESeq2 R library. The statistical significance of the differential expression data was determined using DESeq2 nbinom WaldTest46 with the normalized count. The false discovery rate (FDR) was controlled by adjusting the p value using the Benjamini-Hochberg algorithm. For differentially expressed genes (DEGs) with fold change ≥ |1.5| and raw p < 0.05, hierarchical clustering analysis was performed using the complete linkage method and Euclidean distance as a measure of similarity. Gene-enrichment analysis was tested based on biologically and functionally known gene sets, such as Gene Ontology with DAVID Bioinformatics Resources.47,48 All data analysis and visualization of DEGs were conducted using R version 3.6.1 (www.r-project.org).
Real-time qPCR
Total RNA was extracted using the RNeasy Kit (Qiagen, Hilden, Germany), and 1 μg was reverse transcribed using a cDNA synthesis kit (Solgent, Daejeon, Korea) according to the manufacturer’s protocol. Real-time qPCR was performed using SYBR Green Real-time PCR Master Mix (Toyobo, Osaka, Japan). qPCR was conducted on a CFX-Connect Real-Time System (Bio-Rad) with 40 cycles of denaturation at 95°C, annealing at 60°C, and elongation at 72°C. The transcription level of GAPDH was used to normalize the expression of the target genes. The difference between the GAPDH threshold cycle (Ct) and the target Ct was calculated as the ΔCt value. Fold changes in mRNA expression levels between samples and controls were determined using the following formula: 2-(SΔCt-CΔCt). The primers used are listed in Table S4.
Generation of FD mice
All experimental procedures involving mice were reviewed and approved by the Institutional Animal Care and Use Committee (IACUC) in Daegu-Gyeongbuk Medical Innovation Foundation (approval number DGMIF-21021602-00) and were conducted in guidelines established by Association for Assessment and Accreditation of Laboratory Animal Care (AAALAC). Gla knockout (Gla−/−) mice were generated using CRISPR/Cas9 system. Single-guided RNA (sgRNA) was designed using CRISPR RGEN tool (http://rgenome.net) and targeted exon 1 of Gla gene including (5′-CGCGGACTCCTACTATGGGCTGG-3′). Cas9 and sgRNA complexes were co-injected into fertilized egg and then the eggs were transferred to recipients. Founder mice were screened for the presence of Gla−/− by sequencing the PCR products amplified using the following primers: Gla-sense (5′-GCCTGAGAAACGATGATGTC) and Gla-antisense (5′-CCAGTGAGGTAGAGATAGAG). Of three Gla−/− mice we obtained, F0-1 mouse was mated with wild-type C57BL/6 mice to obtain heterozygous Gla mice (Figure S5A). These mice were then mated for at least three generations to obtain Gla−/− and wild-type mice. The GLA activity in organs of WT and Gla−/− mice was measured using Alpha Galactosidase Activity Assay Kit (Abcam), depending on the manufacture’s protocol (Figure S5B). Expression of human TSP1 (hTSP1) transgene was driven by the ubiquitous CAG promoter, which consist of a CMV enhancer element with a chicken β-actin promoter (Figure S5C). The 6.2 kb linear DNA fragment containing the CAG promoter and hTSP1 and polyA adenylation signal was excised from the agarose gel, purified, and verified by DNA sequencing. Pronuclear injection was performed with constructed hTSP1 DNA. Several pups were obtained and screened for checking the presence of TSP1Tg by the PCR products amplified using the following primers: TSP1Tg-sense (5′-CGAGCTCTCGAATTCAAAGG-3′) and TSP1Tg-antisense (5′-CTGTCTTCCTGCACAAACAG-3′). One line of these was expanded for phenotypic analysis. Gla−/− mice were crossed with TSP1Tg mice to establish Gla−/−/TSP1Tg (FD) mice. All mouse lines were maintained on the C57BL/6 background. For all experiments in this study, male mice were only used. The mice were orally administered with fasudil (10 or 30 mg/kg/day) dissolved in PBS (Sigma-Aldrich) for 6 months.
Measurement of anhidrosis
Mice were anesthetized for a sweat secretion assay. The right hind paw was painted with an iodine solution (2% in EtOH; Sigma-Aldrich). Once dried, the paw surface was covered with a starch suspension (0.5 g/mL in mineral oil; Sigma-Aldrich).49 Sweating was stimulated by intraperitoneal injection of pilocarpine hydrochloride (2 mg/kg body weight). After 5 min, images of the paws were taken, and black dots were counted as functional sweat gland pores. The ImageJ software was used to count the numbers and calculate the areas of black dots on the paws.50,51
Measurement of peripheral sensory function using the hot-plate test
A nociceptive response to a heat stimulus was measured as referred previously reports.52,53 Mice were individually placed on a 55°C surface and the time taken to respond with a characteristic hind paw shake was recorded as the latency. If no response was evident by 60 s, the mouse was removed to prevent injury.
Echocardiography
Echocardiographic measurements were performed using Vevo 3100 Imaging System coupled to a 30 MHz linear-frequency transducer (FUJIFILM VisualSonics). According to previously reported protocol,54,55 mice were anesthetized with isoflurane (JSK), fixed in a supine position. To obtain constant heart rates, isoflurane concentrations were reduced to 1%–2%. Next, mice were depilated using hair-removal cream, and pre-warmed ultrasound gel (Parker Laboratories). After mice were then placed on the chest, B- and M-mode images were acquired in parasternal long-axis and short-axis view. Speckle-tracking echocardiography (STE) analysis of the B-mode images was performed in a semiautomatic manner using the VevoStrain software package (FUJIFILM VisualSonics). Determination of cardiac systolic function was performed in a semiautomatic manner from the respective B-mode images (long-axis view) using the monoplane Simpson method of disks. To calculate LV dimensions and LV mass, the acquired M-mode images of the parasternal long-axis view were used. In detail, three independent M-mode images and 3 cardiac cycles were analyzed to determine diastolic function, diastolic wall strain (DWS), as referred to previously reports.55,56
Statistical analysis
With the exception of outliers, all data generated in the experiments were analyzed. Outliers were identified using a statistical test (ROUT) using Prism 7 (GraphPad Software, La Jolla, CA). Each experiment was repeated at least three times. Data are represented as mean ± SEM. Statistical significance was evaluated using a two-tailed Student’s t test in Prism 7 (∗p < 0.05, ∗∗p < 0.01, and ∗∗∗p < 0.001).
Data availability
The data supporting the findings of this study are available from the corresponding author upon reasonable request.
Acknowledgments
We thank Dr. Sang-Hyun Min for useful discussions. We also thank the KAIST Analysis Center for Research Advancement (KARA) for confocal microscope. The chemical library used in this study was kindly provided by Korea Chemical Bank (www.chembank.org) of Korea Research Institute of Chemical Technology. Illustrations of experimental schemes were created using the BioRender program (http://www.biorender.com). This research was supported by grants (2018M3A9H1078330 and 21C0726L1) from the National Research Foundation (NRF) and the Korean Fund for Regenerative Medicine (KFRM), the Republic of Korea.
Author contributions
J.B.C.: conception, design, data assembly, data analysis (drug screening, immunostaining, western blot, ROS analysis, and immunohistochemistry), interpretation, and manuscript writing. D.-W.S.: conception, design, data assembly, and data analysis (administration, echocardiography, sweat secretion assay, and hot-plate test). H.-S.D.: conception, design, data assembly, and data analysis (drug screening). H.-Y.Y.: conception, design (generation of FD mice). T.-M.K.: data assembly and data analysis (OCR analysis). Y.G.B.: data assembly and data analysis (immunohistochemistry and perfusion). J.-M.P., J.C., and S.P.H.: design and data assembly. W.-S.C., J.M.S., G.Y.K., and B.H.L.: design and interpretation. G.B.W. and Y.-M.H.: management of the project and manuscript writing. All authors agree to the authorship.
Declaration of interests
The authors have declared no competing interests.
Footnotes
Supplemental information can be found online at https://doi.org/10.1016/j.ymthe.2023.02.003.
Contributor Information
Gabbine Wee, Email: gabbine@kmedihub.re.kr.
Yong-Mahn Han, Email: ymhan@kaist.ac.kr.
Supplemental information
References
- 1.Brady R.O., Gal A.E., Bradley R.M., Martensson E., Warshaw A.L., Laster L. Enzymatic defect in Fabry's disease. Ceramidetrihexosidase deficiency. N. Engl. J. Med. 1967;276:1163–1167. doi: 10.1056/nejm196705252762101. [DOI] [PubMed] [Google Scholar]
- 2.Kint J.A. The enzyme defect in Fabry's disease. Nature. 1970;227:1173. doi: 10.1038/2271173b0. [DOI] [PubMed] [Google Scholar]
- 3.Rombach S.M., van den Bogaard B., de Groot E., Groener J.E.M., Poorthuis B.J., Linthorst G.E., van den Born B.J.H., Hollak C.E.M., Aerts J.M.F.G. Vascular aspects of fabry disease in relation to clinical manifestations and elevations in plasma globotriaosylsphingosine. Hypertension. 2012;60:998–1005. doi: 10.1161/HYPERTENSIONAHA.112.195685. [DOI] [PubMed] [Google Scholar]
- 4.Orteu C.H., Jansen T., Lidove O., Jaussaud R., Hughes D.A., Pintos-Morell G., Ramaswami U., Parini R., Sunder-Plassman G., Beck M., Mehta A.B., FOS Investigators Fabry disease and the skin: data from FOS, the Fabry outcome survey. Br. J. Dermatol. 2007;157:331–337. doi: 10.1111/j.1365-2133.2007.08002.x. [DOI] [PubMed] [Google Scholar]
- 5.Schiffmann R., Warnock D.G., Banikazemi M., Bultas J., Linthorst G.E., Packman S., Sorensen S.A., Wilcox W.R., Desnick R.J. Fabry disease: progression of nephropathy, and prevalence of cardiac and cerebrovascular events before enzyme replacement therapy. Nephrol. Dial. Transpl. 2009;24:2102–2111. doi: 10.1093/ndt/gfp031. [DOI] [PMC free article] [PubMed] [Google Scholar]
- 6.Mehta A., Ricci R., Widmer U., Dehout F., Garcia de Lorenzo A., Kampmann C., Linhart A., Sunder-Plassmann G., Ries M., Beck M. Fabry disease defined: baseline clinical manifestations of 366 patients in the Fabry Outcome Survey. Eur. J. Clin. Invest. 2004;34:236–242. doi: 10.1111/j.1365-2362.2004.01309.x. [DOI] [PubMed] [Google Scholar]
- 7.Rombach S.M., Twickler T.B., Aerts J.M.F.G., Linthorst G.E., Wijburg F.A., Hollak C.E.M. Vasculopathy in patients with Fabry disease: current controversies and research directions. Mol. Genet. Metab. 2010;99:99–108. doi: 10.1016/j.ymgme.2009.10.004. [DOI] [PubMed] [Google Scholar]
- 8.Eng C.M., Guffon N., Wilcox W.R., Germain D.P., Lee P., Waldek S., Caplan L., Linthorst G.E., Desnick R.J., International Collaborative Fabry Disease Study Group Safety and efficacy of recombinant human α-galactosidase a replacement therapy in Fabry's disease. N. Engl. J. Med. 2001;345:9–16. doi: 10.1056/NEJM200107053450102. [DOI] [PubMed] [Google Scholar]
- 9.Schiffmann R., Kopp J.B., Austin H.A., Sabnis S., Moore D.F., Weibel T., Balow J.E., Brady R.O. Enzyme replacement therapy in fabry disease a randomized controlled trial. J. Am. Med. Assoc. 2001;285:2743–2749. doi: 10.1001/jama.285.21.2743. [DOI] [PubMed] [Google Scholar]
- 10.Wilcox W.R., Banikazemi M., Guffon N., Waldek S., Lee P., Linthorst G.E., Desnick R.J., Germain D.P., International Fabry Disease Study Group Long-term safety and efficacy of enzyme replacement therapyfor fabry disease. Am. J. Hum. Genet. 2004;75:65–74. doi: 10.1086/422366. [DOI] [PMC free article] [PubMed] [Google Scholar]
- 11.Weidemann F., Niemann M., Breunig F., Herrmann S., Beer M., Störk S., Voelker W., Ertl G., Wanner C., Strotmann J. Long-term effects of enzyme replacement therapy on Fabry cardiomyopathy: evidence for a better outcome with early treatment. Circulation. 2009;119:524–529. doi: 10.1161/CIRCULATIONAHA.108.794529. [DOI] [PubMed] [Google Scholar]
- 12.Germain D.P., Waldek S., Banikazemi M., Bushinsky D.A., Charrow J., Desnick R.J., Lee P., Loew T., Vedder A.C., Abichandani R., et al. Sustained, long-term renal stabilization after 54 months of agalsidase beta therapy in patients with Fabry disease. J. Am. Soc. Nephrol. 2007;18:1547–1557. doi: 10.1681/asn.2006080816. [DOI] [PubMed] [Google Scholar]
- 13.Lenders M., Brand E. Fabry Disease: The Current Treatment Landscape. Drugs. 2021;81:635–645. doi: 10.1007/s40265-021-01486-1. [DOI] [PMC free article] [PubMed] [Google Scholar]
- 14.Young-Gqamana B., Brignol N., Chang H.H., Khanna R., Soska R., Fuller M., Sitaraman S.A., Germain D.P., Giugliani R., Hughes D.A., et al. Migalastat HCl reduces globotriaosylsphingosine (lyso-Gb3) in Fabry transgenic mice and in the plasma of Fabry patients. PLoS One. 2013;8 doi: 10.1371/journal.pone.0057631. [DOI] [PMC free article] [PubMed] [Google Scholar]
- 15.Germain D.P., Giugliani R., Hughes D.A., Mehta A., Nicholls K., Barisoni L., Jennette C.J., Bragat A., Castelli J., Sitaraman S., et al. Safety and pharmacodynamic effects of a pharmacological chaperone on α-galactosidase A activity and globotriaosylceramide clearance in Fabry disease: report from two phase 2 clinical studies. Orphanet J. Rare Dis. 2012;7:91. doi: 10.1186/1750-1172-7-91. [DOI] [PMC free article] [PubMed] [Google Scholar]
- 16.Do H.S., Park S.W., Im I., Seo D., Yoo H.W., Go H., Kim Y.H., Koh G.Y., Lee B.H., Han Y.M. Enhanced thrombospondin-1 causes dysfunction of vascular endothelial cells derived from Fabry disease-induced pluripotent stem cells. EBioMedicine. 2020;52 doi: 10.1016/j.ebiom.2020.102633. [DOI] [PMC free article] [PubMed] [Google Scholar]
- 17.Cooley B.C., Nevado J., Mellad J., Yang D., St Hilaire C., Negro A., Fang F., Chen G., San H., Walts A.D., et al. TGF-β signaling mediates endothelial-to-mesenchymal transition (EndMT) during vein graft remodeling. Sci. Transl. Med. 2014;6:227ra34. doi: 10.1126/scitranslmed.3006927. [DOI] [PMC free article] [PubMed] [Google Scholar]
- 18.Ma J., Sanchez-Duffhues G., Goumans M.-J., ten Dijke P. TGF-β-Induced endothelial to mesenchymal transition in disease and tissue engineering. Front. Cell Dev. Biol. 2020;8:260. doi: 10.3389/fcell.2020.00260. [DOI] [PMC free article] [PubMed] [Google Scholar]
- 19.Weidemann F., Sanchez-Niño M.D., Politei J., Oliveira J.-P., Wanner C., Warnock D.G., Ortiz A. Fibrosis: a key feature of Fabry disease with potential therapeutic implications. Orphanet J. Rare Dis. 2013;8:116. doi: 10.1186/1750-1172-8-116. [DOI] [PMC free article] [PubMed] [Google Scholar]
- 20.Pardali E., Sanchez-Duffhues G., Gomez-Puerto M.C., Ten Dijke P. TGF-β-Induced endothelial-mesenchymal transition in fibrotic diseases. Int. J. Mol. Sci. 2017;18 doi: 10.3390/ijms18102157. [DOI] [PMC free article] [PubMed] [Google Scholar]
- 21.Tseng W.L., Chou S.J., Chiang H.C., Wang M.L., Chien C.S., Chen K.H., Leu H.B., Wang C.Y., Chang Y.L., Liu Y.Y., et al. Imbalanced production of reactive oxygen species and mitochondrial antioxidant SOD2 in fabry disease-specific human induced pluripotent stem cell-differentiated vascular endothelial cells. Cell Transpl. 2017;26:513–527. doi: 10.3727/096368916x694265. [DOI] [PMC free article] [PubMed] [Google Scholar]
- 22.Ohshima T., Schiffmann R., Murray G.J., Kopp J., Quirk J.M., Stahl S., Chan C.-C., Zerfas P., Tao-Cheng J.-H., Ward J.M., et al. Aging accentuates and bone marrow transplantation ameliorates metabolic defects in Fabry disease mice. Proc. Natl. Acad. Sci. USA. 1999;96:6423–6427. doi: 10.1073/pnas.96.11.6423. [DOI] [PMC free article] [PubMed] [Google Scholar]
- 23.Taguchi A., Maruyama H., Nameta M., Yamamoto T., Matsuda J., Kulkarni A.B., Yoshioka H., Ishii S. A symptomatic Fabry disease mouse model generated by inducing globotriaosylceramide synthesis. Biochem. J. 2013;456:373–383. doi: 10.1042/BJ20130825. [DOI] [PMC free article] [PubMed] [Google Scholar]
- 24.Miller J.J., Aoki K., Mascari C.A., Beltrame A.K., Sokumbi O., North P.E., Tiemeyer M., Kriegel A.J., Dahms N.M. α-Galactosidase A-deficient rats accumulate glycosphingolipids and develop cardiorenal phenotypes of Fabry disease. FASEB J. 2019;33:418–429. doi: 10.1096/fj.201800771R. [DOI] [PMC free article] [PubMed] [Google Scholar]
- 25.Kampmann C., Linhart A., Baehner F., Palecek T., Wiethoff C.M., Miebach E., Whybra C., Gal A., Bultas J., Beck M. Onset and progression of the Anderson-Fabry disease related cardiomyopathy. Int. J. Cardiol. 2008;130:367–373. doi: 10.1016/j.ijcard.2008.03.007. [DOI] [PubMed] [Google Scholar]
- 26.Stepien K.M., Roncaroli F., Turton N., Hendriksz C.J., Roberts M., Heaton R.A., Hargreaves I. Mechanisms of mitochondrial dysfunction in lysosomal storage disorders: a review. J. Clin. Med. 2020;9 doi: 10.3390/jcm9082596. [DOI] [PMC free article] [PubMed] [Google Scholar]
- 27.Ohshima T., Murray G.J., Swaim W.D., Longenecker G., Quirk J.M., Cardarelli C.O., Sugimoto Y., Pastan I., Gottesman M.M., Brady R.O., Kulkarni A.B. α-Galactosidase A deficient mice: a model of Fabry disease. Proc. Natl. Acad. Sci. USA. 1997;94:2540–2544. doi: 10.1073/pnas.94.6.2540. [DOI] [PMC free article] [PubMed] [Google Scholar]
- 28.Wei L., Surma M., Shi S., Lambert-Cheatham N., Shi J. Novel insights into the roles of rho kinase in cancer. Arch. Immunol. Ther. Exp. 2016;64:259–278. doi: 10.1007/s00005-015-0382-6. [DOI] [PMC free article] [PubMed] [Google Scholar]
- 29.Higashi M., Shimokawa H., Hattori T., Hiroki J., Mukai Y., Morikawa K., Ichiki T., Takahashi S., Takeshita A. Long-Term inhibition of rho-kinase suppresses angiotensin II–induced cardiovascular hypertrophy in rats in vivo. Circ. Res. 2003;93:767–775. doi: 10.1161/01.RES.0000096650.91688.28. [DOI] [PubMed] [Google Scholar]
- 30.Ravarotto V., Carraro G., Pagnin E., Bertoldi G., Simioni F., Maiolino G., Martinato M., Landini L., Davis P.A., Calò L.A. Oxidative stress and the altered reaction to it in Fabry disease: a possible target for cardiovascular-renal remodeling? PLoS One. 2018;13 doi: 10.1371/journal.pone.0204618. [DOI] [PMC free article] [PubMed] [Google Scholar]
- 31.Li J.-M., Shah A.M. Endothelial cell superoxide generation: regulation and relevance for cardiovascular pathophysiology. Am. J. Physiol. Regul. Integr. Comp. Physiol. 2004;287:R1014–R1030. doi: 10.1152/ajpregu.00124. [DOI] [PubMed] [Google Scholar]
- 32.Lv W., Booz G.W., Fan F., Wang Y., Roman R.J. Oxidative stress and renal fibrosis: recent insights for the development of novel therapeutic strategies. Front. Physiol. 2018;9:105. doi: 10.3389/fphys.2018.00105. [DOI] [PMC free article] [PubMed] [Google Scholar]
- 33.Sawada N., Jiang A., Takizawa F., Safdar A., Manika A., Tesmenitsky Y., Kang K.T., Bischoff J., Kalwa H., Sartoretto J.L., et al. Endothelial PGC-1α mediates vascular dysfunction in diabetes. Cell Metab. 2014;19:246–258. doi: 10.1016/j.cmet.2013.12.014. [DOI] [PMC free article] [PubMed] [Google Scholar]
- 34.Tanaka K., Minami H., Kota M., Kuwamura K., Kohmura E. Treatment of cerebral vasospasm with intra-arterial fasudil hydrochloride. Neurosurgery. 2005;56:214–223. doi: 10.1227/01.neu.0000147975.24556.bc. discussion 214-223. [DOI] [PubMed] [Google Scholar]
- 35.Kim D., Choi J., Han K.M., Lee B.H., Choi J.H., Yoo H.W., Han Y.M. Impaired osteogenesis in Menkes disease-derived induced pluripotent stem cells. Stem Cell Res. Ther. 2015;6:160. doi: 10.1186/s13287-015-0147-5. [DOI] [PMC free article] [PubMed] [Google Scholar]
- 36.Choi J.B., Seo D., Do H.-S., Han Y.-M. Generation of a CRISPR/Cas9-corrected-hiPSC line (DDLABi001-A) from Fabry disease (FD)-derived iPSCs having α-galactosidase (GLA) gene mutation (c.803_806del) Stem Cell Res. 2023;66 doi: 10.1016/j.scr.2022.103001. [DOI] [PubMed] [Google Scholar]
- 37.Park S.W., Jun Koh Y., Jeon J., Cho Y.H., Jang M.J., Kang Y., Kim M.J., Choi C., Sook Cho Y., Chung H.M., et al. Efficient differentiation of human pluripotent stem cells into functional CD34+ progenitor cells by combined modulation of the MEK/ERK and BMP4 signaling pathways. Blood. 2010;116:5762–5772. doi: 10.1182/blood-2010-04-280719. [DOI] [PubMed] [Google Scholar]
- 38.Orlova V.V., van den Hil F.E., Petrus-Reurer S., Drabsch Y., Ten Dijke P., Mummery C.L. Generation, expansion and functional analysis of endothelial cells and pericytes derived from human pluripotent stem cells. Nat. Protoc. 2014;9:1514–1531. doi: 10.1038/nprot.2014.102. [DOI] [PubMed] [Google Scholar]
- 39.Carpentier G. Contribution: angiogenesis analyzer. ImageJ News. 2012;5:2012. [Google Scholar]
- 40.Choi J.B., Lee J., Kang M., Kim B., Ju Y., Do H.S., Yoo H.W., Lee B.H., Han Y.M. Dysregulated ECM remodeling proteins lead to aberrant osteogenesis of Costello syndrome iPSCs. Stem Cell Rep. 2021;16:1985–1998. doi: 10.1016/j.stemcr.2021.06.007. [DOI] [PMC free article] [PubMed] [Google Scholar]
- 41.Gilles J.F., Dos Santos M., Boudier T., Bolte S., Heck N. DiAna, an ImageJ tool for object-based 3D co-localization and distance analysis. Methods (San Diego, Calif.) 2017;115:55–64. doi: 10.1016/j.ymeth.2016.11.016. [DOI] [PubMed] [Google Scholar]
- 42.Bolger A.M., Lohse M., Usadel B. Trimmomatic: a flexible trimmer for Illumina sequence data. Bioinformatics (Oxford, England) 2014;30:2114–2120. doi: 10.1093/bioinformatics/btu170. [DOI] [PMC free article] [PubMed] [Google Scholar]
- 43.Kim D., Langmead B., Salzberg S.L. HISAT: a fast spliced aligner with low memory requirements. Nat. Methods. 2015;12:357–360. doi: 10.1038/nmeth.3317. [DOI] [PMC free article] [PubMed] [Google Scholar]
- 44.Pertea M., Pertea G.M., Antonescu C.M., Chang T.-C., Mendell J.T., Salzberg S.L. StringTie enables improved reconstruction of a transcriptome from RNA-seq reads. Nat. Biotechnol. 2015;33:290–295. doi: 10.1038/nbt.3122. [DOI] [PMC free article] [PubMed] [Google Scholar]
- 45.Pertea M., Kim D., Pertea G.M., Leek J.T., Salzberg S.L. Transcript-level expression analysis of RNA-seq experiments with HISAT, StringTie and Ballgown. Nat. Protoc. 2016;11:1650–1667. doi: 10.1038/nprot.2016.095. [DOI] [PMC free article] [PubMed] [Google Scholar]
- 46.Love M.I., Huber W., Anders S. Moderated estimation of fold change and dispersion for RNA-seq data with DESeq2. Genome Biol. 2014;15:550. doi: 10.1186/s13059-014-0550-8. [DOI] [PMC free article] [PubMed] [Google Scholar]
- 47.Huang D.W., Sherman B.T., Lempicki R.A. Systematic and integrative analysis of large gene lists using DAVID bioinformatics resources. Nat. Protoc. 2009;4:44–57. doi: 10.1038/nprot.2008.211. [DOI] [PubMed] [Google Scholar]
- 48.Sherman B.T., Hao M., Qiu J., Jiao X., Baseler M.W., Lane H.C., Imamichi T., Chang W. DAVID: a web server for functional enrichment analysis and functional annotation of gene lists (2021 update) Nucleic Acids Res. 2022;50:W216–W221. doi: 10.1093/nar/gkac194. [DOI] [PMC free article] [PubMed] [Google Scholar]
- 49.Tafari A.T., Thomas S.A., Palmiter R.D. Norepinephrine facilitates the development of the murine sweat response but is not essential. J. Neurosci. 1997;17:4275–4281. doi: 10.1523/jneurosci.17-11-04275.1997. [DOI] [PMC free article] [PubMed] [Google Scholar]
- 50.Gagnon D., Ganio M.S., Lucas R.A.I., Pearson J., Crandall C.G., Kenny G.P. Modified iodine-paper technique for the standardized determination of sweat gland activation. J. Appl. Physiol. 2012;112:1419–1425. doi: 10.1152/japplphysiol.01508.2011. [DOI] [PMC free article] [PubMed] [Google Scholar]
- 51.Grosheva M., Horstmann L., Volk G.F., Holler C., Ludwig L., Weiß V., Finkensieper M., Wittekindt C., Klussmann J.P., Guntinas-Lichius O., Beutner D. Frey's syndrome after superficial parotidectomy: role of the sternocleidomastoid muscle flap: a prospective nonrandomized controlled trial. Am. J. Surg. 2016;212:740–747.e1. doi: 10.1016/j.amjsurg.2016.01.020. [DOI] [PubMed] [Google Scholar]
- 52.Ziegler R.J., Cherry M., Barbon C.M., Li C., Bercury S.D., Armentano D., Desnick R.J., Cheng S.H. Correction of the biochemical and functional deficits in fabry mice following AAV8-mediated hepatic expression of α-galactosidase A. Mol. Ther. 2007;15:492–500. doi: 10.1038/sj.mt.6300066. [DOI] [PubMed] [Google Scholar]
- 53.Marshall J., Ashe K.M., Bangari D., McEachern K., Chuang W.L., Pacheco J., Copeland D.P., Desnick R.J., Shayman J.A., Scheule R.K., Cheng S.H. Substrate reduction augments the efficacy of enzyme therapy in a mouse model of Fabry disease. PLoS One. 2010;5 doi: 10.1371/journal.pone.0015033. [DOI] [PMC free article] [PubMed] [Google Scholar]
- 54.Beyhoff N., Brix S., Betz I.R., Klopfleisch R., Foryst-Ludwig A., Krannich A., Stawowy P., Knebel F., Grune J., Kintscher U. Application of speckle-tracking echocardiography in an experimental model of isolated subendocardial damage. J. Am. Soc. Echocardiography. 2017;30:1239–1250.e2. doi: 10.1016/j.echo.2017.08.006. [DOI] [PubMed] [Google Scholar]
- 55.Pappritz K., Grune J., Klein O., Hegemann N., Dong F., El-Shafeey M., Lin J., Kuebler W.M., Kintscher U., Tschöpe C., Van Linthout S. Speckle-tracking echocardiography combined with imaging mass spectrometry assesses region-dependent alterations. Sci. Rep. 2020;10:3629. doi: 10.1038/s41598-020-60594-2. [DOI] [PMC free article] [PubMed] [Google Scholar]
- 56.Selvaraj S., Aguilar F.G., Martinez E.E., Beussink L., Kim K.Y.A., Peng J., Lee D.C., Patel A., Sha J., Irvin M.R., et al. Diastolic wall strain: a simple marker of abnormal cardiac mechanics. Cardiovasc. Ultrasound. 2014;12:40. doi: 10.1186/1476-7120-12-40. [DOI] [PMC free article] [PubMed] [Google Scholar]
Associated Data
This section collects any data citations, data availability statements, or supplementary materials included in this article.
Supplementary Materials
Data Availability Statement
The data supporting the findings of this study are available from the corresponding author upon reasonable request.