Abstract
Here we introduce the ‘interaction generality’ measure, a new method for computationally assessing the reliability of protein–protein interactions obtained in biological experiments. This measure is basically the number of proteins involved in a given interaction and also adopts the idea that interactions observed in a complicated interaction network are likely to be true positives. Using a group of yeast protein–protein interactions identified in various biological experiments, we show that interactions with low generalities are more likely to be reproducible in other independent assays. We constructed more reliable networks by eliminating interactions whose generalities were above a particular threshold. The rate of interactions with common cellular roles increased from 63% in the unadjusted estimates to 79% in the refined networks. As a result, the rate of cross-talk between proteins with different cellular roles decreased, enabling very clear predictions of the functions of some unknown proteins. The results suggest that the interaction generality measure will make interaction data more useful in all organisms and may yield insights into the biological roles of the proteins studied.
INTRODUCTION
As numerous complete cDNA and whole genome sequences become available (1,2), global analyses of gene and protein functions will become increasingly important. Particularly valuable will be analyses of proteins that play pivotal roles in biological phenomena in which the physiological interactions of many proteins are involved in the construction of biological pathways, such as metabolic and signal transduction pathways. Therefore, identifying reliable protein–protein interactions is perhaps one of the most useful approaches to uncover the function of genes and proteins (3,4).
Several computational methods to predict protein–protein interactions have been proposed (5–12). The results of these approaches may be useful, although the accuracy of the predictions is somewhat limited. Experimental methods for screening protein–protein interactions include phage display, affinity chromatography and co-immunoprecipitation (13). Recently, the two-hybrid method has been widely used to perform high throughput genome-wide screening of protein–protein interactions in yeast and Caenorhabditis elegans, as well as higher organisms such as mouse (14–17). In particular, comprehensive interaction assays using yeast genes have been carried out by two independent groups (14,16). Thus, thousands of experimentally identified protein–protein interactions are accumulating.
Uetz et al. (14) and Ito et al. (16) showed that such protein–protein interaction data can supply important information about many biological events. Furthermore, the functions of uncharacterized proteins can be predicted in the light of the interacting partner (18) by using the principle of ‘guilt by association’, which maintains that two interacting proteins are likely to participate in the same cellular function (19). Therefore, with the help of bioinformatic platforms, we can expect to extract biologically important information from protein–protein interaction networks (20,21). However, an intrinsic problem is that protein–protein interactions obtained from biological experiments often include numerous false positives (22). These false positives may unnecessarily connect unrelated proteins, forming huge interaction clusters (16), which complicate elucidation of the biological importance of these interactions. Incorrect biological conclusions may also be derived from these interactions. Therefore, removing as many of these false positive interactions as possible may be very useful for various types of analyses, although it is laborious to confirm the interactions by other experimental methods.
Here, we introduce the ‘interaction generality’ measure, which can be used to computationally assess the reliability of the interaction data using only a list of protein–protein interactions. We also report results on networks of interaction data that were made more reliable by applying this measure.
MATERIALS AND METHODS
The yeast protein–protein interaction data of Ito et al. (16) and Uetz et al. (14) were obtained from http://genome.c.kanazawa-u.ac.jp/Y2H/ and http://www.genome.ad.jp/brite/, respectively. In these data, we considered the interactions protein A (bait)–protein B (prey) and protein B (bait)–protein A (prey) as a single interaction (i.e. a bidirectional interaction in a two-hybrid experiment). As a result, these databases contained 806 and 948 non-redundant interactions (including homodimers), respectively. In addition, we obtained 2592 non-redundant physical interactions, including 624 interactions studied by immunoprecipitation, from MIPS (Munich Information Centre for Protein Sequences, http://mips.gsf.de) (23). Combining the physical interaction data obtained from MIPS with those of Ito and Uetz yielded a total of 3210 non-redundant interactions (referred to as ‘all physical interactions’ in this paper), which included 2128 heterodimers for which the function of both partners is known.
Using the Yeast Proteome Database (YPD) web site, we assigned one or some of 44 cellular roles and one or some of 28 cellular localizations to each protein (24). Gene names with multiple synonyms were integrated into a single name, in the light of information in the YPD. The yeast gene expression profiles from the DNA microarray data of 2467 yeast genes (25) were obtained from http://rana.stanford.edu/clustering. We had all physical interaction data for 1237 heterodimers with gene expression data. The expression data were used to calculate the Pearson product–moment correlation coefficients between interacting proteins. The mathematical formula to define interaction generality is available on request.
RESULTS
Biological basis for the interaction generality measure
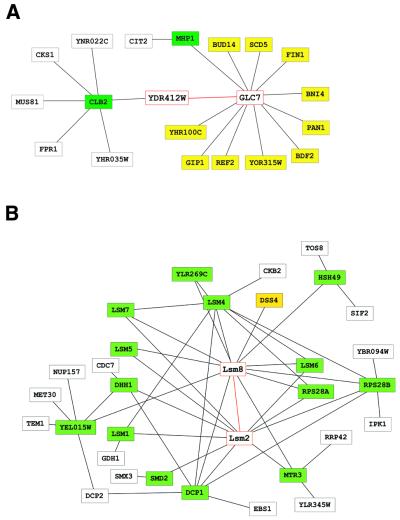
We defined the interaction generality for each protein–protein interaction. The definition of interaction generality is based on the idea that there are some ‘sticky’ proteins which seem to interact with many other proteins and that most of these interactions may not be physiologically important. In particular, in yeast two-hybrid assays some proteins seem to activate transcription of a reporter gene without actually interacting with their partners, a situation that can lead to an excess number of candidate partners (some of which are erroneous) for a single protein (26). Therefore, we first defined the interaction generality as the number of proteins that directly interact with the target protein pair. An example is shown in Figure 1A, in which proteins included in the calculation of interaction generality are yellow or green. Therefore, in this example, the interaction generality for the interaction between GLC7 and YDR412W is 13. In reality, GLC7 is unlikely to interact with all 12 of these proteins, because most of these have distinct functions (see Fig. 1A legend). Thus, interactions in which proteins directly interact with many other proteins will have relatively high interaction generalities.
Figure 1.
Examples of protein–protein interaction networks. Nodes and lines denote proteins and interactions, respectively. The target proteins for calculation of the interaction generality and their interactions are shown in red. Green and yellow nodes are proteins associated with a given interaction; green nodes interact with more than one protein. According to the unimproved and improved definitions, the interaction generality is the number of yellow and green nodes + 1 and the number of yellow nodes + 1, respectively. Protein–protein interactions were obtained from Uetz et al. (14). Only proteins within two interaction steps of the protein pair are shown. The schema were drawn using the tool developed by Mrowka (32). (A) Protein–protein interaction network for proteins interacting with YDR412W or GLC7 or their interacting partners. Most of the proteins associated with GLC7 have distinct functions (24). BDF2, chromatin chromosome structure; BNI4, cell wall maintenance and cytokinensis; GIP1, meiosis; MHP1, mitosis; PAN1, cell polarity, cell structure and vesicular transport; REF2, RNA processing and modification; SCD5, vesicular transport. FIN1, YDR412W, YHR100C and BUD14 are uncharacterized proteins. (B) Protein–protein interaction network for proteins interacting with Lsm2 or Lsm8 or their interacting partners. The following interactions involving Lsm2 or Lsm8 were independently identified by Fromont-Racine et al. (33) and Pannone et al. (27): HSH49–LSM8, LSM1–LSM2, LSM2–LSM5, LSM2–LSM6, LSM2–LSM8, LSM2–SMD2, LSM4–LSM8, LSM5–LSM8, LSM6–LSM8, LSM8–MTR3 and LSM8–YEL015W.
Calculating the interaction generality can be an efficient means of revealing potentially false positive interactions. However, a high interaction generality is not always due to false positive protein interactions. Instead, these proteins may be involved in various biological processes by forming large complexes or by participating in complex pathways. An example of such a situation is shown in Figure 1B. Lsm2 and Lsm8 interact with each other and are involved in RNA splicing (27). They have many partners, as in the previous example, and the interaction generality is 16. However, the proteins with which Lsm2 and Lsm8 interact also interact with each other or with other proteins of related function, making a complicated network of protein interactions. Similar interaction networks are observed for many protein complexes, including RNA polymerase III (28).
To distinguish the interaction properties shown in Figure 1A from those of Figure 1B, we modified our definition of interaction generality. In the improved definition, the number of proteins interacting with more than one protein is subtracted from the interaction generality given by the previous definition (subtracted proteins are colored green in Fig. 1A and B). This operation effectively reduces the interaction generality of complicated networks, thereby increasing their validity. The adjusted interaction generality for Lsm2 and Lsm8 (Fig. 1B) is reduced to 2, whereas that for YDR412W and GLC7 (Fig. 1A) remains high, at a value of 11.
The interaction generality can be used to assess the reliability of interactions
Using two-hybrid methods, Ito et al. and Uetz et al. independently comprehensively screened yeast protein–protein interactions. However, only ∼17% of the protein–protein interactions obtained by Ito et al. (16) were among (i.e. overlapped with) those identified by Uetz et al. (14). These results suggest that the fraction of non-overlapping interactions may contain many false positive interactions, whereas most overlapping interactions are reliable in that they are reproducible in independent assays. To evaluate the efficiency of using the interaction generality to assess the reliability of interactions, we calculated the distribution of the interaction generalities for the interactions identified by both Ito and Uetz, as well as those for the interactions identified by only one of these two groups.
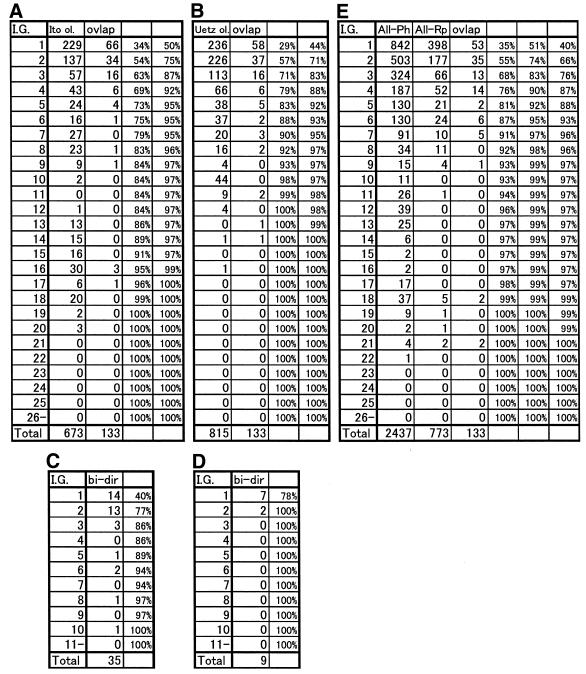
Table 1A shows the distribution of interaction generalities for the data of Ito (excluding those that overlapped with the data of Uetz) and for the overlapping data, the value for which was calculated in the light of Ito’s protein–protein interaction data. The overlapping data have significantly lower generalities than those of the non-overlapping data. The ratio of interactions with generalities between 1 and 5 is 72.8% for the non-overlapping data but 94.7% for the overlapping data (P = 5.2 × 10⁻⁸). We obtained a similar result when we calculated the distribution of the interaction generalities for the data of Uetz (Table 1B).
Table 1. Distribution of the number of interactions with given interaction generalities.
(A) Analyses using the interactions unique to the work of Ito and the interactions common to the data of Ito and Uetz (i.e. overlapping interactions). Interaction generality (I.G.) calculations are based on Ito’s interaction network. Numbers in each column show, first, interaction generality (I.G.), second, number of interactions (excluding overlapping ones, denoted Ito ol.) and, third, number of overlapping interactions observed for corresponding generalities (ovlap). Cumulative percentages for the second and third columns are shown in the fourth and fifth columns, respectively.
(B) Analyses using interactions unique to the work of Uetz (Uetz ol.) and those common to the studies of Ito and Uetz (ovlap). Interaction generality calculations are based on Uetz’s interaction network.
(C) Analysis using the bidirectional interactions (bi-dir) identified by Ito. Interaction generality calculations are based on Ito’s interaction network.
(D) Analysis using the bidirectional interactions (bi-dir) identified by Uetz. Interaction generality calculations are based on Uetz’s interaction network.
(E) Analysis using all physical interactions (All-Ph), all reliable interactions (overlapping interactions between the assays of Ito and Uetz, all bidirectional interactions and interactions obtained by immunoprecipitation, denoted All-Rp) and the interactions common to the studies of Ito and Uetz (ovlap). Generality is calculated according to the all physical interaction network.
In addition, interactions obtained by prey–bait and bait–prey assays using identical pairs of proteins (i.e. bidirectional interactions) also seem to be reliable. Table 1C shows the distribution of generalities for bidirectional interactions in the Ito study. All of the generalities are less than 11 (P = 0.0025). Table 1D shows a similar analysis for the bidirectional interactions in the Uetz study. All the generalities are less than 3 (P = 0.006). These results give additional support to the assumption that interactions with lower generalities are more likely to be reliable.
In the MIPS database, interactions obtained by various experimental methods are deposited as a ‘physical interaction set’. We evaluated whether interaction generality is applicable to the entire physical set (all physical interactions). In this set, we defined reliable interactions as those identified by immunoprecipitation, those comprising the data overlapping in the Ito and Uetz studies and the Ito and Uetz bidirectional interactions. The second and third columns in Table 1E show the distributions of interaction generalities for all physical interactions (excluding reliable interactions) and for reliable interactions, respectively. Most of the reliable interactions have low interaction generalities, suggesting that using interaction generalities to assess reliability is also applicable to physical data.
Interaction generalities may be biased by the number of proteins and interactions in the dataset. However, according to Table 1A, B and E, reproducible interactions (ovlap and All-Rp) with generalities within the range 1–5 are almost same (88–95%) regardless of the size of the dataset. We obtained similar results using three random datasets of different sizes from the all physical dataset (data not shown), indicating that the biases seem to be small with an appropriately sized dataset.
The rate of interactions with common cellular roles increases upon elimination of interactions with high generalities
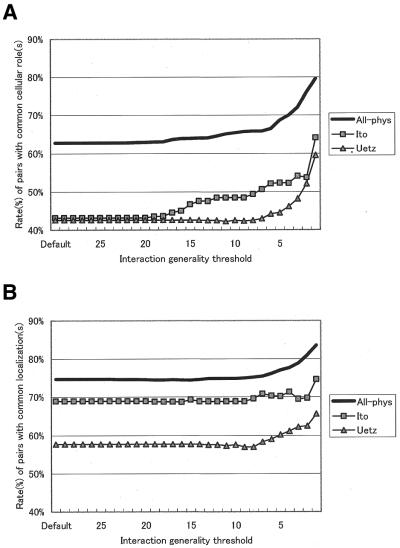
It is widely accepted that interacting proteins are likely to share a common function (the ‘guilt by association’ hypothesis) (19). Several groups reported that ∼63% of pairs of interacting proteins have a common cellular role as defined in the YPD (18,24,29). We investigated the effect of eliminating unreliable interactions as defined by their interaction generalities. We eliminated interactions whose generalities were greater than a given threshold from the interaction network and calculated the rate of interacting protein pairs with common cellular roles. For all three data sets (all physical interactions, Ito’s interactions and Uetz’s interactions), the rates significantly increased as the generality threshold decreased (Fig. 2A). Similar results were observed for an analysis of cellular co-localization (Fig. 2B), in which the rate of co-localization of interacting proteins increases as the generality threshold decreases.
Figure 2.
Rates of interacting protein pairs versus interaction generality. These figures show the rates of interacting protein pairs with common cellular roles (A) or a common cellular localization (B) after elimination of interactions whose generalities exceed a given threshold. The lines, squares and triangles denote results using protein–protein interaction networks of all physical interactions (All-phys), interactions obtained by Ito and those obtained by Uetz, respectively. The threshold value varied from 1 to 29. Uncharacterized proteins were removed from the analyses in (A) and proteins with unknown cellular localizations were removed from the analyses in (B).
When the threshold was set to 1 (the minimal value), the rate of physical interactions with a common cellular role was as high as 79.6% (P = 0.00018, Fig. 2A). We analyzed this result in further detail. Figure 3 shows the rate of interactions among proteins with common cellular roles and the rate for those with different cellular roles before (Fig. 3A) and after (Fig. 3B) elimination of interactions with an interaction generality >1. Note that the rates of interactions for proteins with different cellular roles decreased whereas those with the same cellular role increased.
Figure 3.
Rate of cross-talk before and after refinement of the protein–protein interaction network. Figures show rates of interactions within given cellular roles and across different cellular roles (A) before and (B) after elimination of interactions whose generalities exceeded 1. Crosses indicate rates of interaction with no common cellular role. Other names of cellular roles indicate the rate of interactions having that cellular role in common. Interactions with only a single common cellular role (F) are dealt with as one interaction within that cellular role. Interactions with multiple common cellular roles (F1, F2, …, Fn) are dealt with as 1/n interactions within each cellular role.
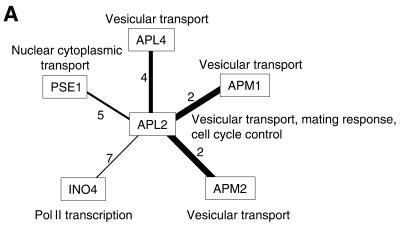
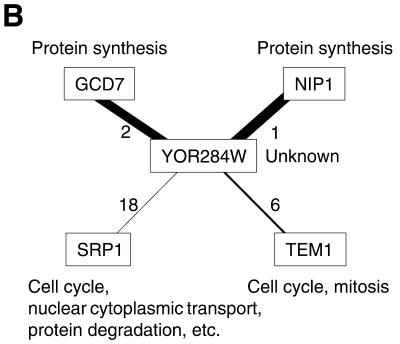
We expect that ‘guilt by association’ will be very clear after the removal of interactions with high interaction generalities. APL2, the protein involved in vesicular transport and various other functions, interacts with five other proteins (Fig. 4A), and partners having low generalities are likely to have the same cellular role (i.e. vesicular transport) as APL2. Similar results were obtained for TIF35 (protein synthesis) and NUP42 (nuclear cytoplasmic transport) (data not shown). Thus, elimination of interactions with high generalities from protein–protein interaction networks may improve prediction of the function of uncharacterized proteins. For example, YOR284W is an uncharacterized protein that interacts with four other proteins (Fig. 4B). As interactions of this protein with proteins involved in protein synthesis have lower generalities, YOR284W is likely to be involved in protein synthesis. We found that cellular roles could be assigned to four other previously uncharacterized proteins in this way: YDR100W (vesicular transport/membrane fusion), YOR275C (vesicular transport), YIL151C (protein degradation) and SOH1 (Pol II transcription) (data not shown).
Figure 4.
Example of interaction generality analysis for the prediction of gene function. Only interactions involving the given proteins are shown. The number beside a line is the interaction generality of that interaction; the width of the line is inversely proportional to its generality. (A) Interactions that show clear associations between common cellular roles. (B) Interactions that enable clear prediction of the cellular roles of uncharacterized proteins.
Interacting protein pairs with low interaction generalities are likely to be co-expressed
Using microarray and protein–protein interaction data for yeast, Grigoriev showed that the average correlation coefficient of gene expression profiles that corresponds to interacting pairs is significantly higher than those that correspond to random pairs (30). We investigated the relationship between interaction generalities and expressional correlations of interacting proteins. The average correlation coefficient for interactions whose generalities were 1–5 was 0.183, which is markedly greater than that for interactions with higher generalities (0.0684, P = 4.53 × 10⁻⁸), clearly showing that reliable interacting pairs are more likely to be co-expressed.
DISCUSSION
Here, we have defined the ‘interaction generality’ measure and showed its relationship to the reliability of a protein–protein interaction. At first, we simply defined interaction generality as the number of proteins that directly interact with the target protein pair. However, this definition often gave high interaction generality even when the interactions seem to be true positives. Therefore, we established the improved definition that adopted the idea that interactions observed in complicated interaction networks are likely to be true positives. The rate of interactions with generalities within the range 1–5 for 773 reliable interactions shown in Table 1E changed from 28.7% according to the first definition to 92.4% after the refinement, clearly showing the improvement of the definition.
Although not all interactions defined as ‘reliable’ in this way may be physiologically meaningful, we believe that interactions with low generalities are predominantly physiologically meaningful. Therefore, eliminating high generality interactions may help create more reliable networks. As a result, we observed that the rate of association of proteins with common functions increases and that interacting proteins are more likely to be co-expressed. However, even after applying the most stringent thresholds to networks, 20% of interactions still cross cellular roles. We suggest that some or most of these dissimilar interactions are biologically meaningful, presumably as examples of cross-talk.
One of the advantages of this elimination is that it improves the accuracy with which the functions of uncharacterized proteins can be predicted. There are 445 uncharacterized yeast proteins that interact with proteins whose functions are known. The accuracy of functional prediction is ∼63% if the predictions are made on the basis of a single interacting partner. Of course, the accuracy would be increased if a sophisticated algorithm were applied to predict function using information about multiple interacting partners. However, according to the data in Figures 2A and 3, the accuracy of predicting the function of an uncharacterized protein would increase to ∼79.6% if interactions with generalities of 2 or more are eliminated. As a result, the functions of 240 proteins can be predicted with increased accuracy.
The disadvantage of this elimination is that we may eliminate some true positive interactions. For example, in molecular biological networks, although most nodes interconnect with only a few other nodes, some do have connections to many others (31). The interactions between these numerously connected nodes will be eliminated by our analysis unless the interacting partners also interact with each other or with other proteins. In fact, ∼8% of reproducible interactions are eliminated if we set a threshold of 5 (Table 1E). The elimination of true positive interactions greatly reduces the number of interactions available for consideration. We propose two approaches to solving this problem. One is to combine the data examined in our method with other sources of information (such as protein–protein interactions of ortholog proteins in other organisms, expression data, etc.) to assess reliability. The other is to define interaction generality in a more sophisticated way, by incorporating additional biological knowledge, such as interaction patterns of protein complexes.
One of the interesting features of large-scale protein–protein interaction networks is that they contain huge interaction clusters containing large numbers of proteins. For example, Ito et al. (16) have shown that there are large clusters of interaction networks that connect more than half of all proteins. However, as Ito et al. noted, the elimination of proteins with many interacting partners would reduce the size of these networks substantially. In fact, elimination of interactions with generalities of ≥6 reduces the size of Ito’s largest cluster from 417 (52.3% of 797) to 219 (30.9% of 708) proteins.
In summary, our method is extremely helpful in effectively constructing reliable protein–protein interaction networks. In addition, we believe that our method is applicable to future study of protein–protein interaction networks in various organisms.
Acknowledgments
ACKNOWLEDGEMENTS
The yeast proteome database constructed by Proteome Inc. was used in this study. This study was supported by a Research Grant for the RIKEN Genome Exploration Research Project from the Ministry of Education, Culture, Sports, Science and Technology of the Japanese Government to Y.H.
REFERENCES
- 1.Blattner F.R., Plunkett,G., Bloch,C.A., Perna,N.T., Burland,V., Riley,M., Collado-Vides,J., Glasner,J.D., Rode,C.K., Mayhew,G.F. et al. (1997) The complete genome sequence of Escherichia coli K-12. Science, 277, 1453–1474. [DOI] [PubMed] [Google Scholar]
- 2.Kawai J., Shinagawa,A., Shibata,K., Yoshino,M., Itoh,M., Ishii,Y., Arakawa,T., Hara,A., Fukunishi,Y., Konno,H. et al. (2001) Functional annotation of a full-length mouse cDNA collection. Nature, 409, 685–690. [DOI] [PubMed] [Google Scholar]
- 3.Legrain P. and Selig,L. (2000) Genome-wide protein interaction maps using two-hybrid systems. FEBS Lett., 480, 32–36. [DOI] [PubMed] [Google Scholar]
- 4.Pawson T. and Nash,P. (2000) Protein–protein interactions define specificity in signal transduction. Genes Dev., 14, 1027–1047. [PubMed] [Google Scholar]
- 5.Dandekar T., Snel,B., Huynen,M. and Bork,P. (1998) Conservation of gene order: a fingerprint of proteins that physically interact. Trends Biochem. Sci., 23, 324–328. [DOI] [PubMed] [Google Scholar]
- 6.Enright A.J., Iliopoulos,I., Kyrpides,N.C. and Ouzounis,C.A. (1999) Protein interaction maps for complete genomes based on gene fusion events. Nature, 402, 86–90. [DOI] [PubMed] [Google Scholar]
- 7.Hofacker I.L., Fekete,M., Flamm,C., Huynen,M.A., Rauscher,S., Stolorz,P.E. and Stadler,P.F. (1998) Automatic detection of conserved RNA structure elements in complete RNA virus genomes. Nucleic Acids Res., 26, 3825–3836. [DOI] [PMC free article] [PubMed] [Google Scholar]
- 8.Marcotte E.M., Pellegrini,M., Thompson,M.J., Yeates,T.O. and Eisenberg,D. (1999) A combined algorithm for genome-wide prediction of protein function. Nature, 402, 83–86. [DOI] [PubMed] [Google Scholar]
- 9.Overbeek R., Fonstein,M., D’Souza,M., Pusch,G.D. and Maltsev,N. (1999) The use of gene clusters to infer functional coupling. Proc. Natl Acad. Sci. USA, 96, 2896–2901. [DOI] [PMC free article] [PubMed] [Google Scholar]
- 10.Pellegrini M., Marcotte,E.M., Thompson,M.J., Eisenberg,D. and Yeates,T.O. (1999) Assigning protein functions by comparative genome analysis: protein phylogenetic profiles. Proc. Natl Acad. Sci. USA, 96, 4285–4288. [DOI] [PMC free article] [PubMed] [Google Scholar]
- 11.Sali A. (1999) Functional links between proteins. Nature, 402, 23, 25–26. [DOI] [PubMed] [Google Scholar]
- 12.Bock J.R. and Gough,D.A. (2001) Predicting protein–protein interactions from primary structure. Bioinformatics, 17, 455–460. [DOI] [PubMed] [Google Scholar]
- 13.Phizicky E.M. and Fields,S. (1995) Protein–protein interactions: methods for detection and analysis. Microbiol. Rev., 59, 94–123. [DOI] [PMC free article] [PubMed] [Google Scholar]
- 14.Uetz P., Giot,L., Cagney,G., Mansfield,T.A., Judson,R.S., Knight,J.R., Lockshon,D., Narayan,V., Srinivasan,M., Pochart,P. et al. (2000) A comprehensive analysis of protein–protein interactions in Saccharomyces cerevisiae. Nature, 403, 623–627. [DOI] [PubMed] [Google Scholar]
- 15.Walhout A.J., Sordella,R., Lu,X., Hartley,J.L., Temple,G.F., Brasch,M.A., Thierry-Mieg,N. and Vidal,M. (2000) Protein interaction mapping in C. elegans using proteins involved in vulval development. Science, 287, 116–122. [DOI] [PubMed] [Google Scholar]
- 16.Ito T., Chiba,T., Ozawa,R., Yoshida,M., Hattori,M. and Sakaki,Y. (2001) A comprehensive two-hybrid analysis to explore the yeast protein interactome. Proc. Natl Acad. Sci. USA, 98, 4569–4574. [DOI] [PMC free article] [PubMed] [Google Scholar]
- 17.Suzuki H., Fukunishi,Y., Kagawa,I., Saito,R., Oda,H., Endo,T., Kondo,S., Bono,H., Okazaki,Y. and Hayashizaki,Y. (2001) Protein–protein interaction panel using mouse full-length cDNAs. Genome Res., 11, 1758–1765. [DOI] [PMC free article] [PubMed] [Google Scholar]
- 18.Schwikowski B., Uetz,P. and Fields,S. (2000) A network of protein–protein interactions in yeast. Nat. Biotechnol., 18, 1257–1261. [DOI] [PubMed] [Google Scholar]
- 19.Oliver S. (2000) Guilt-by-association goes global. Nature, 403, 601–603. [DOI] [PubMed] [Google Scholar]
- 20.Ideker T., Thorsson,V., Ranish,J.A., Christmas,R., Buhler,J., Eng,J.K., Bumgarner,R., Goodlett,D.R., Aebersold,R. and Hood,L. (2001) Integrated genomic and proteomic analyses of a systematically perturbed metabolic network. Science, 292, 929–934. [DOI] [PubMed] [Google Scholar]
- 21.Fellenberg M., Albermann,K., Zollner,A., Mewes,H.W. and Hani,J. (2000) Integrative analysis of protein interaction data. Proc. Int. Conf. Intell. Syst. Mol. Biol., 8, 152–161. [PubMed] [Google Scholar]
- 22.Legrain P., Wojcik,J. and Gauthier,J.M. (2001) Protein–protein interaction maps: a lead towards cellular functions. Trends Genet., 17, 346–352. [DOI] [PubMed] [Google Scholar]
- 23.Mewes H.W., Frishman,D., Gruber,C., Geier,B., Haase,D., Kaps,A., Lemcke,K., Mannhaupt,G., Pfeiffer,F., Schuller,C. et al. (2000) MIPS: a database for genomes and protein sequences. Nucleic Acids Res., 28, 37–40. [DOI] [PMC free article] [PubMed] [Google Scholar]
- 24.Costanzo M.C., Crawford,M.E., Hirschman,J.E., Kranz,J.E., Olsen,P., Robertson,L.S., Skrzypek,M.S., Braun,B.R., Hopkins,K.L., Kondu,P. et al. (2001) YPD, PombePD and WormPD: model organism volumes of the BioKnowledge library, an integrated resource for protein information. Nucleic Acids Res., 29, 75–79. [DOI] [PMC free article] [PubMed] [Google Scholar]
- 25.Eisen M.B., Spellman,P.T., Brown,P.O. and Botstein,D. (1998) Cluster analysis and display of genome-wide expression patterns. Proc. Natl Acad. Sci. USA, 95, 14863–14868. [DOI] [PMC free article] [PubMed] [Google Scholar]
- 26.Serebriiskii I.G. and Golemis,E.A. (2001) Two-hybrid system and false positives. Approaches to detection and elimination. Methods Mol. Biol., 177, 123–134. [DOI] [PubMed] [Google Scholar]
- 27.Pannone B.K., Kim,S.D., Noe,D.A. and Wolin,S.L. (2001) Multiple functional interactions between components of the Lsm2-Lsm8 complex, U6 snRNA and the yeast La protein. Genetics, 158, 187–196. [DOI] [PMC free article] [PubMed] [Google Scholar]
- 28.Flores A., Briand,J.F., Gadal,O., Andrau,J.C., Rubbi,L., Van Mullem,V., Boschiero,C., Goussot,M., Marck,C., Carles,C. et al. (1999) A protein–protein interaction map of yeast RNA polymerase III. Proc. Natl Acad. Sci. USA, 96, 7815–7820. [DOI] [PMC free article] [PubMed] [Google Scholar]
- 29.Hishigaki H., Nakai,K., Ono,T., Tanigami,A. and Takagi,T. (2001) Assessment of prediction accuracy of protein function from protein–protein interaction data. Yeast, 18, 523–531. [DOI] [PubMed] [Google Scholar]
- 30.Grigoriev A. (2001) A relationship between gene expression and protein interactions on the proteome scale: analysis of the bacteriophage T7 and the yeast Saccharomyces cerevisiae. Nucleic Acids Res., 29, 3513–3519. [DOI] [PMC free article] [PubMed] [Google Scholar]
- 31.Jeong H., Tombor,B., Albert,R., Oltvai,Z.N. and Barabasi,A.L. (2000) The large-scale organization of metabolic networks. Nature, 407, 651–654. [DOI] [PubMed] [Google Scholar]
- 32.Mrowka R. (2001) A Java applet for visualizing protein–protein interaction. Bioinformatics, 17, 669–671. [DOI] [PubMed] [Google Scholar]
- 33.Fromont-Racine M., Mayes,A.E., Brunet-Simon,A., Rain,J.C., Colley,A., Dix,I., Decourty,L., Joly,N., Ricard,F., Beggs,J.D. et al. (2000) Genome-wide protein interaction screens reveal functional networks involving Sm-like proteins. Yeast, 17, 95–110. [DOI] [PMC free article] [PubMed] [Google Scholar]


