

Abstract
Coinciding with wide-spread efforts to address obesity, weight bias internalization (a process of self-devaluation wherein individuals apply weight biased stereotypes to themselves) has gained increased attention as a robust correlate of poor health outcomes. The present meta-analysis aimed to provide the largest quantitative synthesis of associations between weight bias internalization and health-related correlates. Studies that provided zero-order correlations for cross-sectional or prospective associations between weight bias internalization and physical, psychosocial, and behavioral health correlates were included in the meta-analysis. Meta-regression determined whether these associations differed based on demographic (sex/gender, race, age), anthropometric (body mass index), and study-level (publication status, sample type, study quality) moderators. Data for 149 (sub)samples were identified that included between 14 and 18,766 participants (Msample size=534.96, SD=1,914.43; Mage=34.73, SD=12.61, range=9.95–65.70). Results indicated that greater weight bias internalization was concurrently associated with worse psychosocial (e.g., negative and positive mental health, social functioning), physical (e.g., BMI, weight maintenance, health-related quality of life [HRQoL]), and behavioral health (e.g., disordered eating behaviors, healthy eating, physical activity) across most constructs, with effects ranging from small to very large in magnitude. Preliminary evidence also suggested that greater weight bias internalization was subsequently associated with less weight loss and increased negative mental health. Notable variations in the nature and magnitude of these associations were identified based on the health-related correlate and moderator under consideration. These findings indicate that weight bias internalization is linked to multiple adverse health-related outcomes and provide insight into priorities for future research, theory-building, and interventions in this area.
Keywords: Weight Bias Internalization, Weight Stigma, Health, Mental Health, Behavioral Health
In recent decades there have been widespread public health efforts to address obesity, which has coincided with increased attention on weight stigma (experiences of denigration and devaluation due to one’s body weight) as a global health concern (Mason et al., 2021; Pearl & Puhl, 2018; Puhl et al., 2018). In line with this increased weight-focus within society, both individuals who do and do not report experiencing weight stigma have been shown to endorse and apply weight biased attitudes and stereotypes to themselves, a self-directed and self-devaluing process referred to as weight bias internalization (WBI; Puhl et al., 2018). Notably, compared to reporting weight stigma experiences, WBI exhibits more adverse patterns of association with health-related outcomes (Alimoradi et al., 2019; Emmer et al., 2020) and approximately 20% to 50% of adults across the weight spectrum exhibit high levels of WBI (Puhl et al., 2018). Yet, the current understanding of the significance, magnitude, and potential moderators of associations between WBI and psychosocial, physical, and behavioral health factors are not fully understood.
Two existing theoretical frameworks have been used to explain the health-related implications of WBI. First, an adapted psychological mediation framework (Sikorski et al., 2015) that draws upon Meyer’s minority stress theory suggests that weight stigma experiences (which can occur for individuals of any weight) serve as distal stressors that map onto increases in: (1) WBI as a group-specific proximal stressor that is believed to be specific to individuals with obesity; (2) increases in general psychological risk factors (e.g., poor self-esteem). These group-specific and general psychological risk factors are posited to subsequently promote adverse mental health. A second model that aims to explain how WBI is maintained among individuals with obesity posits that living in a weight stigmatizing environment perpetuates individuals’ negative self-evaluations of themselves as “obese people” (i.e., perpetuates WBI; Ratcliffe & Ellison, 2015). Bidirectional and interdependent processes among attentional (e.g., hypervigilance), cognitive (e.g., beliefs about the meaning of being an “obese person”), psychosocial (e.g., negative affect, avoidance of interpersonal relationships), and behavioral health (e.g., increased binge eating, decreased physical activity) factors are believed to increase negative self-evaluations and WBI among individuals with obesity, which in turn further increases these attentional, cognitive, psychosocial, and behavioral health maintenance factors. Notably, these two theoretical models were recently developed and have not been fully tested. Improving the understanding of the comparative magnitude of associations between WBI and different psychosocial, physical, and behavioral health correlates may provide insight into factors to consider in additional WBI theory testing and model refinement.
Health-Related Correlates of Weight Bias Internalization
Previous reviews and meta-analyses have generally focused on synthesizing the state of the literature on cross-sectional associations between WBI and aspects of mental health or broadly-defined behavioral health correlates. For example, in three meta-analyses, small to large concurrent associations were identified between greater WBI and worse anxiety and depression (Alimoradi et al., 2019), worse global mental health (Emmer et al., 2020), less “healthy” behavior use, and more “unhealthy” behavior use (Zhu et al., 2021). These data replicated findings from an earlier systematic review conducted through 2017, which provided a more nuanced descriptive understanding of associations between WBI and health-related correlates (Pearl & Puhl, 2018). Specifically, across studies in this review, greater WBI was consistently associated with worse negative affect (e.g., depression, anxiety), self-esteem, negative body image, eating disorder pathology, weight-related quality of life, and physical and mental HRQoL. In contrast, the evidence-base on associations between WBI and physical health correlates (e.g., BMI, weight changes) and health behaviors (e.g., healthy eating, physical activity) at the time was limited and inconsistent, which made it difficult to draw conclusions about these interrelations (Pearl & Puhl, 2018). In recent years, there has been notable growth in research examining these psychosocial, physical, and behavioral health correlates of WBI, which presents an opportunity to both provide quantitative insight into these associations and address additional research gaps that were not previously able to be explored.
Psychosocial Health Correlates
One notable limitation of the existing evidence-base on psychosocial health correlates of WBI is that none of the existing quantitative syntheses of this literature have provided separate assessments of associations between this WBI and differentially valenced (i.e., both positive and negative) aspects of mental health (Alimoradi et al., 2019; Emmer et al., 2020). Indeed, these meta-analyses solely examined concurrent interrelations between WBI and anxiety and depression (Alimoradi et al., 2019) and (worse) global mental health (Emmer et al., 2020). This approach aligns with the medical model, which has dominated the understanding of physical and mental health treatment and research over time, and largely focuses on efforts to reduce negatively valenced aspects of health (e.g., decrease morbidity, mental illness). Yet, it has become increasingly apparent that the absence of adverse mental (and physical) health does not inherently translate to the presence of adaptive health, wellness, and positive functioning (Ryff, 1989). An assessment of the comparative magnitude of associations between WBI and both negatively and positively valenced aspects of mental health (e.g., positive affect, self-esteem) can determine the extent to which elevated WBI not only maps onto difficulties individuals may experience with poor mental health (e.g., anxiety, depression) but also the extent to which it impedes wellness.
Physical Health Correlates
Another important area of inquiry that warrants further consideration concerns the existing evidence-base on weight-related correlates of WBI, such as BMI, individuals’ self-perceived weight statuses, weight cycling (i.e., a lack of weight maintenance), and changes in weight over time (e.g., from pre- to post-weight loss interventions). The evidence-base on associations between WBI and BMI, in particular, has been mixed to date. Although research has generally shown that WBI exhibits positive concurrent associations with measures of body weight (Lillis et al., 2010; Palmeira et al., 2016; Pearl & Puhl, 2014, 2018; Puhl et al., 2018), notable variations in patterns of significance and ranges of reported effect sizes have been identified for these associations across studies, particularly among samples limited to participants with overweight or obesity. For example, in Pearl and Puhl’s (2018) prior systematic review, in 16 studies that included participants with overweight or obesity only WBI exhibited small to large positive associations with anthropometric indices, whereas an additional 17 studies among individuals with overweight or obesity did not find significant associations between these constructs. A quantitative synthesis of associations between WBI and BMI that adjusts for sample size differences and examines moderators of this relation (e.g., differences between studies with and without participant weight restrictions) may clarify this literature.
Additional physical health correlates of WBI that warrant further assessment include aspects of physical health (e.g., physiological morbidity, somatic symptoms), general and weight-specific HRQoL, and individuals’ healthcare use and engagement. Although there have been relatively few studies in this area, among community-based samples and individuals seeking weight loss treatment, greater WBI has generally been associated with worse cardiometabolic health and somatic symptoms (Hilbert, Baldofski, et al., 2014; Pearl et al., 2017) and general and weight-specific HRQoL (Palmeira et al., 2016). In contrast, current evidence suggests that WBI may not be directly linked to individuals’ healthcare use or engagement (Hilbert, Braehler, et al., 2014; Mensinger et al., 2018). Evaluating the state of the literature on these interrelations will help determine the magnitude of these associations and provide insight into research gaps in this area that warrant consideration.
Behavioral Health Correlates
From a behavioral standpoint, WBI has been most consistently examined as a correlate of disordered eating behaviors. Most research in this area has focused on and identified positive associations between WBI and disinhibited eating behaviors, such as overeating and binge eating (Durso & Latner, 2008; Pearl & Puhl, 2014, 2018). Yet, disordered eating includes a number of behaviors beyond disinhibited eating, including dietary restraint, compensatory behaviors, and cognitively-based eating concerns (i.e., maladaptive thoughts about food and eating), which have received much less attention in the literature as correlates of WBI, although may be important to examine in this context. For example, it is well-established that eating disorder symptoms are transdiagnostic (Fairburn et al., 2003); that is, individuals with these symptoms commonly engage in multiple types of disordered eating, rather than one behavior alone. The relative strength of associations between WBI and various disordered eating behaviors consequently warrants assessment.
In addition to disordered eating, as noted above, a prior systematic review (conducted though 2017) indicated that associations between WBI and both healthy eating and physical activity were limited and inconsistent (Pearl & Puhl, 2018). This made it difficult to draw conclusions about these relations at the time. There has been an increase in research in this area in recent years, however, and these recent findings suggest that greater WBI may be associated with less physical activity and poorer healthy eating (e.g., Nejati et al., 2020; Fung et al., 2020). Combining this recent research with that identified through 2017 may help clarify the inconsistencies that were previously apparent for these associations.
Effect Moderators
It is not only of interest to determine the nature and magnitude of associations between WBI and health-related correlates, but also for whom and under what circumstances these patterns of association may differ. Notably, existing research that has examined differences in associations between WBI and health-related correlates appears heterogenous with regard to demographic and anthropometric factors (e.g., age, sex or gender, race, BMI), and sample characteristics (e.g., sample type). For example, regarding demographic and anthropometric factors, some studies have suggested that the nature and magnitude of associations between WBI and negative mental health (e.g., depressive symptoms), BMI, HRQoL, disordered eating behaviors, and healthy eating differ between males versus females (Boswell & White, 2015), individuals who identify as White and Black (Decker et al., 2018), and based on individuals’ BMIs (Decker et al., 2018; Meadows & Higgs, 2019). In contrast, others have not found that these factors moderate associations between WBI and these health-related correlates (Alimoradi et al., 2019; Purton et al., 2019; Romano et al., 2021). Whether demographic and anthropometric differences exist for these interrelations across studies consequently warrants clarity.
The Present Meta-Analysis
WBI is prevalent (Puhl et al., 2018) and has generally been associated with adverse health-related factors (Alimoradi et al., 2019; Emmer et al., 2020; Pearl & Puhl, 2018). To extend the evidence-base in this area, the present meta-analysis aimed to provide the largest comprehensive quantitative synthesis of cross-sectional and prospective associations between WBI and clinically-relevant psychosocial, physical, and behavioral health correlates to date. Whether these associations differ based on conceptually (e.g., BMI, sample type) and analytically (e.g., publication status, study quality) important factors were also examined. These results can provide important information that can be used to refine existing theories of WBI and provide insight into potential treatment targets for efforts seeking to improve individuals’ WBI.
Method
Search Strategy and Study Selection
Relevant studies were located through searches in PubMed, PsycINFO, CINAHL, Web of Science, and ProQuest Dissertations and Theses Global from inception through April, 2021. As an example search strategy, the following terms were used for the PsycINFO database: Weight bias internalization OR weight bias internalisation OR internalized weight bias OR internalised weight bias OR internalized weight stigma OR internalised weight stigma OR self-directed weight stigma OR self-directed weight bias OR weight self-stigma. Additional articles meeting the present inclusion criteria were located via listservs and contact with study authors. The study selection process is summarized via the PRISMA diagram in Figure 1.
Figure 1.
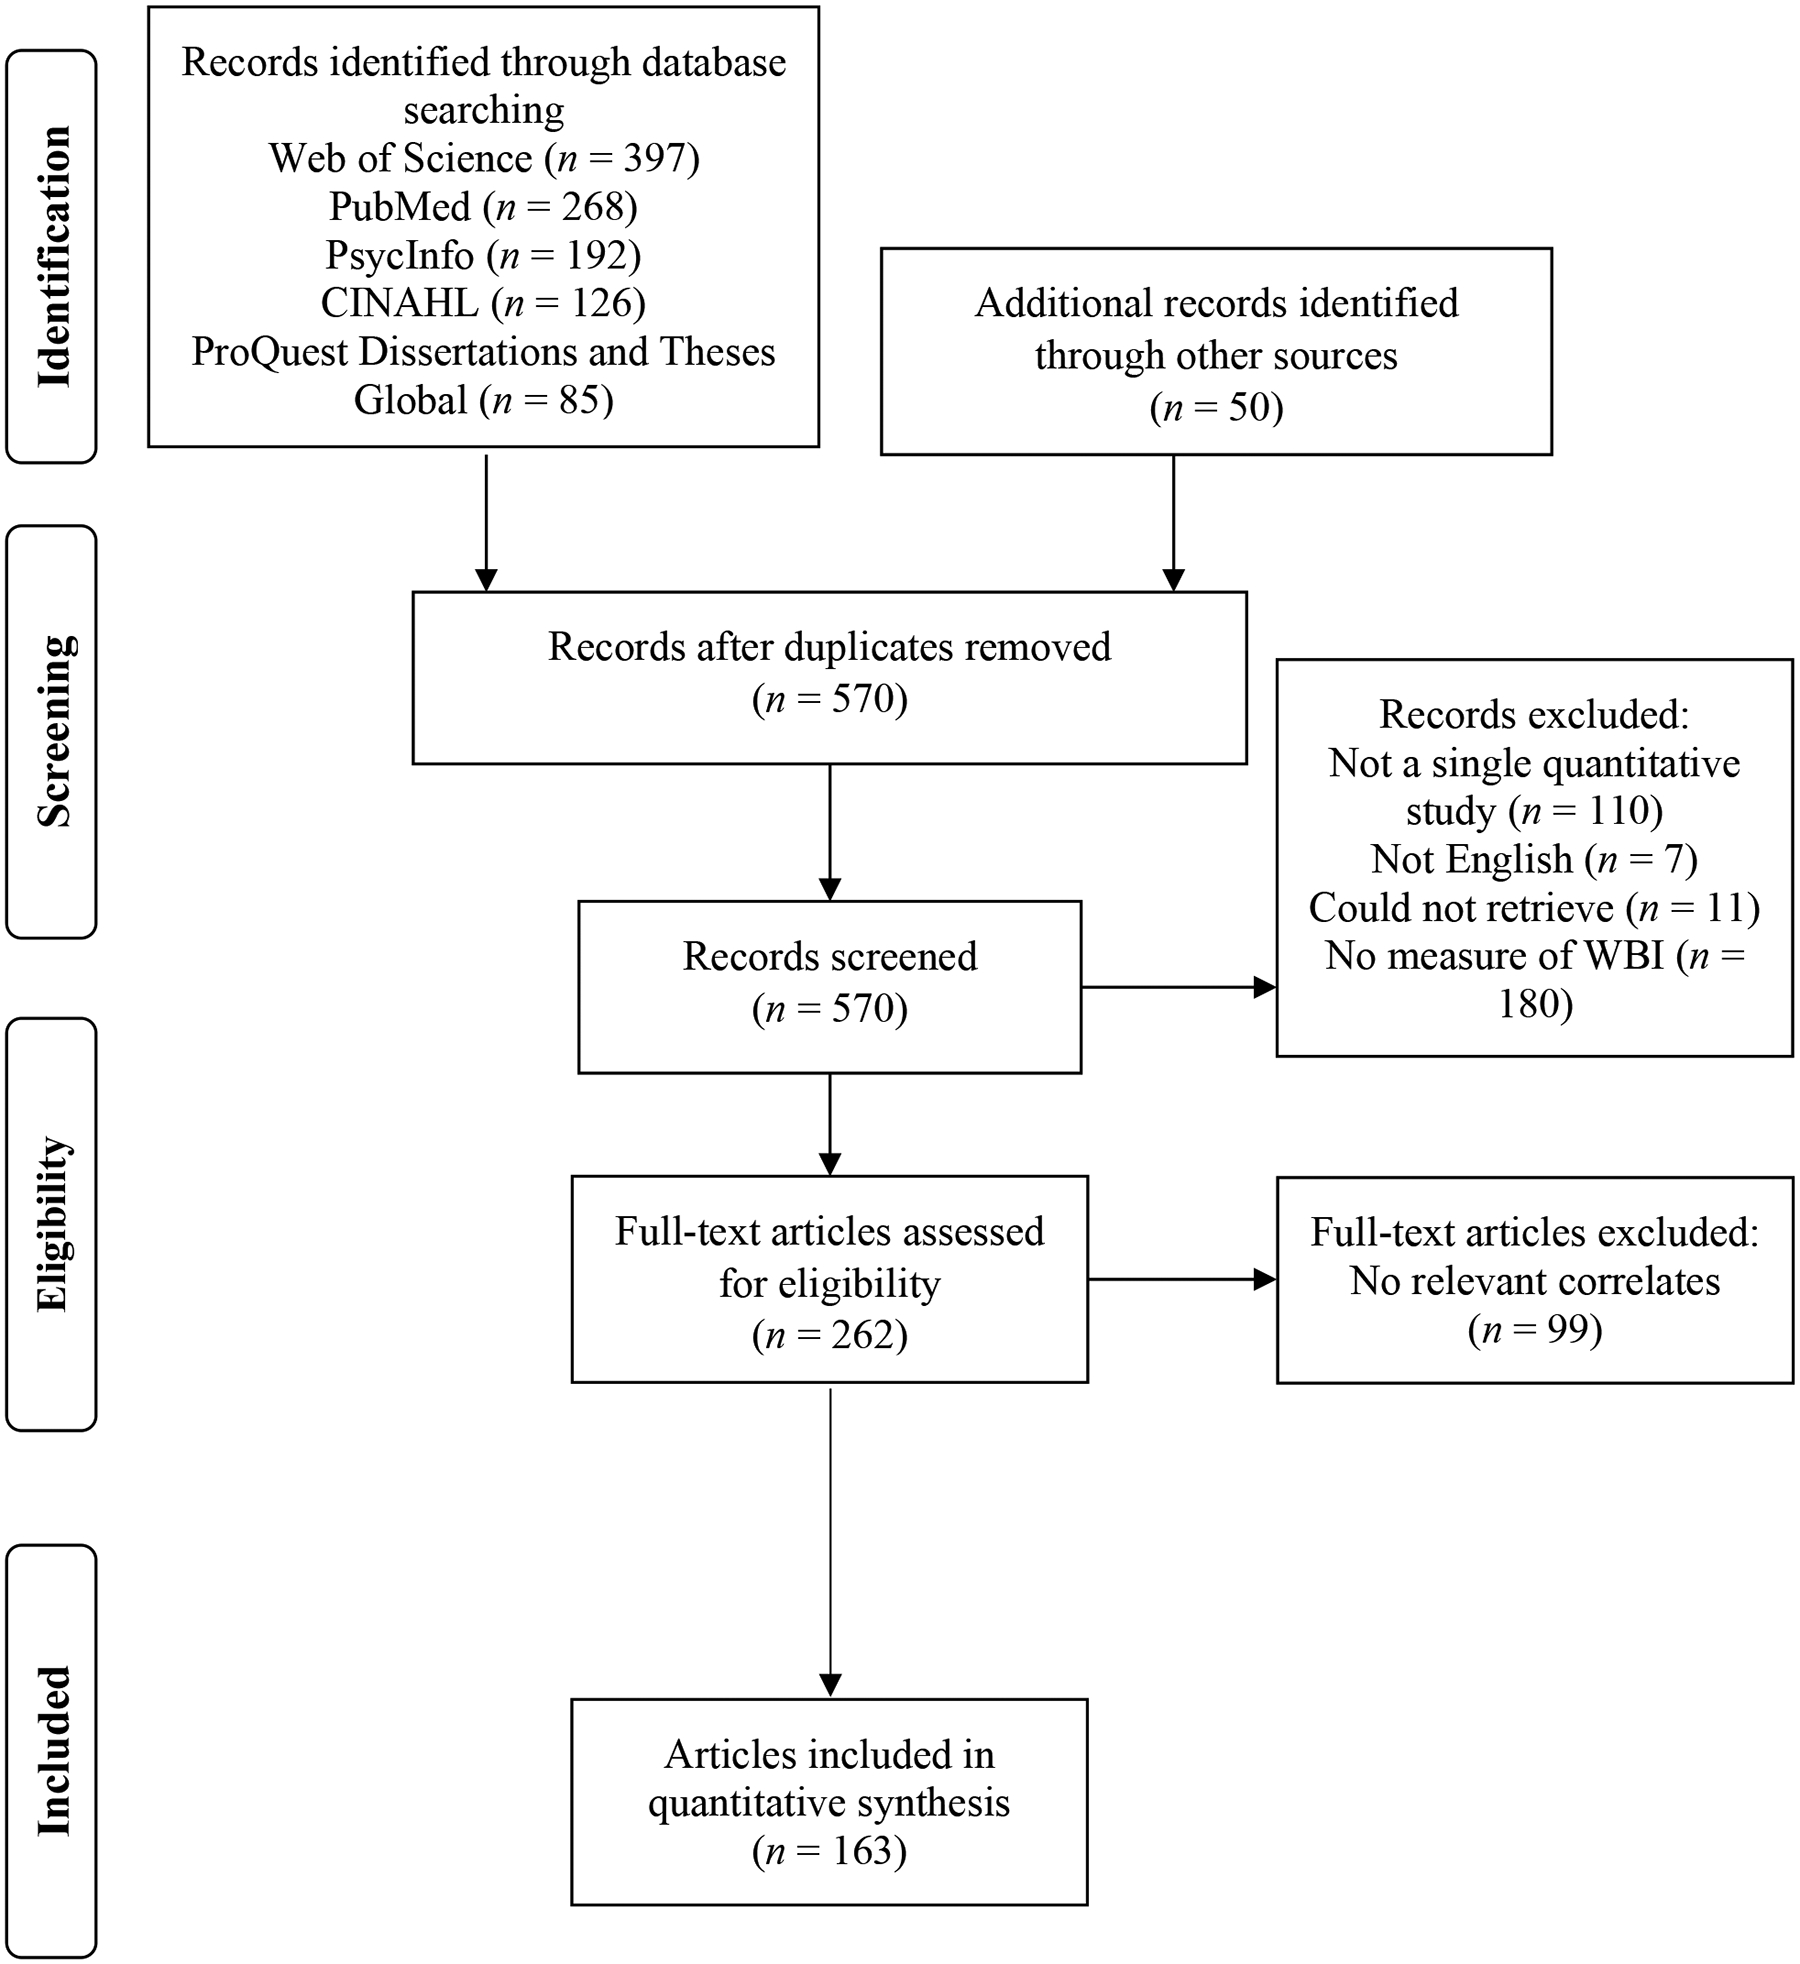
Preferred reporting items for systematic reviews and meta-analyses (PRISMA) flow diagram for study selection.
Peer-reviewed and unpublished (e.g., theses, dissertations, other unpublished work) studies that provided a quantitative examination of associations between WBI and at least one of the psychosocial, physical, and behavioral health correlates reported in Table 1 were included. Studies were excluded if they were not in English, did not include a measure of WBI, or did not provide relevant data in text or via correspondence with study authors. Review articles and commentaries were also excluded; however, the reference lists of those collected during the search process were title searched, reviewed, and individual studies were included if they met the inclusion criteria. No study design, publication date, or demographic exclusionary criteria were applied to increase the scope and generalizability of study findings.
Table 1.
Overall Effect Sizes for Associations between WBI and Health-Related Correlates, Heterogeneity, and Publication Bias
| Effect Size and 95% Confidence Interval | Heterogeneity | Egger’s Test | ||||||||||
|---|---|---|---|---|---|---|---|---|---|---|---|---|
| Correlate | Effects (k) | r | Lower Limit | Upper Limit | Z | p | Q | df | p | I 2 | B0 (SE) | p (1 tailed) |
| Concurrent | ||||||||||||
| Psychosocial Health | ||||||||||||
| Negative Mental Health | 75 | 0.431 | 0.399 | 0.463 | 23.117 | <.001 | 806.398 | 74 | <.001 | 90.823 | −0.471 (0.549) | .197 |
| Positive Mental Health | 38 | −0.437 | −0.525 | −0.341 | −8.050 | <.001 | 1116.400 | 37 | <.001 | 96.686 | 0.841 (2.507) | .370 |
| Emotion Dysregulation | 3 | 0.474 | 0.354 | 0.579 | 6.922 | <.001 | 4.842 | 2 | .089 | 58.697 | −6.393 (0.877) | .043 |
| Self-Compassion | 11 | −0.506 | −0.577 | −0.427 | −10.826 | <.001 | 70.028 | 10 | <.001 | 85.720 | −4.705 (1.429) | .005 |
| Social Functioning | 6 | −0.283 | −0.416 | −0.139 | −3.773 | <.001 | 41.374 | 5 | <.001 | 87.915 | −8.745 (3.481) | .033 |
| Physical Health | ||||||||||||
| Body Mass Index | 127 | 0.267 | 0.242 | 0.292 | 19.803 | <.001 | 1350.803 | 126 | <.001 | 90.672 | −1.830 (0.401) | <.001 |
| Weight Cycling | 4 | 0.215 | 0.179 | 0.251 | 11.405 | <.001 | 1.389 | 3 | .708 | 0.000 | 0.404 (0.669) | .304 |
| Self-Perceived Weight | 8 | 0.421 | 0.257 | 0.562 | 4.717 | <.001 | 153.819 | 7 | <.001 | 95.449 | 6.782 (3.892) | .066 |
| Physical Health | 6 | −0.285 | −0.353 | −0.214 | −7.556 | <.001 | 9.215 | 5 | .101 | 45.742 | −0.735 (1.208) | .288 |
| Weight-Related QoL | 14 | −0.618 | −0.674 | −0.556 | −14.829 | <.001 | 56.432 | 13 | <.001 | 76.963 | −0.953 (1.555) | .276 |
| Global HRQoL | 17 | −0.378 | −0.442 | −0.310 | −10.113 | <.001 | 194.595 | 16 | <.001 | 91.778 | −1.297 (1.040) | .116 |
| Physical HRQoL | 16 | −0.232 | −0.324 | −0.136 | −4.655 | <.001 | 314.889 | 15 | <.001 | 95.236 | −1.439 (1.429) | .166 |
| Mental HRQoL | 15 | −0.464 | −0.517 | −0.407 | −14.116 | <.001 | 176.049 | 14 | <.001 | 92.048 | −0.246 (1.252) | .424 |
| Healthcare Use / Engagement | 7 | 0.042 | −0.118 | 0.199 | 0.509 | .610 | 54.656 | 6 | <.001 | 89.022 | −0.160 (2.501) | .476 |
| Behavioral Health | ||||||||||||
| Global Eating Disorder Pathology | 78 | 0.394 | 0.342 | 0.443 | 13.579 | <.001 | 2488.061 | 77 | <.001 | 96.905 | −2.606 (0.910) | .003 |
| Disinhibited Eating | 52 | 0.426 | 0.387 | 0.463 | 19.345 | <.001 | 584.307 | 51 | <.001 | 91.272 | −2.524 (0.546) | <.001 |
| Dietary Restraint | 44 | 0.243 | 0.169 | 0.314 | 6.310 | <.001 | 1153.060 | 43 | <.001 | 96.271 | −1.219 (1.600) | .225 |
| Compensatory Behaviors | 9 | 0.145 | 0.071 | 0.217 | 3.845 | <.001 | 49.446 | 8 | <.001 | 83.821 | −4.713 (1.539) | .009 |
| Eating Concerns | 14 | 0.396 | 0.187 | 0.572 | 3.566 | <.001 | 388.972 | 13 | <.001 | 96.658 | 1.278 (4.748) | .396 |
| Healthy Eating | 15 | −0.267 | −0.432 | −0.086 | −2.859 | .004 | 548.364 | 14 | <.001 | 97.447 | 2.746 (3.792) | .241 |
| Physical Activity | 20 | −0.123 | −0.163 | −0.084 | −6.046 | <.001 | 44.502 | 19 | .001 | 57.306 | 0.545 (0.413) | .102 |
| PA Barriers | 16 | 0.170 | 0.094 | 0.245 | 4.354 | <.001 | 56.812 | 15 | <.001 | 73.597 | 0.544 (1.288) | .340 |
| PA Motivation | 4 | −0.157 | −0.337 | 0.035 | −1.608 | .108 | 35.251 | 3 | <.001 | 91.490 | −9.379 (7.020) | .157 |
| PA Intentions | 4 | 0.059 | −0.013 | 0.130 | 1.615 | .106 | 4.198 | 3 | .241 | 28.536 | −0.760 (2.141) | .378 |
| PA Self-Efficacy | 8 | −0.191 | −0.302 | −0.074 | −3.186 | .001 | 28.851 | 7 | <.001 | 75.737 | −0.058 (1.832) | .488 |
| Prospective | ||||||||||||
| Weight Loss | 3 | −0.422 | −0.694 | −0.043 | −2.165 | .030 | 22.964 | 2 | <.001 | 91.291 | 11.016 (12.376) | .269 |
| Negative Mental Health | 3 | 0.247 | 0.058 | 0.419 | 2.549 | .011 | 35.831 | 2 | <.001 | 94.418 | 1.191 (8.283) | .455 |
| Retrospective | ||||||||||||
| Weight Loss | 6 | −0.044 | −0.182 | 0.096 | −0.609 | .542 | 48.839 | 5 | <.001 | 89.762 | −1.024 (3.218) | .383 |
Note. Random effects meta-analysis results are reported; WBI was assessed prior to the respective correlate in prospective models; WBI was assessed after the respective correlate in retrospective models; HRQoL = health-related quality of life; QoL = quality of life; PA = physical activity.
Data Collection
Key descriptive and quantitative information were extracted from each article by all study coders. These data included: (1) sample and study-level characteristics (e.g., demographics, population); (2) information needed to compute overall effect sizes (e.g., zero-order correlation, analytic n); (3) information needed to assess the risk of study bias (see Supplement F). Article screening to determine whether potentially eligible studies met the present inclusion criteria was completed by the first author for all studies and was confirmed by two research assistants who each independently assessed one-half of the potential studies. The first author coded all eligible studies. Four additional coders, first, independently coded the same three articles to ensure that all coders extracted data uniformly and, subsequently, each independently coded one-fourth of the remaining articles. The average percent agreement between coders across the coded variables was high (97.29%). In addition to data extracted from the articles, 77 authors were contacted in cases wherein insufficient data were presented to calculate some or all effect sizes and when authors’ reported results implied that they had relevant data (e.g., reported using a measure of WBI and at least one relevant correlate); 41 authors replied and 23 provided requested data.
Risk of Bias and Study Quality
As shown in Supplement F, a risk of bias and study quality index was derived using criteria modified from the National Heart, Lung, and Blood Institutes’ Quality Assessment Tool for Observational Cohort and Cross-Sectional Studies (https://www.nhlbi.nih.gov/health-topics/study-quality-assessment-tools) and the Newcastle-Ottawa Quality Assessment Scale (Wells et al., 2000). Each criterion was rated as present (1) or absent (0) and a total (summed) score was derived for each study (possible range=0–9). Higher scores reflect greater study quality and lower risk of bias. The average percent agreement between coders in deriving this index was high (86.85%). Score disagreements were resolved by discussion to derive final study ratings.
Contacting authors to obtain unpublished data helps decrease the influence of publication bias. To further decrease this potential impact, funnel plots were used to assess associations between precision (the inverse of the standard error, a function of sample size) and effect sizes. If publication bias is evident, the assessed studies will exhibit an asymmetric distribution around the aggregate effect size (Schmidt & Hunter, 2015). Egger’s test of the intercept was used to confirm these graphical data, and suggests publication bias exists based on a statistically significant value. Significant Egger’s tests were addressed via Duval and Tweedie’s Trim and Fill method, which uses an iterative process to trim and impute studies that are potentially missing and then recompute the overall effect. This procedure provides an estimate of what the overall effect would be if there was no evidence of publication bias (Schmidt & Hunter, 2015).
Data Analyses
Data analyses were conducted using the Comprehensive Meta-Analysis Version 3.0 software. Overall effects for associations between WBI and each covariate were assessed using zero-order correlation coefficients (r) in random effects meta-analysis models. These models assume that the variability in effects results from within-study sampling error and variance between studies that is presumed to stem from differences in study procedures (Schmidt & Hunter, 2015). The magnitude of these effects can be interpreted as small (.10), medium (.30), or large (.50; Cohen, 1992). Models that included concurrent or prospective (WBI → correlates), and retrospective (correlates → WBI) associations were run separately. To ensure that the assumption of independence was met, each study (e.g., publication versus dissertation with the same data) or subsample (e.g., data presented separately for females and males) was allowed to contribute only one effect to each overall effect size. Consequently, in cases wherein studies provided data for multiple measures of a given construct (e.g., two measures of negative mental health), these data were averaged for use in overall effect size calculations, per recommended procedures (Schmidt & Hunter, 2015). Further, when multiple papers for a study presented similar data for a (sub)sample, those with larger analytic samples were used.
The heterogeneity of overall effect size distributions was examined using the Cochran Q and I2 statistics. Cochran’s Q assesses the statistical significance of heterogeneity and the I2 statistic determines the proportion of total variability in a set of effect sizes that can be attributed to between-study differences (Huedo-Medina et al., 2006). The I2 statistic is interpreted as reflecting low (25%), medium (50%) and high (75%) between-study variability.
Significant overall effect sizes that exhibited significant and large heterogeneity, as indicated by significant Q values and/or I2 statistic ≥75%, were further assessed using random-effects meta-regression models with maximum likelihood estimation. These analyses were only run for models that included at least 10 effects, per recommended procedures (Borenstein et al., 2009). Specifically, separate univariate meta-regression models were run with the following moderators: publication status (peer-reviewed=0, unpublished=1), sex/gender (percentage of females), mean age, race (percentage of participants who identified as White), mean BMI, sample type (dummy coded variable: community, non-surgical weight loss treatment-seeking [referent], bariatric surgery, college/university, multiple), and study quality. For sample type, non-surgical weight loss treatment-seeking and bariatric surgery categories were combined in models in which there were non-significant differences between these groups for parsimony. For models that examined the association between WBI and BMI, additional moderators included whether samples included participants with overweight or obesity only (1) versus participants of any weight (0) and whether BMI was objectively assessed (1) versus self-reported (0).
Results
Study characteristics are presented in a table in Supplement A. The 163 articles (137 studies) included between 14 and 18,766 participants (M = 534.96, SD = 1914.43) and provided data for 149 unique (sub)samples of participants. Data from 121 (81.21%) (sub)samples were reported in peer-reviewed publications and 28 (18.79%) in unpublished theses, dissertations, or conference presentations. Further, there were 32 (21.48%) non-surgical weight loss treatment-seeking (sub)samples, 11 (7.38%) bariatric surgery (sub)samples, 68 (45.64%) (sub)samples recruited from the community, 32 (21.48%) from colleges or universities, and 6 (4.03%) that combined data from more than one of these sample types. Participants’ mean age was 34.73 (SD = 12.61; range = 9.95–65.70) and mean BMI was 31.43 (SD = 6.95; range = 16.22–48.92). Studies were over-represented by females (M% female = 73.24, SD = 26.31; range = 0–100.00) and individuals who identified as White (M% White = 69.06, SD = 22.63; range = 0–100.00). There were 77 (52.38%) (sub)samples that included participants of any weight and 70 (47.62%) (sub)samples that included participants with overweight or obesity only. Participants in most (k=82, 60.29%) (sub)samples resided in the U.S only. The average study quality/risk of bias rating score was 6.07 (SD = 1.18; range = 3–9). The most commonly reported measures of WBI were the modified (Pearl & Puhl, 2014) and the original (Durso & Latner, 2008) WBI Scale and the Weight Self-Stigma Questionnaire (Lillis et al., 2010). All correlates except for objective BMI were self-report measures.
Overall Effects
Overall effect sizes and heterogeneity for associations between WBI and the assessed health-related correlates are presented in Table 1 and forest plots are presented in Supplement B.
Psychosocial Health
Moderate to large effects were identified for concurrent associations between greater WBI and worse positive (e.g., positive affect, self-esteem) and negative (e.g., negative affect, depressive and anxiety symptoms) mental health, and emotion dysregulation (rs=−0.437 to 0.474). Although there were few effects (k=3), greater WBI also exhibited a small to moderate prospective association with increased negative mental health (r=0.247). Further, moderate to large effects were found for concurrent associations between greater WBI and worse self-compassion and social functioning (rs=−0.506 and −0.283, respectively). No retrospective effects were identified for psychosocial correlates of WBI.
Physical Health
Greater WBI exhibited small to large concurrent associations with weight-related measures, including higher BMI, more weight cycling (i.e., less weight maintenance), and greater self-perceived weight status (rs=0.215 to 0.421). The positive association between WBI and self-perceived weight status was notably larger (r=0.421) than that using self-reported or objectively measured BMI data (r=0.267). Although there were few effects overall (k=3 and 6, respectively), preliminary prospective evidence suggested that greater WBI was robustly associated with less subsequent weight loss (r=−0.422) and that retrospective reports of earlier weight loss were not associated with later WBI.
Greater WBI was also concurrently associated with worse physical health, global, physical, and mental HRQoL, and weight-related quality of life, with effects that were small to very large in magnitude (rs=−0.232 to −0.618). The negative association between WBI and weight-related quality of life was approximately two times as large (r=−0.618) as that for global HRQoL (r=−0.378). WBI was not associated with individuals’ healthcare use or engagement. No other prospective or retrospective effects were identified for physical health correlates of WBI.
Behavioral Health
A moderate to large concurrent association was found between greater WBI and worse global eating disorder pathology (r=0.394). Effects spanned from small to large (rs=0.145 to 0.426) when specific symptoms were concurrently assessed, including disinhibited eating (e.g., binge eating, overeating, emotional eating), dietary restraint, compensatory behaviors, and cognitive eating concerns. There was a moderate concurrent association between greater WBI and poorer healthy eating (r=−0.267).
Greater WBI was concurrently associated with less physical activity and more perceived barriers to physical activity, with effects that were small (rs= −0.123 and 0.170, respectively). More WBI was also concurrently associated with less physical activity self-efficacy (r=−0.191), but was not associated with individuals’ motivation or intentions to engage in physical activity. No prospective or retrospective effects were identified for behavioral health correlates of WBI.
Publication Bias
Visual examination of funnel plots (see Supplement C) and Egger’s regression test (Table 1) suggested that publication bias may be evident for the models that examined concurrent associations between WBI and BMI, emotion dysregulation, global eating disorder pathology, disinhibited eating, compensatory behaviors, social functioning, and self-compassion. To assess this potential impact, Duval and Tweedie’s Trim and Fill procedure was used. There were minimal differences between original model estimates and adjusted correlations following the imputation of studies identified as missing via this procedure. Specifically, as shown in Supplement C, adjusted correlations exhibited slight increases in magnitude for BMI, emotion dysregulation, and compensatory behaviors (Δr=0.040–0.084), small decreases for global eating disorder pathology and disinhibited eating (Δr=0.032–0.117), and no changes for self-compassion or social functioning (Δr=0).
Moderator Analyses
Results of univariate meta-regressions examining moderators of overall effect magnitude for models with sufficient data (k≥10; all concurrent associations) are presented in Table 2. Graphical depictions of models with significant moderators are presented in Supplement D.
Table 2.
Univariate Random Effects Meta-Regressions for Moderators of Associations Between WBI and Health-Related Correlates
| Outcome | Covariate | k | Coefficient | SE | 95% CI Lower | 95% CI Upper | Z | p | Q | df | p | R2 Analog |
|---|---|---|---|---|---|---|---|---|---|---|---|---|
| Psychosocial Health | ||||||||||||
| Negative Mental Health | Publication Status | 75 | −0.048 | 0.056 | −0.157 | 0.062 | −0.85 | .393 | 0.73 | 1 | .393 | 0.01 |
| Sex/Gender | 73 | 0.001 | 0.001 | −0.001 | 0.002 | 1.00 | .316 | 1.00 | 1 | .316 | 0.02 | |
| Age | 72 | 0.001 | 0.001 | −0.002 | 0.004 | 0.61 | .539 | 0.38 | 1 | .539 | 0.01 | |
| Race | 50 | 0.001 | 0.001 | −0.001 | 0.003 | 1.44 | .151 | 2.07 | 1 | .151 | 0.09 | |
| BMI | 69 | 0.005 | 0.003 | −0.001 | 0.010 | 1.66 | .100 | 2.74 | 1 | .100 | 0.06 | |
| Population: Community | 75 | −0.082 | 0.043 | −0.167 | 0.003 | −1.89 | .059 | 5.89 | 3 | .117 | 0.11 | |
| Population: College / University | 75 | −0.054 | 0.055 | −0.161 | 0.054 | −0.98 | .328 | 5.89 | 3 | .117 | 0.11 | |
| Population: Multiple | 75 | 0.071 | 0.083 | −0.093 | 0.234 | 0.85 | .396 | 5.89 | 3 | .117 | 0.11 | |
| Study Quality | 75 | 0.022 | 0.018 | −0.012 | 0.057 | 1.28 | .202 | 1.63 | 1 | .202 | 0.01 | |
| Positive Mental Health | Publication Status | 38 | −0.026 | 0.165 | −0.349 | 0.297 | −0.16 | .874 | 0.03 | 1 | .874 | 0.00 |
| Sex/Gender | 38 | −0.003 | 0.002 | −0.008 | 0.002 | −1.25 | .213 | 1.55 | 1 | .213 | 0.04 | |
| Age | 37 | 0.002 | 0.005 | −0.008 | 0.012 | 0.33 | .740 | 0.11 | 1 | .740 | 0.00 | |
| Race | 27 | 0.002 | 0.004 | −0.005 | 0.009 | 0.62 | .535 | 0.39 | 1 | .535 | 0.01 | |
| BMI | 31 | −0.017 | 0.010 | −0.036 | 0.002 | −1.78 | .075 | 3.16 | 1 | .075 | 0.10 | |
| Population: Community | 38 | 0.293 | 0.133 | 0.032 | 0.555 | 2.20 | .028 | 6.45 | 3 | .092 | 0.15 | |
| Population: College / University | 38 | 0.158 | 0.158 | −0.153 | 0.468 | 1.00 | .320 | 6.45 | 3 | .092 | 0.15 | |
| Population: Multiple | 38 | −0.083 | 0.220 | −0.513 | 0.348 | −0.38 | .707 | 6.45 | 3 | .092 | 0.15 | |
| Study Quality | 38 | −0.085 | 0.047 | −0.177 | 0.006 | −1.83 | .067 | 3.35 | 1 | .067 | 0.08 | |
| Self-Compassion | Publication Status | 11 | 0.016 | 0.094 | −0.169 | 0.201 | 0.17 | .868 | 0.03 | 1 | .868 | 0.00 |
| Sex/Gender | 11 | −0.002 | 0.002 | −0.006 | 0.001 | −1.23 | .219 | 1.51 | 1 | .219 | 0.19 | |
| Age | 11 | 0.003 | 0.004 | −0.004 | 0.010 | 0.77 | .443 | 0.59 | 1 | .443 | 0.12 | |
| Race | 7 | −0.004 | 0.002 | −0.009 | 0.0001 | −1.90 | .058 | 3.59 | 1 | .058 | 0.80 | |
| BMI | 8 | −0.005 | 0.007 | −0.019 | 0.008 | −0.76 | .450 | 0.57 | 1 | .450 | 0.08 | |
| Population: Community | 11 | 0.102 | 0.114 | −0.122 | 0.326 | 0.90 | .370 | 3.50 | 3 | .320 | 0.32 | |
| Population: College / University | 11 | 0.141 | 0.121 | −0.097 | 0.379 | 1.16 | .246 | 3.50 | 3 | .320 | 0.32 | |
| Population: Multiple | 11 | −0.036 | 0.127 | −0.286 | 0.214 | −0.28 | .776 | 3.50 | 3 | .320 | 0.32 | |
| Study Quality | 11 | 0.001 | 0.036 | −0.069 | 0.071 | 0.04 | .971 | 0.00 | 1 | .971 | 0.00 | |
| Physical Health | ||||||||||||
| Body Mass Index | Publication Status | 127 | 0.040 | 0.047 | −0.051 | 0.132 | 0.87 | .385 | 0.76 | 1 | .385 | 0.01 |
| Sex/Gender | 125 | 0.0001 | 0.001 | −0.001 | 0.001 | 0.10 | .917 | 0.01 | 1 | .917 | 0.00 | |
| Age | 124 | −0.003 | 0.001 | −0.005 | −0.0001 | −2.02 | .044 | 4.06 | 1 | .044 | 0.04 | |
| Race | 87 | 0.0002 | 0.001 | −0.002 | 0.002 | 0.17 | .862 | 0.03 | 1 | .862 | 0.00 | |
| Population: Community | 127 | 0.132 | 0.036 | 0.061 | 0.203 | 3.66 | <.001 | 23.47 | 3 | <.001 | 0.17 | |
| Population: College / University | 127 | 0.177 | 0.043 | 0.093 | 0.262 | 4.11 | <.001 | 23.47 | 3 | <.001 | 0.17 | |
| Population: Multiple | 127 | 0.241 | 0.074 | 0.096 | 0.386 | 3.25 | .001 | 23.47 | 3 | <.001 | 0.17 | |
| Study Quality | 127 | 0.017 | 0.015 | −0.012 | 0.047 | 1.14 | .253 | 1.31 | 1 | .253 | 0.02 | |
| OW or OB Only | 127 | −0.190 | 0.027 | −0.243 | −0.138 | −7.10 | <.001 | 50.38 | 1 | <.001 | 0.36 | |
| Objective vs. Self-Reported BMI | 123 | −0.107 | 0.036 | −0.178 | −0.037 | −2.97 | .003 | 8.81 | 1 | .003 | 0.06 | |
| Weight-Related Quality of Life | Publication Status | 14 | −0.167 | 0.178 | −0.516 | 0.183 | −0.93 | .350 | 0.87 | 1 | .350 | 0.06 |
| Sex/Gender | 14 | −0.001 | 0.002 | −0.005 | 0.003 | −0.44 | .663 | 0.19 | 1 | .663 | 0.00 | |
| Age | 14 | 0.001 | 0.003 | −0.006 | 0.008 | 0.34 | .738 | 0.11 | 1 | .738 | 0.01 | |
| Race | 7 | −0.001 | 0.002 | −0.005 | 0.004 | −0.25 | .804 | 0.06 | 1 | .804 | 0.00 | |
| BMI | 12 | 0.009 | 0.006 | −0.002 | 0.020 | 1.67 | .095 | 2.80 | 1 | .095 | 0.17 | |
| Population a : Community | 14 | 0.180 | 0.124 | −0.062 | 0.423 | 1.46 | .145 | 10.26 | 3 | .017 | 0.57 | |
| Population a : Bariatric | 14 | 0.340 | 0.111 | 0.122 | 0.559 | 3.06 | .002 | 10.26 | 3 | .017 | 0.57 | |
| Population a : College / University | 14 | 0.084 | 0.094 | −0.100 | 0.268 | 0.89 | .371 | 10.26 | 3 | .017 | 0.57 | |
| Study Quality | 14 | −0.090 | 0.042 | −0.174 | −0.007 | −2.14 | .033 | 4.56 | 1 | .033 | 0.36 | |
| Global HRQoL | Publication Status | 17 | 0.107 | 0.184 | −0.254 | 0.467 | 0.58 | .562 | 0.34 | 1 | .562 | 0.01 |
| Sex/Gender | 17 | 0.001 | 0.001 | −0.001 | 0.003 | 0.67 | .503 | 0.45 | 1 | .503 | 0.08 | |
| Age | 17 | 0.001 | 0.002 | −0.003 | 0.005 | 0.65 | .513 | 0.43 | 1 | .513 | 0.02 | |
| Race | 11 | 0.002 | 0.002 | −0.002 | 0.005 | 0.84 | .404 | 0.70 | 1 | .404 | 0.13 | |
| BMI | 15 | −0.003 | 0.004 | −0.011 | 0.005 | −0.67 | .505 | 0.44 | 1 | .505 | 0.00 | |
| Populationa: Community | 17 | −0.071 | 0.062 | −0.192 | 0.051 | −1.14 | .256 | 2.30 | 2 | .316 | 0.17 | |
| Populationa: College / University | 17 | 0.055 | 0.082 | −0.105 | 0.215 | 0.67 | .501 | 2.30 | 2 | .316 | 0.17 | |
| Study Quality | 17 | −0.039 | 0.027 | −0.092 | 0.014 | −1.44 | .150 | 2.07 | 1 | .150 | 0.06 | |
| Physical HRQoL | Publication Status | 16 | −0.068 | 0.147 | −0.356 | 0.220 | −0.46 | .644 | 0.21 | 1 | .644 | 0.03 |
| Sex/Gender | 16 | 0.002 | 0.002 | −0.001 | 0.005 | 1.50 | .135 | 2.24 | 1 | .135 | 0.21 | |
| Age | 16 | 0.001 | 0.003 | −0.005 | 0.007 | 0.33 | .740 | 0.11 | 1 | .740 | 0.03 | |
| Race | 11 | −0.0001 | 0.003 | −0.005 | 0.005 | −0.03 | .979 | 0.00 | 1 | .979 | 0.00 | |
| BMI | 15 | 0.016 | 0.005 | 0.005 | 0.026 | 2.97 | .003 | 8.82 | 1 | .003 | 0.50 | |
| Population a : Community | 16 | −0.237 | 0.076 | −0.386 | −0.089 | −3.14 | .002 | 13.72 | 2 | .001 | 0.60 | |
| Population a : College / University | 16 | −0.247 | 0.085 | −0.413 | −0.081 | −2.92 | .004 | 13.72 | 2 | .001 | 0.60 | |
| Study Quality | 16 | 0.030 | 0.042 | −0.052 | 0.112 | 0.71 | .475 | 0.51 | 1 | .475 | 0.03 | |
| Mental HRQoL | Publication Status | 15 | −0.064 | 0.216 | −0.486 | 0.359 | −0.30 | .767 | 0.09 | 1 | .767 | 0.00 |
| Sex/Gender | 15 | −0.0002 | 0.001 | −0.002 | 0.002 | −0.19 | .846 | 0.04 | 1 | .846 | 0.00 | |
| Age | 15 | −0.005 | 0.003 | −0.011 | 0.000 | −1.97 | .049 | 3.87 | 1 | .049 | 0.26 | |
| Race | 10 | 0.003 | 0.002 | −0.001 | 0.006 | 1.68 | .092 | 2.83 | 1 | .092 | 0.46 | |
| BMI | 14 | −0.005 | 0.006 | −0.017 | 0.006 | −0.91 | .361 | 0.83 | 1 | .361 | 0.05 | |
| Populationa: Community | 15 | −0.046 | 0.077 | −0.196 | 0.104 | −0.60 | .546 | 4.79 | 2 | .091 | 0.31 | |
| Populationa: College / University | 15 | 0.189 | 0.109 | −0.025 | 0.403 | 1.73 | .083 | 4.79 | 2 | .091 | 0.31 | |
| Study Quality | 15 | −0.070 | 0.035 | −0.139 | −0.001 | −1.99 | .047 | 3.95 | 1 | .047 | 0.22 | |
| Behavioral Health | ||||||||||||
| Global Eating Disorder Pathology | Publication Status | 78 | 0.028 | 0.096 | −0.161 | 0.217 | 0.29 | .769 | 0.09 | 1 | .769 | 0.00 |
| Sex/Gender | 76 | 0.001 | 0.001 | −0.001 | 0.004 | 1.03 | .304 | 1.06 | 1 | .304 | 0.01 | |
| Age | 76 | 0.0003 | 0.003 | −0.005 | 0.006 | 0.09 | .926 | 0.01 | 1 | .926 | 0.00 | |
| Race | 56 | −0.001 | 0.002 | −0.005 | 0.003 | −0.49 | .624 | 0.24 | 1 | .624 | 0.01 | |
| BMI | 71 | −0.001 | 0.005 | −0.011 | 0.009 | −0.19 | .847 | 0.04 | 1 | .847 | 0.00 | |
| Population: Community | 78 | −0.006 | 0.081 | −0.165 | 0.153 | −0.07 | .941 | 1.49 | 3 | .684 | 0.02 | |
| Population: College / University | 78 | −0.079 | 0.091 | −0.257 | 0.098 | −0.88 | .381 | 1.49 | 3 | .684 | 0.02 | |
| Population: Multiple | 78 | 0.090 | 0.161 | −0.226 | 0.405 | 0.56 | .577 | 1.49 | 3 | .684 | 0.02 | |
| Study Quality | 78 | −0.0003 | 0.029 | −0.057 | 0.056 | −0.01 | .990 | 0.00 | 1 | .990 | 0.00 | |
| Disinhibited Eating | Publication Status | 52 | 0.123 | 0.061 | 0.002 | 0.243 | 2.00 | .046 | 3.98 | 1 | .046 | 0.09 |
| Sex/Gender | 50 | 0.001 | 0.001 | −0.001 | 0.002 | 0.50 | .616 | 0.25 | 1 | .616 | 0.01 | |
| Age | 50 | 0.002 | 0.002 | −0.002 | 0.005 | 0.86 | .389 | 0.74 | 1 | .389 | 0.02 | |
| Race | 39 | 0.001 | 0.001 | −0.001 | 0.004 | 1.06 | .287 | 1.13 | 1 | .287 | 0.04 | |
| BMI | 50 | −0.001 | 0.003 | −0.007 | 0.005 | −0.41 | .680 | 0.17 | 1 | .680 | 0.00 | |
| Population: Community | 52 | −0.019 | 0.054 | −0.124 | 0.086 | −0.35 | .724 | 0.54 | 3 | .909 | 0.01 | |
| Population: College / University | 52 | 0.019 | 0.057 | −0.093 | 0.130 | 0.32 | .745 | 0.54 | 3 | .909 | 0.01 | |
| Population: Multiple | 52 | 0.031 | 0.088 | −0.140 | 0.203 | 0.36 | .720 | 0.54 | 3 | .909 | 0.01 | |
| Study Quality | 52 | −0.003 | 0.019 | −0.039 | 0.034 | −0.14 | .892 | 0.02 | 1 | .892 | 0.00 | |
| Dietary Restraint | Publication Status | 44 | 0.169 | 0.185 | −0.194 | 0.531 | 0.91 | .362 | 0.83 | 1 | .362 | 0.02 |
| Sex/Gender | 44 | 0.001 | 0.002 | −0.003 | 0.004 | 0.28 | .777 | 0.08 | 1 | .777 | 0.00 | |
| Age | 42 | −0.010 | 0.003 | −0.017 | −0.004 | −3.07 | .002 | 9.45 | 1 | .002 | 0.20 | |
| Race | 32 | −0.002 | 0.003 | −0.008 | 0.003 | −0.86 | .388 | 0.75 | 1 | .388 | 0.03 | |
| BMI | 39 | −0.020 | 0.007 | −0.033 | −0.007 | −3.00 | .003 | 8.98 | 1 | .003 | 0.20 | |
| Population: Community | 44 | 0.269 | 0.096 | 0.081 | 0.457 | 2.80 | .005 | 13.36 | 3 | .004 | 0.24 | |
| Population: College / University | 44 | 0.389 | 0.119 | 0.156 | 0.623 | 3.27 | .001 | 13.36 | 3 | .004 | 0.24 | |
| Population: Multiple | 44 | 0.376 | 0.169 | 0.045 | 0.706 | 2.23 | .026 | 13.36 | 3 | .004 | 0.24 | |
| Study Quality | 44 | 0.022 | 0.035 | −0.046 | 0.089 | 0.62 | .533 | 0.39 | 1 | .533 | 0.01 | |
| Eating Concerns | Publication Status | 14 | −0.141 | 0.343 | −0.813 | 0.532 | −0.41 | .682 | 0.17 | 1 | .682 | 0.01 |
| Sex/Gender | 14 | −0.0003 | 0.003 | −0.006 | 0.006 | −0.09 | .927 | 0.01 | 1 | .927 | 0.00 | |
| Age | 14 | 0.004 | 0.008 | −0.011 | 0.019 | 0.48 | .633 | 0.23 | 1 | .633 | 0.02 | |
| Race | 7 | −0.006 | 0.006 | −0.017 | 0.005 | −1.13 | .259 | 1.27 | 1 | .259 | 0.16 | |
| BMI | 12 | 0.007 | 0.014 | −0.020 | 0.034 | 0.51 | .610 | 0.26 | 1 | .610 | 0.02 | |
| Populationa: Community | 14 | 0.102 | 0.165 | −0.221 | 0.425 | 0.62 | .537 | 5.50 | 2 | .064 | 0.30 | |
| Populationa: College / University | 14 | −0.433 | 0.222 | −0.869 | 0.003 | −1.95 | .052 | 5.50 | 2 | .064 | 0.30 | |
| Study Quality | 14 | −0.050 | 0.082 | −0.211 | 0.112 | −0.60 | .548 | 0.36 | 1 | .548 | 0.03 | |
| Healthy Eating | Publication Status | 15 | −0.027 | 0.216 | −0.449 | 0.396 | −0.12 | .902 | 0.02 | 1 | .902 | 0.00 |
| Sex/Gender | 15 | 0.001 | 0.005 | −0.008 | 0.010 | 0.23 | .821 | 0.05 | 1 | .821 | 0.00 | |
| Age | 14 | 0.010 | 0.007 | −0.004 | 0.025 | 1.41 | .158 | 2.00 | 1 | .158 | 0.14 | |
| Race | 13 | 0.003 | 0.006 | −0.009 | 0.016 | 0.50 | .617 | 0.25 | 1 | .617 | 0.02 | |
| BMI | 14 | 0.040 | 0.012 | 0.016 | 0.064 | 3.30 | .001 | 10.90 | 1 | .001 | 0.45 | |
| Population: Community | 15 | −0.006 | 0.162 | −0.323 | 0.311 | −0.04 | .970 | 10.54 | 3 | .015 | 0.44 | |
| Population: College / University | 15 | −0.471 | 0.197 | −0.857 | −0.084 | −2.38 | .017 | 10.54 | 3 | .015 | 0.44 | |
| Population: Multiple | 15 | −0.526 | 0.280 | −1.073 | 0.022 | −1.88 | .060 | 10.54 | 3 | .015 | 0.44 | |
| Study Quality | 15 | −0.106 | 0.051 | −0.207 | −0.006 | −2.07 | .038 | 4.29 | 1 | .038 | 0.23 | |
| Physical Activity | Publication Status | 20 | 0.106 | 0.061 | −0.014 | 0.226 | 1.73 | .084 | 2.98 | 1 | .084 | 0.31 |
| Sex/Gender | 20 | −0.0004 | 0.001 | −0.003 | 0.002 | −0.37 | .711 | 0.14 | 1 | .711 | 0.01 | |
| Age | 19 | 0.0000 | 0.002 | −0.004 | 0.004 | 0.01 | .994 | 0.00 | 1 | .994 | 0.00 | |
| Race | 14 | −0.002 | 0.001 | −0.004 | −0.001 | −3.24 | .001 | 10.52 | 1 | .001 | 1.00 | |
| BMI | 19 | 0.003 | 0.005 | −0.006 | 0.012 | 0.73 | .465 | 0.53 | 1 | .465 | 0.06 | |
| Populationa: Community | 20 | 0.061 | 0.047 | −0.032 | 0.153 | 1.28 | .200 | 1.65 | 2 | .439 | 0.11 | |
| Populationa: College / University | 20 | 0.031 | 0.090 | −0.145 | 0.208 | 0.35 | .728 | 1.65 | 2 | .439 | 0.11 | |
| Study Quality | 20 | 0.029 | 0.020 | −0.009 | 0.067 | 1.48 | .138 | 2.20 | 1 | .138 | 0.11 | |
| Physical Activity Barriers | Publication Status | 16 | −0.009 | 0.085 | −0.174 | 0.157 | −0.10 | .919 | 0.01 | 1 | .919 | 0.01 |
| Sex/Gender | 16 | 0.002 | 0.001 | −0.001 | 0.004 | 1.02 | .309 | 1.03 | 1 | .309 | 0.03 | |
| Age | 15 | 0.003 | 0.004 | −0.004 | 0.010 | 0.94 | .345 | 0.89 | 1 | .345 | 0.13 | |
| Race | 9 | −0.001 | 0.003 | −0.007 | 0.004 | −0.38 | .706 | 0.14 | 1 | .706 | 0.09 | |
| BMI | 15 | 0.0004 | 0.008 | −0.015 | 0.016 | 0.05 | .957 | 0.00 | 1 | .957 | 0.01 | |
| Population a : Community | 16 | −0.092 | 0.071 | −0.231 | 0.047 | −1.29 | .196 | 6.37 | 2 | .041 | 0.46 | |
| Population a : College / University | 16 | −0.299 | 0.119 | −0.532 | −0.066 | −2.51 | .012 | 6.37 | 2 | .041 | 0.46 | |
| Study Quality | 16 | −0.051 | 0.022 | −0.094 | −0.007 | −2.27 | .023 | 5.16 | 1 | .023 | 0.49 | |
Note. All presented models reflect associations between WBI and the respective correlates for analyses with sufficient data (k≥10); all models used maximum likelihood estimation; publication status = peer-reviewed (0), unpublished (1); sex/gender = percentage of female participants per sample; race = percentage of participants who identified as White per sample; population = a dummy coded variable set with the following categories: community, non-surgical weight loss treatment-seeking (referent category), bariatric, college/university, multiple; for population, non-surgical weight loss treatment-seeking and bariatric categories were combined in models wherein there were non-significant differences between these groups; OW or OB only = non-weight restricted samples (0), samples comprised of participants with overweight or obesity only (1); objective BMI = self-reported BMI (0), objectively measured BMI (1).
No studies in this model included participants with multiple sample types
Psychosocial Health
None of the assessed moderators significantly influenced associations between WBI and any of the psychosocial health correlates with sufficient data (k≥10).
Physical Health
The positive association between WBI and BMI was larger in studies with younger participants (R2analogue=0.04), samples of participants of any weight (versus studies with participants with overweight/obesity; R2analogue=0.36), studies with self-reported BMI data (versus objectively assessed; R2analogue=0.06), and community samples, college/university samples, and studies with multiple sample types (versus non-surgical weight loss treatment seeking and bariatric surgery samples; R2analogue=0.17).
The negative association between WBI and weight-related quality of life was larger in studies with greater quality (R2analogue=0.36) and was smaller in bariatric samples (versus non-surgical weight loss treatment-seeking samples; R2analogue=0.57). The negative association between WBI and physical HRQoL was larger in samples with smaller BMIs (R2analogue=0.50) and in community and college/university samples (versus non-surgical weight loss treatment-seeking and bariatric samples; R2analogue=0.60). In contrast, the negative association between WBI and mental HRQoL was larger in older samples (R2analogue=0.26) and studies with greater quality (R2analogue=0.22).
Behavioral Health
The positive association between WBI and disinhibited eating was larger in unpublished studies versus peer-reviewed publications (R2analogue=0.09). The positive association between WBI and dietary restraint was larger in samples with younger participants (R2analogue=0.20), lower BMIs (R2analogue=0.20), and community samples, college/university samples, and studies with multiple sample types (versus non-surgical weight loss treatment-seeking and bariatric samples; R2analogue=0.24). Further, the negative association between WBI and healthy eating was larger in samples with lower BMIs (R2analogue=0.45), studies with greater quality (R2analogue=0.23), and college/university samples (versus non-surgical weight loss treatment seeking and bariatric samples; R2analogue=0.44). The negative association between WBI and physical activity increased in magnitude in samples with more participants who identified as White (R2analogue=1.00). Further, the positive association between WBI and physical activity barriers was larger in studies with lower quality (R2analogue=0.49) and was smaller in college/university samples (versus non-surgical weight loss treatment-seeking and bariatric samples; R2analogue=0.46).
No correlates moderated concurrent associations between WBI and negative or positive mental health, global eating disorder pathology, eating concerns, global HRQoL, or self-compassion.
Discussion
WBI has gained increased attention in recent decades as a salient correlate of adverse health-related factors (Alimoradi et al., 2019; Emmer et al., 2020; Puhl et al., 2018). To improve the understanding of the state of the literature on these interrelations, the present study aimed to provide the largest comprehensive quantitative synthesis of cross-sectional and prospective associations between WBI and clinically-relevant psychosocial, physical, and behavioral health correlates, and conceptually and analytically informed moderators of these associations. Results indicated that greater WBI was consistently associated with worse psychosocial, physical, and behavioral health across most indices under investigation, with most studies providing data for concurrent associations only. However, notable variations in the nature and magnitude of these associations were identified as a function of the health-related correlate under consideration and various demographic, anthropometric, and study-level (e.g., sample type) factors. For example, adverse associations between WBI and health-correlates were generally larger among community and college samples versus non-surgical or surgical weight loss treatment samples. These results provide important information on the health-related implications of WBI and provide insight into priorities for future research, theory-building, and interventions in this area.
Psychosocial Health
Greater WBI was consistently associated with more adverse levels of all psychosocial health correlates, including worse positive and negative mental health, emotion dysregulation, self-compassion, and social functioning, with effects that were moderate to large in magnitude. These findings align with and extend the results of prior meta-analyses that identified moderate to large concurrent associations between greater WBI and both worse anxiety and depression (Alimoradi et al., 2019) and worse global mental health (Emmer et al., 2020). Further, the magnitude of the effects for the psychosocial correlates of WBI in the present meta-analysis were among the largest identified across all assessed health-related correlates. This suggests that the psychosocial implications of WBI are particularly harmful.
None of the assessed moderators were shown to influence associations between WBI and any of the assessed psychosocial health correlates. This suggests that these interrelations are largely consistent across the assessed demographic (age, sex/gender, race), weight-related (BMI), and study-level (sample type, study quality, publication status) factors. Such evidence is also consistent with and extends findings from a previous meta-analysis, which indicated that factors such as individuals’ ages, BMIs, and study quality did not moderate associations between WBI and depression or anxiety (Alimoradi et al., 2019).
Physical Health
Apart from healthcare use or engagement, which was not associated with individuals’ WBI, greater WBI was consistently associated with more adverse levels of the assessed physical health correlates, including weight-related factors (e.g., more weight cycling/less weight maintenance), physical health, and weight- and HRQoL. Notably, there has been considerable growth in research examining these physical health correlates of WBI since an earlier systematic review of this literature was published. For example, whereas 42 cross-sectional studies had provided data on associations between WBI and measures of body weight through 2017 (Pearl & Puhl, 2018), the present meta-analysis conducted through April 2021 identified data of this nature from 127 unique subsamples of participants and found a small to moderate concurrent association between greater WBI and higher BMI. This relatively small effect aligns with growing evidence that WBI presents at high rates among individuals across the weight spectrum and is not limited to those with higher weights (Puhl et al., 2018).
Notably, however, evidence indicated that the magnitude of this association differed based on various factors. For example, this positive association between greater WBI and higher BMI was larger in samples with participants of any weight, when compared to studies that strictly included participants with overweight/obesity. Although this suggests that there is likely a non-linear association between WBI and BMI, it is unclear whether the comparable attenuation of this effect in higher weight samples reflects restriction of range or substantive differences between either individuals with lower and higher weight or perhaps those at the extremes of the weight spectrum (e.g., underweight or obesity) relative to those with average weights. These possible explanations and the implications of such on associations between WBI and health correlates warrant future examination. Further, it is noteworthy that the positive association between WBI and BMI was larger in studies in which BMI data were self-reported by participants versus objectively measured. This form of measurement bias serves as an important consideration for not only the reliability of the existing evidence-base in this area but also for measurement decisions that warrant consideration in future studies. These data suggest that efforts should be made to collect objective height and weight data when study design features and resource limitations do not prevent the collection of such.
It is unclear why WBI was not associated with individuals’ healthcare use or engagement in the present study, despite well-established evidence that individuals living in larger bodies commonly experience weight stigma—which can promote WBI—in healthcare settings (e.g., Puhl et al., 2020). However, it is possible that sociodemographic individual-difference factors may moderate associations between WBI and healthcare use/engagement, such as BMI, gender, socioeconomic status, race, ethnicity, sexual identity, and disability status. In line with central tenets of intersectionality theory, the association between greater WBI and less healthcare use/engagement may be most meaningful for individuals with multiply marginalized identities who may experience several interconnected barriers to healthcare. Although data were insufficient (k = 7) to examine potential moderators of the association between WBI and healthcare use/engagement at present, these possibilities warrant assessment as this evidence-base continues to grow.
Behavioral Health
Greater WBI was consistently associated with more adverse levels of all health behaviors, including disordered eating behaviors, healthy eating, and physical activity, and there was considerable variability in the magnitude of these effects across constructs. For example, whereas moderate to large associations were identified between greater WBI and greater disinhibited eating (e.g., binge eating), dietary restraint, and cognitively-based eating concerns, a small effect was found for an association between greater WBI and greater compensatory behavior use (e.g., self-induced vomiting, compensatory exercise). This evidence of behavior-specific variability significantly expands upon findings from a previous meta-analysis (Zhu et al., 2021) that examined associations between WBI and a variety of aggregated and broadly-defined “unhealthy” versus “healthy” behavioral correlates (versus distinct behaviors) and stresses the necessity of separately examining these constructs in future assessments.
Although still underdeveloped, there has been growth in research examining associations between WBI and both healthy eating (k =15 vs. 3) and physical activity (k = 20 vs. 10) since this literature was last reviewed in 2017 (Pearl & Puhl, 2018). Results indicated that greater WBI was moderately associated with less healthy eating and had small associations with less physical activity and less physical activity self-efficacy. Given the established physical and mental health benefits of regular engagement in both health behaviors (Toh et al., 2020; Warburton & Bredin, 2017), individuals with elevated WBI may be at-risk for poor health long-term.
Theoretical Implications
The present results provide useful information that can be used to refine the two initial theoretical models that have been used to explain associations between WBI and health-related factors to date (Ratcliffe & Ellison, 2015; Sikorski et al., 2015). Briefly, as noted above, the psychological mediation framework (Sikorski et al., 2015) is an extension of Meyer’s minority stress theory and suggests that weight stigma experiences are distal stressors that map onto increases in (1) WBI (a group-specific proximal stressor for individuals with obesity) and (2) increases in general psychological risk factors (e.g., poor self-esteem) that, in turn, promote adverse mental health. Further, the WBI formulation model (Ratcliffe & Ellison, 2015) posits that, when individuals with obesity live in weight stigmatizing environments, WBI is maintained by bidirectional and interdependent processes among a variety of attentional (e.g., hypervigilance), cognitive (e.g., beliefs about the meaning of being an “obese person”), psychosocial (e.g., negative affect, avoidance of interpersonal relationships), and behavioral health (e.g., increased binge eating) factors.
In the present meta-analysis, the comparative magnitude of effects for associations between WBI and the assessed psychosocial, physical, and behavioral health correlates were largest for aspects of psychosocial health (considered in aggregate). This suggests that the psychosocial health implications of WBI are particularly harmful. Given this, psychosocial factors may warrant more central placement within these models, compared to their existing modeling in equal placement with (Ratcliffe & Ellison, 2015) or as factors that are not considered separately from (Sikorski et al., 2015) other health-related factors.
Second, the association between greater WBI and worse weight-related quality of life was the largest identified in the present meta-analysis and was very large in magnitude. Yet, neither the adapted psychological mediation framework (Sikorski et al., 2015) or the WBI formulation model (Ratcliffe & Ellison, 2015) accounts for this construct, although it appears to warrant inclusion. It may prove useful for the latter, for example, to incorporate weight-related quality of life as one of the maintaining factors (alongside other attitudinal, cognitive, psychosocial, and behavioral health factors) that are posited to bidirectionally and interdependently interact with and perpetuate increases in WBI.
Third, in the present meta-analysis, the association between WBI and BMI was only small to moderate in magnitude. Likewise, BMI only moderated associations between WBI and three of 26 the assessed health-related correlates (dietary restraint, healthy eating, physical HRQoL) and, when moderation was identified, there were larger effects for more adverse associations between WBI and these constructs among individuals with lower (versus higher) BMIs. Both existing theoretical models’ supposition that WBI is a process that is mainly experienced by individuals with obesity was not supported. These models should consequently be extended to account for the experiences of individuals across the weight spectrum.
Strengths, Limitations, and Future Directions
The present meta-analysis has various strengths. These include the large number of identified effects (which increases confidence in the reliability of the present findings), the examination of a broad range of outcomes and moderators, inclusion of both concurrent and prospective effects, and that no studies were excluded based on sample or demographic characteristics, all of which increase the generalizability of these results. The evidence-base on associations between WBI and the assessed health-related correlates also has multiple strengths. Most notably, existing studies in this area have generally employed samples with considerable weight diversity. There is also a good representation of studies that have used clinical samples of participants (e.g., individuals seeking weight loss treatment) and individuals from the communities of a variety of countries. Further, this area of research has seen considerable growth in recent years, which has strengthened the understanding of WBI’s health-related implications.
Despite these strengths, various limitations of the literature in this area warrant attention. A vital limitation of the existing evidence-base on the health-related correlates of WBI is the predominate focus on females and individuals who identify as White, and only 16 studies (10%) provided data on participants’ sexual orientations. The limited representation of diverse groups in this literature likely accounts for the generally null moderation effects identified for demographic factors in associations between WBI and health correlates in this meta-analysis. Thus, little is known about whether the observed associations generalize to individuals with a variety of diverse racial, ethnic, gender, and sexual identities, and this serves as a central research gap that warrants attention as this evidence-base continues to advance. This is especially important considering that the measures of WBI that were most frequently used in this literature were developed in samples with large proportions of individuals who identified as female and White (Durso & Latner, 2008; Lillis et al., 2010; Pearl & Puhl, 2014). Consequently, these measures may not aptly account for the experiences of individuals with other gender or cultural identities. Additional psychometric testing of these existing measures and the development of new instruments that may better reflect the WBI of diverse populations is warranted.
Most studies have examined cross-sectional associations between WBI and the assessed health-related correlates. Specifically, across all of the assessed correlates included in the present meta-analysis, whereas 136 studies provided data for concurrent effects, only 4 provided prospective and 5 provided retrospective data. As a result, the present meta-analysis could only provide a preliminary assessment of prospective associations between: (1) WBI and both later negative mental health and weight changes following weight loss interventions; (2) retrospective reports of prior weight loss relative to individuals’ current WBI. These initial findings suggested that greater WBI was robustly associated with less subsequent weight loss and moderately associated with later increases in negative mental health, yet that earlier weight loss was not associated with later WBI. Given the limited available data, the directionality of associations between WBI and both these and other health-related correlates remains largely unknown. It is plausible that individuals who experience adverse health outcomes related to weight gain, for one, may later experience feelings of self-blame and the self-devaluation that is characteristic of WBI. Alternatively, individuals with pre-existing low self-esteem and poor self-perceptions may develop weight-related self-devaluation over time, particularly if they experience weight stigma. These potential explanations warrant evaluation in future prospective research.
Conclusions
The present study aimed to provide the largest comprehensive quantitative synthesis of cross-sectional and prospective associations between WBI and clinically-relevant psychosocial, physical, and behavioral health correlates, as well as conceptually and analytically informed moderators of these associations. Results indicated that greater WBI was consistently associated with worse psychosocial, physical, and behavioral health across most factors under consideration. Notably, the vast majority of studies provided data for concurrent associations only, and notable variations in the nature and magnitude of the identified associations were found based on the health-related correlate under consideration and various demographic, anthropometric, and study-level (e.g., sample type) factors. Considered together, these results provide important information on the health-related implications of WBI and provide insight into priorities for future research, theory-building, and interventions in this area.
Supplementary Material
Highlights.
Our meta-analysis examined health-related correlates of weight bias internalization
Greater WBI was linked to worse psychosocial, physical, and behavioral health
Identified associations varied across health-related correlates and moderators
Findings provide important information on the health-related implications of WBI
Priorities for future WBI research, theory, and interventions are discussed
Funding acknowledgement:
This work was completed in part with support from the National Institute of Mental Health of the National Institutes of Health under award number F31MH120982 to Kelly A. Romano and the National Institute of Diabetes and Digestive and Kidney Diseases of the National Institutes of Health under award number K01DK124435 to Tyler B. Mason. The content is solely the responsibility of the authors and does not necessarily represent the official views of the National Institutes of Health.
Footnotes
Publisher's Disclaimer: This is a PDF file of an unedited manuscript that has been accepted for publication. As a service to our customers we are providing this early version of the manuscript. The manuscript will undergo copyediting, typesetting, and review of the resulting proof before it is published in its final form. Please note that during the production process errors may be discovered which could affect the content, and all legal disclaimers that apply to the journal pertain.
Declarations of interest: None.
Ethics approval: The present study is a meta-analysis and did not warrant ethical committee approval.
Data Availability:
Data used in the present meta-analysis will be made available by the first author upon the receipt of reasonable requests.
References
- Alimoradi Z, Golboni F, Griffiths MD, Broström A, Lin CY, & Pakpour AH (2019). Weight-related stigma and psychological distress: A systematic review and meta-analysis. Clinical Nutrition, 39, 2001–2013. 10.1016/j.clnu.2019.10.016 [DOI] [PubMed] [Google Scholar]
- Borenstein M, Hedges LV, Higgins J, & Rothstein HR (2009). Introduction to meta-analysis. Hoboken, NJ: John Wiley & Sons. [Google Scholar]
- Boswell RG, & White MA (2015). Gender differences in weight bias internalisation and eating pathology in overweight individuals. Advances in Eating Disorders, 3(3), 259–268. 10.1080/21662630.2015.1047881 [DOI] [PMC free article] [PubMed] [Google Scholar]
- Cohen J (1992). A power primer. Psychological Bulletin, 112(1), 155–159. [DOI] [PubMed] [Google Scholar]
- Decker KM, Thurston IB, & Kamody RC (2018). The mediating role of internalized weight stigma on weight perception and depression among emerging adults: Exploring moderation by weight and race. Body Image, 27, 202–210. 10.1016/j.bodyim.2018.10.004 [DOI] [PubMed] [Google Scholar]
- Emmer C, Bosnjak M, & Mata J (2020). The association between weight stigma and mental health: A meta-analysis. Obesity Reviews, 21(1), e12935. 10.1111/obr.12935 [DOI] [PubMed] [Google Scholar]
- Fairburn CG, Cooper Z, & Shafran R (2003). Cognitive behaviour therapy for eating disorders: A “transdiagnostic” theory and treatment. Behaviour Research and Therapy, 41(5), 509–528. 10.1016/S0005-7967(02)00088-8 [DOI] [PubMed] [Google Scholar]
- Hilbert A, Baldofski S, Zenger M, Lowe B, Kersting A, & Braehler E (2014). Weight Bias Internalization Scale: Psychometric properties and population norms. Plos One, 9(1). 10.1371/journal.pone.0086303 [DOI] [PMC free article] [PubMed] [Google Scholar]
- Hilbert A, Braehler E, Haeuser W, & Zenger M (2014). Weight bias internalization, core self-evaluation, and health in overweight and obese persons. Obesity, 22(1), 79–85. 10.1002/oby.20561 [DOI] [PubMed] [Google Scholar]
- Huedo-Medina TB, Sánchez-Meca J, Marín-Martínez F, & Botella J (2006). Assessing heterogeneity in meta-analysis: Q statistic or I2 index? Psychological Methods, 11, 193–206. 10.1037/1082-989X.11.2.193 [DOI] [PubMed] [Google Scholar]
- Lillis J, Luoma JB, Levin ME, & Hayes SC (2010). Measuring Weight Self-stigma: The Weight Self-Stigma Questionnaire. Obesity, 18(5), 971–976. 10.1038/oby.2009.353 [DOI] [PubMed] [Google Scholar]
- Mason TB, Mozdzierz P, Wang S, & Smith KE (2021). Discrimination and Eating Disorder Psychopathology: A Meta-Analysis. Behavior Therapy, 52(2), 406–417. [DOI] [PubMed] [Google Scholar]
- Meadows A, & Higgs S (2019). Internalised weight stigma moderates the impact of a stigmatising prime on eating in the absence of hunger in higher- but not lower-weight individuals. Frontiers in Psychology, 10. 10.3389/fpsyg.2019.01022 [DOI] [PMC free article] [PubMed] [Google Scholar]
- Mensinger JL, Tylka TL, & Calamari ME (2018). Mechanisms underlying weight status and healthcare avoidance in women: A study of weight stigma, body-related shame and guilt, and healthcare stress. Body Image, 25, 139–147. 10.1016/j.bodyim.2018.03.001 [DOI] [PubMed] [Google Scholar]
- Palmeira L, Pinto-Gouveia J, & Cunha M (2016). The role of weight self-stigma on the quality of life of women with overweight and obesity: A multi-group comparison between binge eaters and non-binge eaters. Appetite, 105, 782–789. 10.1016/j.appet.2016.07.015 [DOI] [PubMed] [Google Scholar]
- Pearl RL, & Puhl RM (2014). Measuring internalized weight attitudes across body weight categories: Validation of the modified Weight Bias Internalization Scale. Body Image, 11(1), 89–92. 10.1016/j.bodyim.2013.09.005 [DOI] [PubMed] [Google Scholar]
- Pearl RL, & Puhl RM (2018). Weight bias internalization and health: A systematic review. Obesity Reviews, 19(8), 1141–1163. 10.1111/obr.12701 [DOI] [PMC free article] [PubMed] [Google Scholar]
- Pearl RL, Wadden TA, Hopkins CM, Shaw JA, Hayes MR, Bakizada ZM, … Alamuddin N (2017). Association between weight bias internalization and metabolic syndrome among treatment-seeking individuals with obesity. Obesity, 25(2), 317–322. 10.1002/oby.21716 [DOI] [PMC free article] [PubMed] [Google Scholar]
- Puhl RM, Himmelstein MS, & Pearl RL (2020). Weight stigma as a psychosocial contributor to obesity. American Psychologist, 75(2), 274. [DOI] [PubMed] [Google Scholar]
- Puhl RM, Himmelstein MS, & Quinn DM (2018). Internalizing weight stigma: Prevalence and sociodemographic considerations in US adults. Obesity, 26(1), 167–175. 10.1002/oby.22029 [DOI] [PubMed] [Google Scholar]
- Purton T, Mond J, Cicero D, Wagner A, Stefano E, Rand-Giovannetti D, & Latner J (2019). Body dissatisfaction, internalized weight bias and quality of life in young men and women. Quality of Life Research, 28(7), 1825–1833. https://doi-org.proxy.lib.odu.edu/10.1007/s11136-019-02140-w [DOI] [PubMed] [Google Scholar]
- Ratcliffe D, & Ellison N (2015). Obesity and internalized weight stigma: A formulation model for an emerging psychological problem. Behavioural and Cognitive Psychotherapy, 43(2), 239–252. 10.1017/S1352465813000763 [DOI] [PubMed] [Google Scholar]
- Romano KA, Heron KE, & Henson JM (2021). Examining associations among weight stigma, weight bias internalization, body dissatisfaction, and eating disorder symptoms: Does weight status matter?. Body Image, 37, 38–49. 10.1016/j.bodyim.2021.01.006 [DOI] [PMC free article] [PubMed] [Google Scholar]
- Romano KA, Heron KE, Sandoval CM, Howard LM, MacIntyre RI, & Mason TB (2022). A meta-analysis of associations between weight bias internalization and conceptually-related correlates: a step towards improving construct validity. Clinical Psychology Review, 92, 102127. 10.1016/j.cpr.2022.102127 [DOI] [PMC free article] [PubMed] [Google Scholar]
- Ryff CD (1989). Happiness is everything, or is it? Explorations on the meaning of psychological well-being. Journal of personality and social psychology, 57(6), 1069. [Google Scholar]
- Schmidt FL, & Hunter JE (2015). Methods of meta-analysis: Correcting error and bias in research findings (3rd ed.). New York, NY: Sage. [Google Scholar]
- Toh DWK, Koh ES, & Kim JE (2020). Incorporating healthy dietary changes in addition to an increase in fruit and vegetable intake further improves the status of cardiovascular disease risk factors: A systematic review, meta-regression, and meta-analysis of randomized controlled trials. Nutrition Reviews, 78(7), 532–545. 10.1093/nutrit/nuz104 [DOI] [PubMed] [Google Scholar]
- Warburton DE, & Bredin SS (2017). Health benefits of physical activity: A systematic review of current systematic reviews. Current Opinion in Cardiology, 32(5), 541–556. 10.1097/HCO.0000000000000437 [DOI] [PubMed] [Google Scholar]
- Wells GA, Shea B, O’Connell DA, Peterson J, Welch V, Losos M, & Tugwell P (2000). The Newcastle-Ottawa Scale (NOS) for assessing the quality of nonrandomised studies in meta-analyses. Ottawa: Ottawa Hospital Research Institute. [Google Scholar]
- Zhu X, Smith R, & Buteau E (2021). A meta-analysis of weight stigma and health behaviors. Stigma and Health, 7(1), 1–13. 10.1037/sah0000352 [DOI] [Google Scholar]
Associated Data
This section collects any data citations, data availability statements, or supplementary materials included in this article.
Supplementary Materials
Data Availability Statement
Data used in the present meta-analysis will be made available by the first author upon the receipt of reasonable requests.