

Abstract
Apart from their effector functions in allergic disorders, tissue-resident mast cells (MC) are gaining recognition as initiators of inflammatory events through their distinctive ability to secrete many bioactive molecules harbored in cytoplasmic granules. Activation triggers mediator release through a regulated exocytosis named degranulation. MC activation is still substantiated by measuring systemic levels of MC-restricted mediators. However, identifying the anatomical location of MC activation is valuable for disease diagnosis. We designed a computer-assisted morphometric method based on image analysis of methylene blue (MB)-stained normal mouse skin tissue sections that quantitates actual in situ MC activation status. We reasoned MC cytoplasm could be viewed as an object featuring unique relative mass values based on activation status. Integrated optical density and area (A) ratios were significantly different between intact and degranulated MC (p < 0.001). The examination of fractal characteristics is of translational diagnostic/prognostic value in cancer and readily applied to quantify cytoskeleton morphology and vasculature. Fractal dimension (D), a measure of their comparative space filling capacity and structural density, also differed significantly between intact and degranulated MC (p < 0.001). Morphometric analysis provides a reliable and reproducible method for in situ quantification of MC activation status.
Keywords: mast cells, degranulation, fractal analysis, in situ, morphometry
Introduction
Mast cells (MC) are long-lived tissue-dwelling cells, found in all vascularized tissues at homeostasis, especially at the host/environment interfaces, including skin, airways and the gastrointestinal and genitourinary tracts (Galli et al, 2011). There is mounting evidence MC manifest substantial immunomodulatory functions in many physiological processes through the vast repertoire of mediators they release upon activation (Galli et al, 2011; Oskeritzian, 2015). Degranulation represents the canonical process through which activated MC secrete mediators (Wernersson & Pejler, 2014). It refers to rapid exocytosis of granules that occupy about 80% of MC cytoplasm and harbor a wide array of preformed bio-active substances (Galli & Tsai, 2012; Moon et al., 2014). A spectrum of receptor-dependent and independent stimuli can activate MC, including physical and mechanical triggers, and the subsequent secretion of histamine, proteases, lipid mediators, cytokines, and chemokines (da Silva et al., 2014). To date, investigators are taking advantage of MC cytoplasm replete with granules as intra-granular proteoglycans interact with metachromatic dyes such as methylene blue (MB) to allow for visualization, anatomical distribution and enumeration of MC in tissue sections (Wolters et at, 2005). The interaction of these highly sulphated structures with dye molecules yields a distinct blue/purple color uniquely staining MC cytoplasmic granules (Lagunoff, 1974; Wolters et at, 2005). Other commonly used histological methods include chloroacetate esterase, but this technique may also stain granulocytes (Rafail et at, 2015). Although local MC identification may be straightforward, microscopic discrimination between intact and degranulated MC could be daunting even for trained observers as tissue MC are polymorphic and staining intensity may vary even when routinely used. Thus, the universally accepted method to substantiate MC activation remains circulating level determination of MC-restricted mediators, including tryp-tase (Schwartz et al., 1987). However, while unequivocally quantitative, systemic measurements do not reflect in situ alterations of MC. Because of their strategic location, MC can regulate vascular permeability and cell recruitment to initiate local inflammation, therefore exerting important pathogenic functions (Marshall, 2004). We reasoned that image analysis could aid to develop a reproducible, objective and thus reliable method to quantify rather than score MC activation. To this end, we investigated normal mouse skin samples for MC using the well-established MB staining of tissue sections. Images of a large number of MC were captured from four different mice. Next, we considered MC granule-filled cytoplasm as an object and MC as regions of interest (ROI), endowed with size, volume and staining intensity parameters. We reasoned that an intact MC should feature higher values for these parameters, compared to degranulated MC. Our results demonstrate these morphometric parameters precisely classify MC into two objective groups, intact and degranulated MC. We further complemented these measurements by quantification of fractal dimension values for each cellular state. Taken together, we have established a rigorous analytical method based on acquisition of morphometric data collected from digitized images of tissue sections that allows for reliable and objective quantitation of MC activation status. Thus, MC disorders may involve aberrant proliferation of MC exemplified by mastocytosis, a myeloproliferative neoplasm, but many primary MC diseases feature normal MC numbers of abnormal hyperactivity (Hamilton et al., 2011; Valent et al., 2011). Chronic MC activation could be challenging to diagnose, often accompanied with mild, episodic or atypical symptoms of idiopathic origin (Valent et al., 2011). Based on our study, pathological specimens could be surveyed for MC status at a greater scale for diagnostic/prognostic purposes in MC-related disorders or in diseases where MC dysfunction is suspected in the absence of pathognomonic signs.
Materials and Methods
Reagents
All chemicals were purchased from Fisher Scientific (Pittsburgh, PA, USA).
Animals
Gender- and aged-matched C57BL/6 mice were purchased from Charles River NCI (Frederick, MD, USA). All mice were used at 8–12 weeks of age and maintained in a pathogen-free facility. Studies were performed in accordance with institutional animal care and use committee guidelines.
Histology
For skin tissue collection, mice were euthanized by CO2 asphyxiation. The skin from the dorsal back was shaved. Skin samples were collected and fixed in 10%-buffered formalin. Fixed tissues were embedded in paraffin, sectioned (5 μm thickness) and mounted on microscope slides. Some slides were stained with hematoxylin and eosin. Other slides were de-paraffinized in xylene, hydrated through graded alcohols, and equilibrated in phosphate-buffered saline. To visualize MC, slides were placed in 0.1% methylene blue (MB) for 5 s, rinsed with water, dehydrated in 100% ethanol and mounted under coverslips with cytoseal 60 (Wolters et al., 2005). Sections were imaged with a Nikon E-600 microscope (Nikon Inc., Melville, NY, USA) equipped with a Micropublisher digital camera and images collected with 10 and 40× objectives. Fourteen adjacent images were recorded from each section as TIFF files. Morphometric parameters of MC were measured using the MetaMorph® 6.1 Microscopy Automation and Image Analysis software (Molecular Devices, Sunnyvale, CA, USA).
Descriptors of MC Morphology in the Skin
The morphometric descriptors of area (A), integrated optical density (IOD) to generate relative density (IOD/A), and fractal dimension (D) were measured for thresholded and isolated MC residing in the hypodermis and dermis of isolated regions of the skin (n = 4 mice).
Isolation and Area ofMC
In the hypodermis and dermis of digitized images, MC were isolated as individual ROI using the hue, saturation, intensity (HSI) color model of the set color threshold subroutine of MetaMorph 6.1 software. The area of the cell measured excluded holes (non-stained regions) within the ROI.
IOD of MB-stained MC
The HSI values were adjusted to isolate the blue/purple metachromatic color characteristic of MC as a thresholded region. The cytoplasmic blue/purple metachromatic color distinguishes MC from other blue staining in the tissue. From the thresholded region, the area (A) of the cell and its IOD were measured using the integrated morphometry subroutine of MetaMorph 6.1. The image of the individual isolated MC was converted to a gray scale image for further analysis of its fractal dimension using the free HarFa imaging software (www.fch.vutbr.cz/lectures/imagesci/).
When using threshold boundaries in an image, the IOD is defined as the weighted sum of the image histogram in which each term in the histogram is multiplied by the gray value it represents (Walter & Berns, 1986) and is expressed by the following equation:
where T1 and T2 represent the upper and lower thresholds defining the ROI in the histogram, GV the gray value of each pixel, and H(GV) the gray level histogram. Values of IOD were calculated directly from the integrated morphometry subroutine of MetaMorph 6.1 software. Using the software’s optical calipers, the measurements were refined by setting specific boundary conditions for area and IOD for acceptance of the signal from the individual MC and to minimize or eliminate the contributions of any non-specific and background staining. This concept of IOD representing the mass or total amount of stained material in an ROI of an image is well-established and has been previously applied to diverse topics including the translocation of nuclear factor-κB in the nucleus (Fuseler et al., 2006; Rodgers & Fuseler, 2007), changes in actin cytoskeleton in cardiac fibroblasts (Fuseler et al., 2007) and adult stromal stem cells (Fuseler & Valarmathi, 2012), and comparison of the architecture of normal and tumor microvasculature (Fuseler et al., 2010).
The IOD measured for the MB-stained MC is a representation of the mass and a measurement of the total amount of material in the delineated region. The values of the IOD were normalized by being divided by the area (A) of the thresholded ROI for the MC. The resulting term of IOD/A allows for comparisons to be made between intact MC and MC that have experienced degranulation as result of activation. Additionally, IOD/A provides the concept of mass density or relative density (Smith et al., 1996) of the intact and degranulated MC. As a mass measurement, the values of IOD/A provide further information on the structure and distribution of pixels constituting the mass MC granules present within the ROI.
Fractal Dimension
MC granular cytoplasm is an irregular and complex object composed of proteoglycan-containing granules at different levels of resolution, which are functionally and physiologically similar (self-similar). Because of the complexity of form, MC cytoplasm cannot be characterized or defined by regular Euclidean geometry or dimensions. Regular Euclidean dimension assigns an integer to each point or set of points in Euclidean space and includes the familiar geometrical descriptors or numbers: 0 to a point, 1 to a straight line, 2 to a plane surface, and 3 to a volume or three dimensional figures. These integer descriptors are exponents of power functions that describe these objects (Brown et al., 2002). Complex macro- or micro-anatomical structures cannot be analyzed by regular Euclidean geometry, but can be described quantitatively by fractal geometry (Mandelbrot, 1982; Smith et al., 1996). The fractal dimension of complex or irregular structures can be described by non-integer numbers, with values falling between two-integer topological dimensions. These non-integer numbers are described as non-Euclidean and define the fractal dimension (D) of an object. The concept of fractals currently provides a useful method to quantify the inherent irregularity or complexity of phenomena (Zhang et al., 2006). In general, a fractal is any rough and irregular object consisting of parts that are in some way similar to the whole. Because of the self-similar conditions, MC cytoplasm can be considered a fractal object and its fractal dimension (D), expressed by a non-integer number lying between two Euclidean integer topological dimensions (Grizzi et al., 2005). In the case of the two-dimensional images analyzed in this study, the values of D characterizing MC cytoplasm are therefore fractional and lie between the Euclidean integers of 1 and 2.
The box-counting method has been the most widely used and general model for applying fractal analysis to biological and non-biological systems and is expressed by the formula:
The box-counting method consists of a grid of boxes of side length size (e) superimposed over the image of the structure and N(e) the smallest number of boxes of side (e) required to cover the surface or outline of the object completely (Grizzi & Dioguardi, 1999; Dioguardi et al., 2006; Fuseler et al., 2007). Since a zero limit cannot be applied to a biological object, here the MC, the fractal dimension is determined as the slope of a regression line when Log [N(e)] is plotted against Log(1/e) i.e., D = Log [N(e)]/Log(1/e). From the images of previously isolated and thresholded MC, the D values of the ROI were determined using HarFA (full version 5.5.31) software (Nezadal et al., 2001). The thresholded images of MC are assigned mesh sizes of boxes with (e) values ranging from 2 to 215 pixels and 30 steps within this range were calculated to generate the Log [N(e)] versus Log(1/e) plots, the slopes of which determine the D values. In these 40× images, one pixel is equal to 0.229 μm. Fourteen images were analyzed from each skin section of each animal (n = 4 mice).
Statistics
Data are expressed as means ± SEM. Significance was determined by analysis of variance and an appropriate post hoc test for multiple comparisons using Sigma-Plot software (Systat Software Inc., San Jose, CA, USA) and is shown in figures.
Results
Methylene Blue Staining of Normal Mouse Skin Sections for MC Detection and Analysis
We used a classic staining technique to visualize MC in skin tissue sections. Methylene blue (0.1% MB) stains all nuclei of cells in blue. Because of the metachromatic nature of the proteoglycans that compose the frame of MC granules, the interaction of the dye molecules with proteoglycans results in an absorption spectrum shift from blue to purple. Thus, metachromasia features blue/purple cytoplasmic granules, unique to MC (Wolters et al., 2005). Even though the metachromatic cytoplasmic staining is MC-specific, Figure 1a shows that in situ MC detection can be challenging, at low magnification using a 10× objective of MB-stained skin section. Higher magnification using a 40× objective (or High Power Field, HPF) of similar MC-stained skin tissue sections allows for MC identification, but illustrates the difficulty to decide, even with blinded analysis and microscope-aided human eyes, whether a particular MC presents features of an intact or a degranulated cell (Fig. 1b). We developed a method for rapid and unequivocal identification of MC status, as follows: an intact MC was defined as a MC within and/or at the periphery of which no distinct granule could be singled out in high power field (HPF) (Fig. 1b, Intact MC). Next, we defined as degranulated, MC for which distinct individual granules could be observed within and at the periphery of the cell in HPF (Fig. 1b, Degranulated MC). Figure 1c describes the analytic flow chart employed to quantitatively identify and distinguish between an intact and a degranulated MC. To this end, two MC were randomly selected (Fig. 1b, Intact MC and Degranulated MC), and then isolated as specific ROI to remove the background (Fig. 1c, upper panels). Next, isolated MC images were color-thresholded (Fig. 1c, middle panels, orange coloring). The thresholding process was followed by the actual determination of pixel intensity (Fig. 1c, lower panels, green coloring) to measure the IOD parameter which sums the values of all the pixels in the selection (cell). We noticed that the area occupied by and the morphology of each MC could vary greatly. To take this variable into account, the area (A) occupied by each cell was measured next and expressed in square μm. Because intact MC granules are fully equipped with a variety of mediators whereas degranulated MC have partly released the mediators harbored in their granules, we reasoned that intact and degranulated MC must be characterized by differential mass or IOD/A measurements, allowing for objective definition of each of these cellular states.
Figure 1.
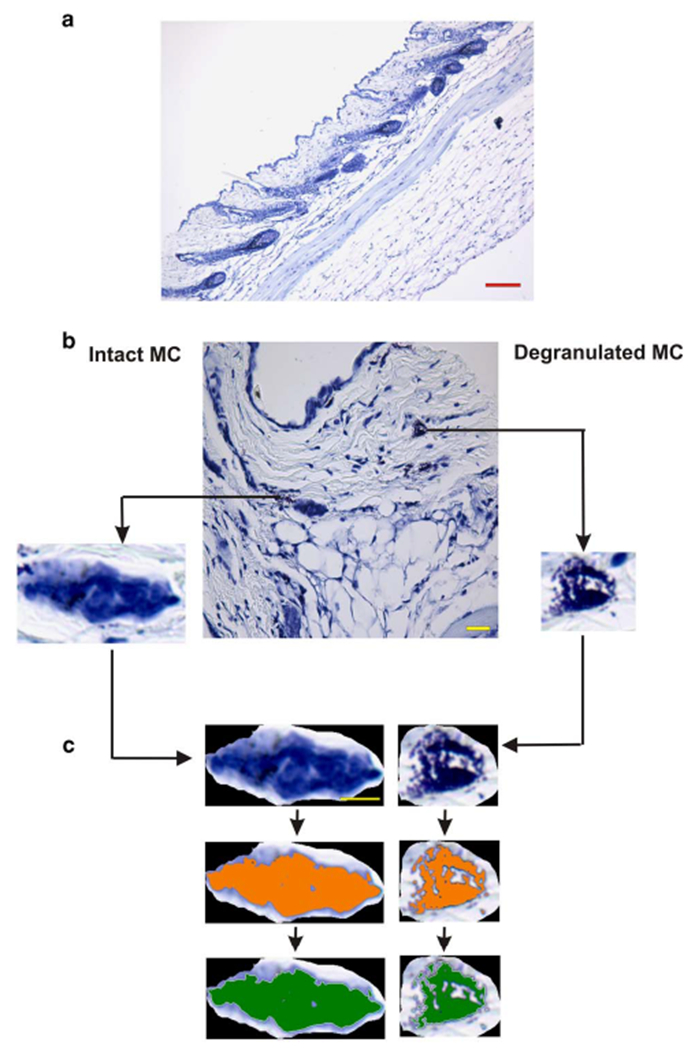
a: Methylene blue (MB)-stained mouse skin tissue section. Scale bar is 200 μm. b: MB-stained mouse skin tissue section with a selection of two randomly selected and isolated mast cells (MC) (Scale bar = 50 μm); an intact MC and a degranulated MC. c: Isolated MC images are color-thresholded (orange), followed by measurement overlay (green) to allow for relative density and mass measurement IOF/A determinations.
Relative Mass Calculations Based on IOD/A Ratios Distinctly and Quantitatively Characterize Intact and Degranulated MC
We further analyzed skin tissue sections collected from four different animals, and randomly selected 90 intact and 90 degranulated MC, as described above. Next, IOD and A parameters were calculated as described in Figure 1. Quantitation of IOD/A ratios were carried out. As shown in Figure 2, intact MC exhibit an average IOD/A ratio of 15.459 ± 2.18, which was significantly decreased to 11.782 ± 2.109 in degranulated MC. Importantly, these results quantitatively substantiate the notion that intact MC feature a higher mass compared to degranulated MC. This procedure actually measures relative MC mass and demonstrates this parameter to be significantly attenuated upon degranulation, in agreement with the biological relevance of the process.
Figure 2.
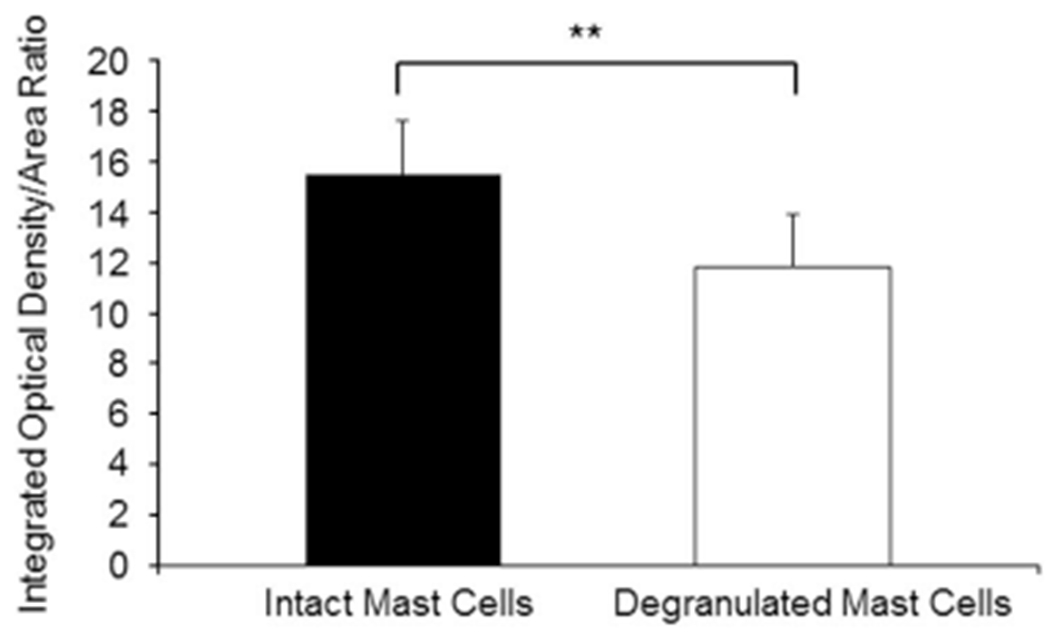
Comparative relative density and mass measurements as integrated optical density (IOD) over Area (A) ratios for intact and degranulated MC in skin samples of four different normal mice (**p < 0.001).
Fractal Dimension Analysis Constitutes a Suitable Analytical Approach to Further Define Morphometric Evaluations of Intact and Degranulated MC
We next considered that the size and volume parameters previously calculated for each MC status could be complemented by quantification of comparative fractal dimension values. To this end, we sought to determine whether fractal dimension, a measure of chaos and space filling capacity, could be a useful discriminating factor between intact and degranulated MC, as there is an increasing use of applied fractal geometry in the medical field for pattern recognition, texture analysis and segmentation. This type of analysis has been performed to study cell nuclei and nuclear chromatin and has been demonstrated as a useful prognostic tool in cancer (Ferro et al., 2011; Streba et al., 2015). Therefore, we reasoned that the more ordered cytoplasm of an intact MC should display contrasted fractal characteristics compared to a more heterogeneous, less uniform cytoplasm of a degranulated MC. Figure 3a shows the procedure to first isolate cells to be analyzed from the tissue and second, proceed with binarization of the image (i.e., generate a black and white image from a gray-scale one). Binarized images are next used to calculate fractal dimension (D), therefore quantifying the structural density of MC cytoplasm. D values of the two-dimensional images analyzed were between the Euclidean values of 1 (a straight line) and 2 (an irregular, complex structure). Of note, fractal dimensions constitute numerical descriptors which are exponents of power functions, i.e., nonlinear functions.
Figure 3.
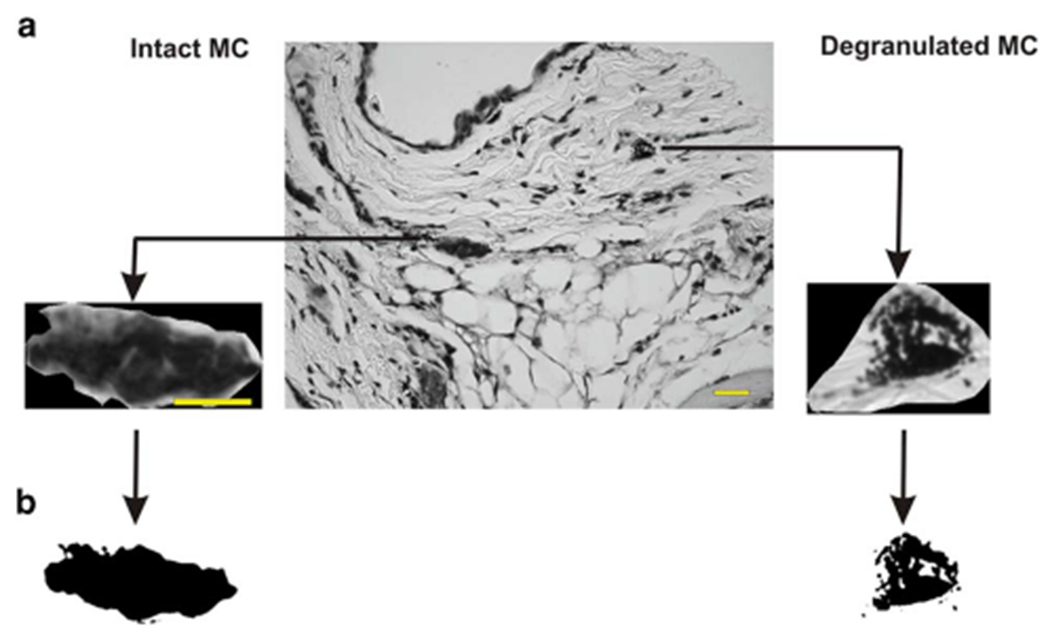
Fractal dimension (D) is a morphological descriptor of chaos and space filling capacity of MC cytoplasm, a: For measurement of D, the digitized image in Figure 1b was thresholded to generate a black and white 8-bit gray scale image from the color image, b: Threshold images were generated using the free HarFa software, which includes several filtration algorithms to eliminate thermal noise associated with the digital camera and illumination variations (gray scale) across the image. Scale bar is 50 μm
Fractal Analysis is a Reliable Method for Objective Quantification of in situ MC Degranulation
Analysis of normal skin samples collected from four different mice was conducted using 14 images per animal and randomly chosen intact MC (n = 29–60 cells per animal) and degranulated MC (n = 14–29 cells per animal). The fractal dimension of each cell was determined. The discriminatory performance of D parameters is shown in Figure 4, indicating mean D values of 1.378 ± 0.621 and 1.484 ± 0.0489 for intact and degranulated MC, respectively. Surprisingly, the D values characterizing each MC status were very consistent from animal to animal, suggesting the potential relevance of fractal signatures to objectively evaluate MC activation status. Moreover, mean D values of degranulated MC were significantly augmented compared to mean D values of intact MC. We established that computer-assisted morphometric MC analysis performed on microscopy images of tissue samples may overcome the time-consuming and subjective examination that necessitates expertise and extensive observer training.
Figure 4.
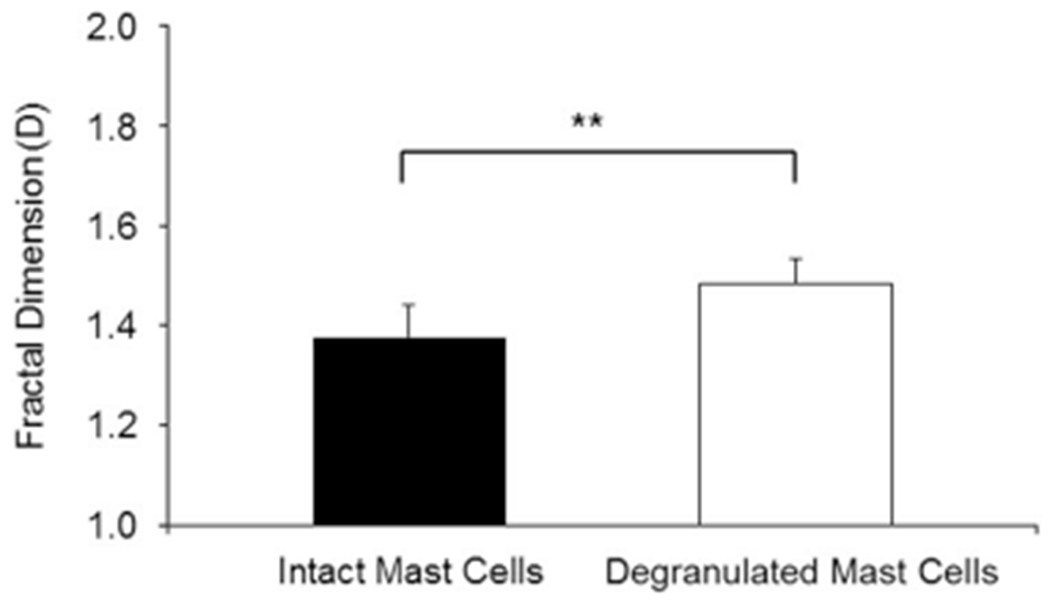
Comparative fractal dimension (D) analysis for intact and degranulated MC in skin samples of four different normal mice (14 images per animal were analyzed). Degranulation of MC increased the D values significantly and consistently, compared to D values of intact MC (**p < 0.001).
Discussion
Key components of innate immunity, MC are present in tissues apposed to the vasculature in homeostatic conditions (Reber et al., 2012). They harbor numerous intracytoplasmic granules, large dense core vesicles composed of a proteoglycan matrix where many mediators are prestored, including vasodilating histamine, cytokines and chemokines (Wernersson & Pejler, 2014). Beside their canonical activation through the cross-linking by antigen (Ag) of immunoglobulin E (IgE) bound to their high-affinity receptors, MC express a plethora of receptors, including Toll-like receptors, and receptors for complement, cytokines, chemokines, neurotransmitters and sphingosine-1-phosphate (S1P), the ligation of which could also trigger further MC activation (Oskeritzian et al., 2008, 2010, 2015; Theoharides et al., 2012; Oskeritzian, 2015). Moreover, microenvironmental physical/mechanical, pH, osmolarity and temperature alterations and UV radiation can also activate MC. Degranulation or the exocytosis of granules is the most prominent process indicative of MC activation. MC stimulation is traditionally monitored through the detection of granule-associated mediators measured in the circulation upon release. However, a systemic appreciation of MC activation, though relevant and sometimes life-threatening such as upon anaphylactic shock, does not inform on the status of local MC in tissues. As outlined above, the distinctive ability of MC to produce and pre-store large concentrations of many mediators positions these cells as first-line responders thus shaping the initial local response to trauma. We have previously reported that IgE/Ag- and SIP-mediated activation of MC delivers locally several cell-recruiting chemokines, thus endowing MC with early guidance of inflammatory events (Oskeritzian et al., 2008, 2010, 2015). This is particularly important in skin disorder pathogenesis as the positioning of large numbers of MC is substantiated in the dermis and the hypodermis, subcutaneous fatty tissue layer of rodent and human skin (Hart et al., 1998, 1999). Strong evidence suggests an association between MC-derived functions and the mediator repertoire they differentially release owing to the nature of stimulation (Galli et al., 2008; Kalesnikoff & Galli, 2008).
Intragranular proteoglycan interaction with dye molecules of MB results in a metachromatic staining of granules specific to MC, the only tissue-resident cells that display these distinct blue/purple-colored granules in their cytoplasm. Of note, although circulating basophils share some phenotypic and functional features, they differ from MC in many aspects of natural history, granule contents and functions (Voehringer, 2013). Relevant to our study, basophils are not found in normal tissues (Arock et al., 2002), but could be recruited into inflamed sites (Voehringer, 2013). Importantly, the main histochemical difference that allows distinguishing MC from basophils resides in differential metachromatic staining. Namely, MC granules comprise both heparin and chondroitin sulfate (CS) proteoglycans, whereas basophil granules present CS but do not contain heparin and are fewer in number compared to MC granules, thus resulting into weak staining with basic dyes (Voehringer, 2013). Other distinct features of MC are their round nuclear morphology and a cell size ranging from 5 to 10 μm, conversely to basophils that display lobulated, indented or segmented nuclei and an overall smaller size of 5–7 μm compared to MC (Voehringer, 2013).
While easy to identify in MB-stained tissue sections, defining MC activation status remains challenging even for a trained observer and is a source of considerable interobserver variability. Since MC are tissue-resident and could initiate or suppress immune responses, they constitute an emerging target candidate for fine-tuning the local microenvironmental responsiveness, therefore pathogenesis and carcinogenesis (Oskeritzian, 2015). There is increasing need for a better understanding pertaining to the relationship of MC in inflammation and cancer as it seems diversified and therefore ill-understood (Ribatti, 2013; Giannou et al., 2015; Oldford & Marshall, 2015; Oskeritzian, 2015). Indeed, many studies acknowledge the presence of increased MC numbers in numerous pathological conditions, yet reporting the more relevant and tractable local percentage or number of degranulated MC is not recognized as strong univariate data that often needs to be validated by quantitating MC-derived mediators in biological fluids.
In this study, we developed a computerized method for morphometric analysis of MC based on objective parameter measurements in routinely MB-stained normal skin tissue sections. Of relevance to MC granularity and morphology, these criteria include mass and relative density measurements based on IOD and area (A) ratios and fractality, which implies scale-independent self-similarity. We discovered that, independent of the subject, intact skin MC are consistently characterized by a mass (IOD over A ratio) significantly higher than degranulated MC. Of note, the IOD/A ratios of intact or degranulated MC were surprisingly consistent from cell to cell in each group and from animal to animal, further highlighting the reproducibility and validity of our newly developed analytical method. Interestingly, the use of IOD and A parameters have previously been applied to dermal MC as a tool to quantify histamine content, but not to provide a measurement of MC activation as demonstrated herein (Hart et al., 1998, 1999).
The examination of fractal characteristics has been convincingly relevant to analyze chromatin structure and nuclear texture, providing important diagnostic and prognostic information for patients with acute leukemia and multiple myeloma (Ferro et al., 2011). Fractal analysis has been widely applied in the past to quantify cytoskeleton morphology (Fuseler et al., 2007; Fuseler & Valarmathi, 2012; Qian et al., 2012), cellular shape (Sedivy et al., 2002; Wick et al., 2003; Jelinek et al, 2011), vasculature structure (Anderson et al., 2005; Grizzi et al., 2005; Di leva et al., 2007; Fuseler et al., 2010), vascular sprouting (Doubal et al., 2010; Moledina et al., 2011) and tumor microvasculature (Fuseler et al., 2010; Di leva, 2012). More recently, it was successfully applied to quantify collagen fibrotic lesions of the liver (Dioguardi et al., 2006, 2008) and the heart (Zouein et al., 2014). Microscopy evaluation of the MC degranulation process requires high magnification analysis and could be difficult given staining variations occurring in routine slide preparations. We took advantage of the fact that fractals are scale independent and their determination based on thre-sholded images less dependent on staining intensity. Methylene blue is one of the most common metachromatic staining methods and well-established histological approach to detect MC through the unique staining of their granules (Wolters et al., 2005). As such, it could be used to distinguish intact from degranulated MC. However, observer-based analysis often yields inconsistent data, varying with the individual grading of MC status and provides semi-quantitative estimates of MC degranulation rather than reliable quantitation partly because of the irregular shapes tissue MC display in situ. Thus, MC cytoplasm, 80% of which is occupied by granules, is highly polymorphic and irregular in shape. To overcome these conditions, we considered the granule/cytoplasm mass as a fractal object, a concept developed by Mandelbrot (1982) that provides a theoretical framework for many biological processes and objects. Thus, the fractal property relates to a measurement variable and a fractal object or process can reveal fractal characteristics of many different variables or features. We measured the fractal dimension (D) of intact and degranulated MC, as a measure of the comparative space filling capacity and complexity or structural density of MC in these two different biological stages, using digitized two-dimensional images. We discovered that D associated with intact MC is consistently and significantly lower than D of degranulated MC in a reproducible manner. These important results suggest that the measure of D can quantitatively distinguish intact from degranulated MC, regardless of cellular morphology which could greatly vary. Together with the relative density measurements provided by the IOD/A ratios, which determines the structure and/or distribution of the granular material within a MC (our region of interest), we demonstrate that the measure of D generates a quantitative description of mammalian MC status. We are currently exploring the feasibility of acquiring these data in a semi-automated manner for potential diagnosis/prognosis applications to compare the analysis of healthy and diseased tissue sections in MC-related disorders. We attributed the detection of some degranulated MC in normal skin to the procedure for sample preparation that requires shaving of the mouse back skin. This mandatory step constitutes a mild but perhaps significant mechanical stimulus leading to a low but detectable incidence of dermal MC activation.
Despite the differences between mouse and human skin, mouse models of human disease remain prevalent, and in many cases genes of interest are deregulated and/or mutated in both species (Gerber et ah, 2014). The vast abundance of disease models, knockout and transgenic strains ensure that mouse models will remain a highly relevant mainstay to the study of skin biology (Gerber et al., 2014). Therefore, our morphometric method of MC analysis was first developed using mouse skin samples. Applying this morphometric method to human samples would assist clinicians and hospitals with providing a rapid determination of MC activation status, including in suspected cases of MC activation syndrome, mastocytosis, and anaphylactoid versus genuine anaphylactic reactions (Akin et al., 2010; Hamilton et al., 2011; Valent et al., 2011). A previous report applied fractal dimension and lacunarity or measurement of roughness to characterize MC degranulation in rainbow trout (Manera et al., 2014). Although informative, this study did not use mammalian MC. Moreover, MC degranulation was triggered in a receptor-independent manner using compound 48/80, a synthetic polyamine basic secretagogue composed of mixed polymers of phenylethylamine cross-linked by formaldehyde of undetermined ratio thus precluding calculation of molar concentrations (Manera et al., 2014). Our study establishes that mouse skin MC status can be quantified at homeostasis using fractal geometry, image analysis and readily available standard bright field microscopy on tissue sections routinely stained with MB, providing in situ quantification of MC activation. We are currently applying similar approaches to complementary MC immunohistochemistry staining techniques designed to phenotype MC subsets. Introduction of the fractal theory in biology and medicine has already led to a better understanding of many physiological processes, including allosteric enzyme kinetics, intracellular bio-energetic dynamics, metabolic rate, drug clearance modeling, angiogenesis, cardiovascular physiology and tumor growth (Aon et al., 2008; McNally & Mazza, 2010; Thamrin et al., 2010; Ferro et al., 2011). Here we demonstrate in situ quantification of MC status in mammalian tissue samples, combining relative density and fractal dimension measurements of MC cytoplasmic density and order. Furthermore, we propose that this morphometric analysis is applicable to patient samples and provide quantitative data pertaining to local MC activation in tissue sections in clinical settings.
Conclusion
We demonstrate the ability to quantify in situ MC activation using computer-assisted image analysis and biological specimens, based on fractality and mass measurements. Reproducible, consistent and quantitative data were collected from multiple skin samples, establishing that significantly different morphometric parameters are featured in intact and degranulated MC. This method may be further developed as a rapid diagnostic tool for the formulation of MC involvement in research and clinical settings.
Acknowledgments
Supported by the US National Institutes of Health/National Institute of Allergy and Infectious Diseases (R01 AI095494 to C.A.O.).
References
- Akin C, Valent P & Metcalfe DD (2010). Mast cell activation syndrome: Proposed diagnostic criteria. J Allergy Clin Immunol 126, 1099–1104. [DOI] [PMC free article] [PubMed] [Google Scholar]
- Anderson JC, Babb AL & Hlastala MP (2005). A fractal analysis of the radial distribution of bronchial capillaries around large airways. J Appl Physiol 98, 850–855. [DOI] [PubMed] [Google Scholar]
- Aon MA, Roussel MR, Cortassa S, O’Rourke B, Murray DB, Beckmann M & Lloyd D (2008). The scale-free dynamics of eukaryotic cells. PLoS One 3, e3624. [DOI] [PMC free article] [PubMed] [Google Scholar]
- Arock M, Schneider E, Boissan M, Tricottet V & Dy M (2002). Differentiation of human basophils: An overview of recent advances and pending questions. J Leuko Biol 71, 557–564. [PubMed] [Google Scholar]
- Brown JH, Gupta VK, Li B-L, Milne BT, Restrepo C & West GB (2002). The fractal nature of nature: Power laws, ecological complexity and biodiversity. Phil Trans R Soc Loud B 357, 619–626. [DOI] [PMC free article] [PubMed] [Google Scholar]
- Da Silva EZM, Jamur MC & Oliver C (2014). Mast cell function: A new vision of an old cell. J Histochem Cytochem 62, 698–738. [DOI] [PMC free article] [PubMed] [Google Scholar]
- Di Ieva A (2012). Fractal analysis of microvascular networks in malignant brain tumors. Clin Neuropathol 31, 342–351. [DOI] [PubMed] [Google Scholar]
- Di Ieva A, Grizzi F, Ceva-Grimaldi G, Russo C, Gaetani P, Aimar E, Levi D, Pisano P, Tancioni F, Nicola G, Tschabitscher M, Dioguardi N & Baena RR (2007). Fractal dimension as a quantitator of the microvasculature of normal and adenomatous pituitary tissue. J Anat 211, 673–680. [DOI] [PMC free article] [PubMed] [Google Scholar]
- Dioguardi N, Grizzi F, Franceschini B, Bossi P & Russo C (2006). Liver fibrosis and tissue architectural change measurement using fractal-rectified metrics and Hurst’s exponent. World J Gastroenterol 12, 2187–2194. [DOI] [PMC free article] [PubMed] [Google Scholar]
- Dioguardi N, Grizzi F, Fiamengo B & Russo C (2008). Metrically measuring liver biopsy: a chronic hepatitis B and C computer-aided morphologic description. World J Gastroenterol 14, 7335–7344. [DOI] [PMC free article] [PubMed] [Google Scholar]
- Doubal FN, MacGillivray TJ, Patton N, Dhillon B, Dennis MS & Wardlaw JM (2010). Fractal analysis of retinal vessels suggests that a distinct vasculopathy causes lacunar stroke. Neurology 74, 1102–1107. [DOI] [PMC free article] [PubMed] [Google Scholar]
- Ferro DP, Falconi MA, Adam RL, Ortega MM, Lima CP, De Souza CA, Lorand-Metze I & Metze K (2011). Fractal characteristics of May-Grünwald-Giemsa stained chromatin are independent prognostic factors for survival in multiple myeloma. PLoS One 6, e20706. [DOI] [PMC free article] [PubMed] [Google Scholar]
- Fuseler JW, Bedenbaugh A, Yekkala K & Baudino TA (2010). Fractal and image analysis of the microvasculature in normal intestinal submucosa and intestinal polyps in Apc(Min/+) mice. Microsc Microanal 16, 73–79. [DOI] [PubMed] [Google Scholar]
- Fuseler JW, Merrill DM, Rogers JA, Grisham MB & Wolf RE (2006). Analysis and quantitation of NF-kappaB nuclear translocation in tumor necrosis factor alpha (TNF-alpha) activated vascular endothelial cells. Microsc Microanal 12, 269–276. [DOI] [PubMed] [Google Scholar]
- Fuseler JW, Millette CF, Davis JM & Carver W (2007). Fractal and image analysis of morphological changes in the actin cytoskeleton of neonatal cardiac fibroblasts in response to mechanical stretch. Microsc Microanal 13, 133–143. [DOI] [PubMed] [Google Scholar]
- Fuseler JW & Valarmathi MT (2012). Modulation of the migration and differentiation potential of adult bone marrow stromal stem cells by nitric oxide. Biomaterials 33, 1032–1043. [DOI] [PubMed] [Google Scholar]
- Galli SJ, Borregaard N & Wynn TA (2011). Phenotypic and functional plasticity of cells of innate immunity: Macrophages, mast cells and neutrophils. Nat Immunol 12, 1035–1044. [DOI] [PMC free article] [PubMed] [Google Scholar]
- Galli SJ, Grimbaldeston M & Tsai M (2008). Immunomodulatory mast cells: Negative, as well as positive, regulators of immunity. Nat Rev Immunol 8, 478–486. [DOI] [PMC free article] [PubMed] [Google Scholar]
- Galli SJ & Tsai M (2012). IgE and mast cells in allergic disease. Nat Immunol 18, 693–704. [DOI] [PMC free article] [PubMed] [Google Scholar]
- Gerber PA, Buhren BA, Schrumpf FI., Homey B, Zlotnik A & Hevezi P. (2014). The top skin-associated genes: A comparative analysis of human and mouse skin transcriptomes. Biol Chem 395, 577–591. [DOI] [PubMed] [Google Scholar]
- Giannou AD, Marazioti A, Spella M, Kanellakis NI, Apostolopoulou H, Psallidas F, Prijovich ZM, Vreka M, Zazara DE, Lilis F, Papaleonidopoulos V, Kairi CA, Patmanidi AL, Giopanou L, Spiropoulou N, Harokopos V, Aidinis V, Spyratos D, Teliousi S, Papadaki H, Taraviras S, Snyder LA, Eickelberg O, Kardamakis D, Iwakura Y, Feyerabend TB, Rodewald HR, Kalomenidis I, Blackwell TS, Agalioti T & Stathopoulos GT (2015). Mast cells mediate malignant pleural effusion formation. J Clin Invest 125, 2317–2334. [DOI] [PMC free article] [PubMed] [Google Scholar]
- Grizzi F & Dioguardi N (1999). A fractal scoring system for quantifying active collagen synthesis during chronic liver disease. Int J Chaos Theo Appl 21, 262–266. [Google Scholar]
- Grizzi F, Russo C, Colombo P, Franceschini B, Frezza EE, Cobos E & Chiriva-Internati M (2005). Quantitative evaluation and modelling of two-dimensional neovascular network complexity: The surface fractal dimension. BMC Cancer 5, 14–23. [DOI] [PMC free article] [PubMed] [Google Scholar]
- Hamilton MJ, Hornick JL, Akin C, Castells MC & Greenberger NJ (2011). Mast cell activation syndrome: A newly recognized disorder with systemic clinical manifestations. J Allergy Clin Immunol 128, 147–152. [DOI] [PubMed] [Google Scholar]
- Hart PH, Grimbaldeston MA, Swift GJ, Jaksic A, Noonan FP & Finlay-Jones JJ (1998). Dermal mast cells determine susceptibility to ultraviolet B-induced systemic suppression of contact hypersensitivity responses in mice. J Exp Med 187, 2045–2053. [DOI] [PMC free article] [PubMed] [Google Scholar]
- Hart PH, Grimbaldeston MA, Hosszu EK, Swift GJ, Noonan FP & Finlay-Jones JJ (1999). Age-related changes in dermal mast cell prevalence in BALB/c mice: Functional importance and correlation with dermal mast cell expression of Kit. Immunology 98, 352–356. [DOI] [PMC free article] [PubMed] [Google Scholar]
- Jelinek HF, Ristanovic D & Milosevic NT (2011). The morphology and classification of a ganglion cells in the rat retinae: A fractal analysis study. J Neurosci Methods 201, 281–287. [DOI] [PubMed] [Google Scholar]
- Kalesnikoff J & Galli SJ (2008). New developments in mast cell biology. Nat Immunol 9, 1215–1223. [DOI] [PMC free article] [PubMed] [Google Scholar]
- Lagunoff D (1974). Analysis of dye binding sites in mast cell granules. Biochemistry 19, 3982–3986. [DOI] [PubMed] [Google Scholar]
- Mandelbrot BB (1982). The Fractal Geometry of Nature, 1st ed. New York: W. H. Freeman and Company. [Google Scholar]
- Marshall JS (2004). Mast-cell responses to pathogens. Nat Rev Immunol 4, 787–799. [DOI] [PubMed] [Google Scholar]
- Manera M, Dezfuli BS, Borreca C & Giari L (2014). The use of fractal dimension and lacunarity in the characterization of mast cell degranulation in rainbow trout (Onchorhynchus mykiss). J Microsc 256, 82–89. [DOI] [PubMed] [Google Scholar]
- Mcnally JG & Mazza D (2010). Fractal geometry in the nucleus. EMBO J 29, 2–3. [DOI] [PMC free article] [PubMed] [Google Scholar]
- Moon TC, Befus AD & Kulka M (2014). Mast cell mediators: Their differential release and the secretory pathways involved. Front Immunol 5, 1–18. [DOI] [PMC free article] [PubMed] [Google Scholar]
- Moledina S, de Bruyn A, Schievano S, Owens CM, Young C, Haworth SG, Taylor AM, Schulze-Neick I & Muthurangu V (2011). Fractal branching quantifies vascular changes and predicts survival in pulmonary hypertension: a proof of principle study. Heart 97, 1245–1249. [DOI] [PubMed] [Google Scholar]
- Nezadal M, Zemeskal O & Buchnicek M (2001). The boxcounting: Critical study, 4th Conference on Prediction, Synergetic and More, The Faculty of Management, Institute of Information Technologies, Faculty of Technology, Tomas Bata University in Zlin, HarFA software, October 25–26, p. 18. [Google Scholar]
- Oldford SA & Marshall JS (2015). Mast cells as targets for immunotherapy of solid tumors. Mol Immunol 63, 113–124. [DOI] [PubMed] [Google Scholar]
- Oskeritzian CA (2015). Mast cell plasticity and sphingosine-1-phosphate in immunity, inflammation and cancer. Mol Immunol 63, 104–112. [DOI] [PMC free article] [PubMed] [Google Scholar]
- Oskeritzian CA, Alvarez SE, Hait NC, Price MM, Milstien S & Spiegel S (2008). Distinct roles of sphingosine kinases 1 and 2 in human mast cell functions. Blood 111, 4193–4200. [DOI] [PMC free article] [PubMed] [Google Scholar]
- Oskeritzian CA, Hait NC, Wedman P, Chumanevich A, Kolawole EM, Price MM, Falanga YT, Harikumar KB, Ryan JJ, Milstien S, Sabbadini R & Speigel S (2015). The sphingosine-1-phosphate/sphingosine-1-phosphate receptor 2 axis regulates early airway T-cell infiltration in murine mast cell-dependent acute allergic responses. J Allergy Clin Immunol 135, 1008–1018. [DOI] [PMC free article] [PubMed] [Google Scholar]
- Oskeritzian CA, Price MM, Ryan JJ, Hait NC, Kapitonov D, Falanga Y, Morales JK, Milstien S & Spiegel S (2010). Essential role of sphingosine-1-phosphate receptor 2 in human mast cell activation, anaphylaxis, and pulmonary edema. J Exp Med 207, 465–474. [DOI] [PMC free article] [PubMed] [Google Scholar]
- Qian AR, Li D, Han J, Gao X, Di SM, Zhang W, Hu LF. & Shang P. (2012). Fractal dimension as a measure of altered actin cytoskeleton in MC3T3-E1 cells under simulated microgravity using 3-D/2-D clinostats. IEEE Trans Biomed Eng 59, 1374–1380. [DOI] [PubMed] [Google Scholar]
- Rafail S, Kourtzelis I, Foukas PG, Markiewski MM, Deangelis RA, Guariento M, Ricklin D, Grice EA & Lambris JD (2015). Complement deficiency promotes cutaneous wound healing in mice. J Immunol 194, 1285–1291. [DOI] [PMC free article] [PubMed] [Google Scholar]
- Reber LL, Marichal T & Galli SJ (2012). New models for analyzing mast cell functions in vivo. Trends Immunol 33, 613–625. [DOI] [PMC free article] [PubMed] [Google Scholar]
- Ribatti D (2013). Mast cells and macrophages exert beneficial and detrimental effects on tumor progression and angiogenesis. Immunol Lett 152, 83–88. [DOI] [PubMed] [Google Scholar]
- Rogers JA & Fuseler JW (2007). Regulation of NF-κB activation and nuclear translocation by exogenous nitric oxide (NO) donors in TNF-α activated vascular endothelial cells. Nitric Oxide 16, 379–391. [DOI] [PubMed] [Google Scholar]
- Schwartz LB, Metcalfe DD, Miller JS, Earl H & Sullivan T (1987). Tryptase levels as an indicator of mast-cell activation in systemic anaphylaxis and mastocytosis. N Engl J Med 316, 1622–1626. [DOI] [PubMed] [Google Scholar]
- Sedivy R, Thurner S, Budinsky AC, Kostler WJ & Zielinski CC (2002). Short-term rhythmic proliferation of human breast cancer cell lines: Surface effects and fractal growth patterns. J Pathol 197, 163–169. [DOI] [PubMed] [Google Scholar]
- Smith TG, Lange GD & Marks WB (1996). Fractal methods and results in cellular morphology-dimensions, lacunarity and multifractals. J Neurosci Methods 39, 123–136. [DOI] [PubMed] [Google Scholar]
- Streba L, Forţofoiu MC, Popa C, Ciobanu D, Gruia CL, Mogoanta SŞ. & Streba CT. (2015). A pilot study on the role of fractal analysis in the microscopic evaluation of colorectal cancers. Rom J Morphol Embryol 56, 191–196. [PubMed] [Google Scholar]
- Thamrin C, Stern G & Frey U (2010). Fractals for physicians. Paediatr Respir Rev 11, 123–131. [DOI] [PubMed] [Google Scholar]
- Theoharides TC, Alysandratos K-D, Angelidou A, Delivanis D-A, Sismanopoulos N, Zhang B, Asadi S, Vasiadi M, Weng Z, Miniati A & Kalogeromitros D (2012). Mast cells and inflammation. Biochim Biophys Acta 1822, 21–33. [DOI] [PMC free article] [PubMed] [Google Scholar]
- Valent P, Horny H-P, Triggiani M & Arock M (2011). Clinical and laboratory parameters of mast cell activation as basis for the formulation of diagnostic criteria. Int Arch Allergy Immunol 156, 119–127. [DOI] [PubMed] [Google Scholar]
- Voehringer D (2013). Protective and pathological roles of mast cells and basophils. Nat Rev Immunol 13, 362–375. [DOI] [PubMed] [Google Scholar]
- Walter RJ Jr. & Berns MW (1986). Digital image processing and analysis. In Video Microscopy, Inoue S. (Ed.), pp. 327–392. New York and London: Plenum Press. [Google Scholar]
- Wernersson S & Pejler G (2014). Mast cell secretory granules: Armed for battle. Nat Rev Immunol 14, 478–494. [DOI] [PubMed] [Google Scholar]
- Wick N, Thurner S, Paiha K, Sedivy R, Vietor I & Huber LA (2003). Quantitative measurement of cell migration using time-lapse videomicroscopy and non-linear system analysis. Histochem Cell Bio 119, 15–20. [DOI] [PubMed] [Google Scholar]
- Wolters PJ, Mallen-St Clair, J., Lewis CC, Villalta SA, Baluk P, Erle DJ & Caughey GH (2005). Tissue-selective mast cell reconstitution and differential lung gene expression in mast cell-deficient KitW-sh/KitW-sh sash mice. Clin Exp Allergy 35, 82–88. [DOI] [PMC free article] [PubMed] [Google Scholar]
- Zhang L, Liu JZ, Dean D, Sahgal V & Yue GH (2006). A three-dimensional fractal analysis method for quantifying white matter structure in human brain. J Neurosci Methods 150, 242–253. [DOI] [PubMed] [Google Scholar]
- Zouien FA, Kurdi M, Booz GW & Fuseler JW (2014). Applying fractal dimension and image analysis to quantify fibrotic collagen deposition and organization in the normal and hypertensive heart. Microsc Microanal 20, 1134–1144. [DOI] [PubMed] [Google Scholar]