FIG 1.
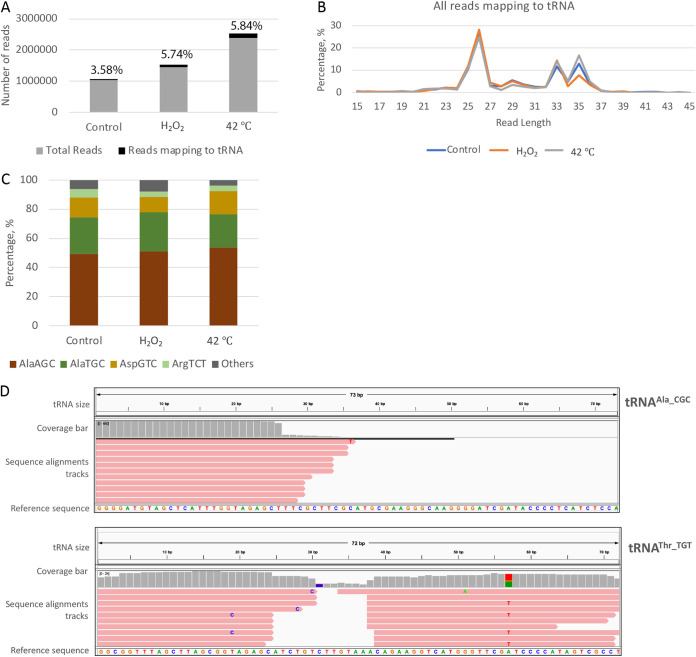
Bioinformatics analyses of the small-RNA sequencing data set from E. histolytica demonstrates the presence of tRFs. (A) Small-RNA sequences generated from size-selected libraries from E. histolytica under either basal or stress conditions were mapped to tRNA sequences using Bowtie. Chart showing the percentage of sequence reads that map to tRNA in different samples. (B) Length distribution of the different reads that mapped to tRNA sequences. (C) Frequency of reads mapping to the four most abundant tRNAs seen. (D) Representative IGV mapping of sequence reads from E. histolytica (oxidative stress sample) mapping against the tRNA templates tRNAAla_CGC and tRNAThr_TGT. The top of each IGV mapping shows the size of the parent tRNA template (72 and 73 nt for tRNAAla_CGC and tRNAThr_TGT, respectively). The coverage bar in gray displays the depth of the reads at each locus as a bar chart. Below this, the sequence alignment tracks represent each sequence read aligned to the parent tRNA, whose sequence is shown as the reference sequence at the bottom. As seen for a majority of tRNAs, both 5′ and 3′ tRNA halves were observed for tRNAThr_TGT. However, only the 5′ tRNA half was observed for tRNAAla_CGC.

