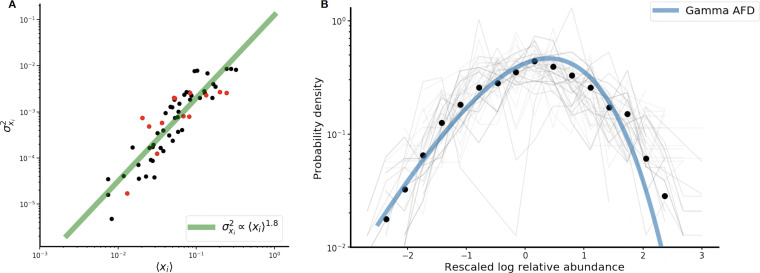
FIG 3.
(A) Scaling of the variance in strain abundance with the mean abundance obeys Taylor’s law with an exponent of 1.8. Black dots are strains passing the SLM, while red dots are strains failing the SLM. (B) Strain abundances approximately follow a gamma distribution, which is the stationary distribution of the SLM. Black circles are the average probability densities of the rescaled abundances across all strains, and the blue line is the gamma fit of the bin means of the rescaled distributions. Light-gray lines are the individual rescaled abundance distributions for each strain individually (62 in total).

