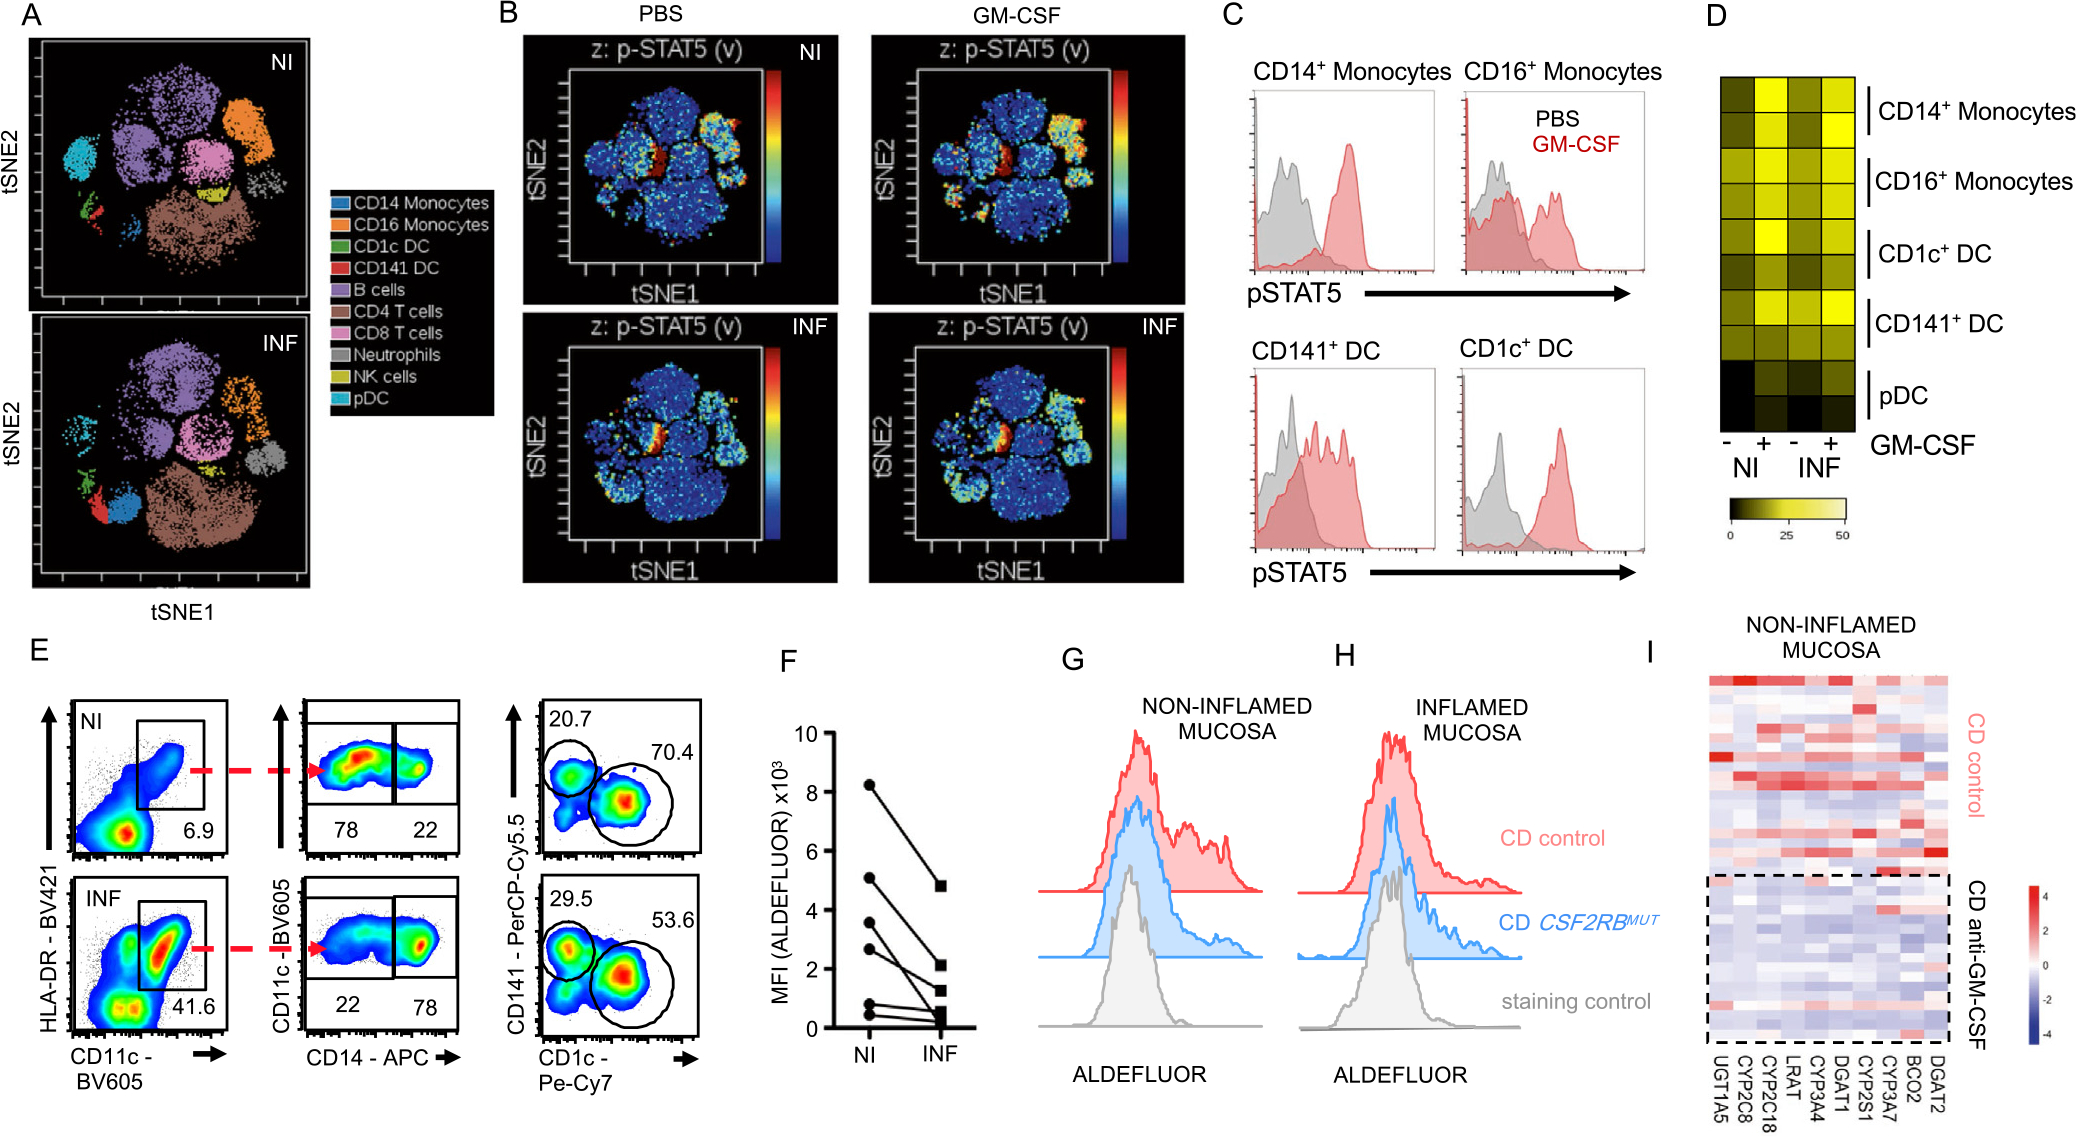
Figure 3.

The inflamed CD mucosa shows impaired homeostatic functions in GM-CSF–responsive myeloid cells. Lamina propria leukocytes from NI and INF ileal mucosa were analyzed. (A) Visualized stochastic neighbor embedding analysis shows distribution of leukocyte populations in NI and INF tissues indicating supervised annotation of populations. (B) Stimulation of cells in (A) with GM-CSF, followed by pSTAT5 measurement. Signal intensity is visualized in t-distributed stochastic neighbor embedding plots (blue = low, red = high pSTAT5). (C) Representative histograms show pSTAT5 levels in the indicated myeloid cell populations. (D) Heat map shows pSTAT5 intensity across myeloid populations from (A) and (B). (E) DC subset and macrophage identification by flow cytometry. (F) Mean fluorescence intensity (MFI) of ALDEFLOUR staining in CD45+CD11c+HLA-DR+ cells. ALDEFLUOR staining in CD45+CD11+HLA-DR+ cells in CD control and one CSF2RBMUT carrier from (G) NI and (H) INF tissue biopsies. (I) Heat map shows gene expression for genes associated with retinol metabolism in NI ileal tissues of aGMAb+ or aGMAb− patients with CD.
