FIG 2.
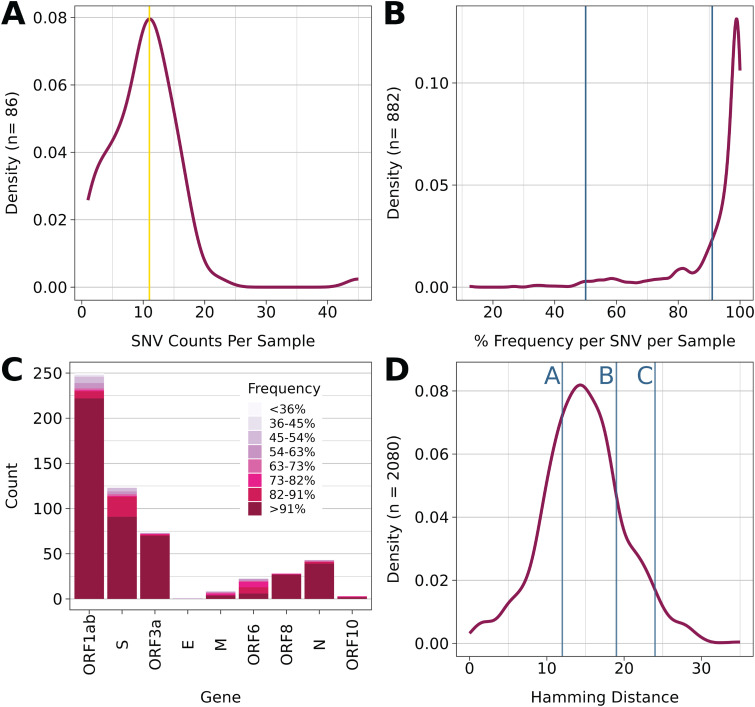
Summary of genome diversity. (A) Distribution of SNVs per sample. (B) Distribution of all SNV frequencies in the data set. (C) Count of nonsynonymous SNVs per gene, color-coded by frequency of the SNV (D) Distribution of Hamming distances of all sequenced samples that contained at least 1 SNV of Frequency greater than or equal to 51% (n = 65) representing 2080 comparisons. Blue lines indicated the hamming distance between paired samples. Line A represents LCCC0245 and its preceding sample of <90% coverage. Line B represents LCCC0187 and LCCC0225. Line C represents LCCC0233 and LCCC0239.

