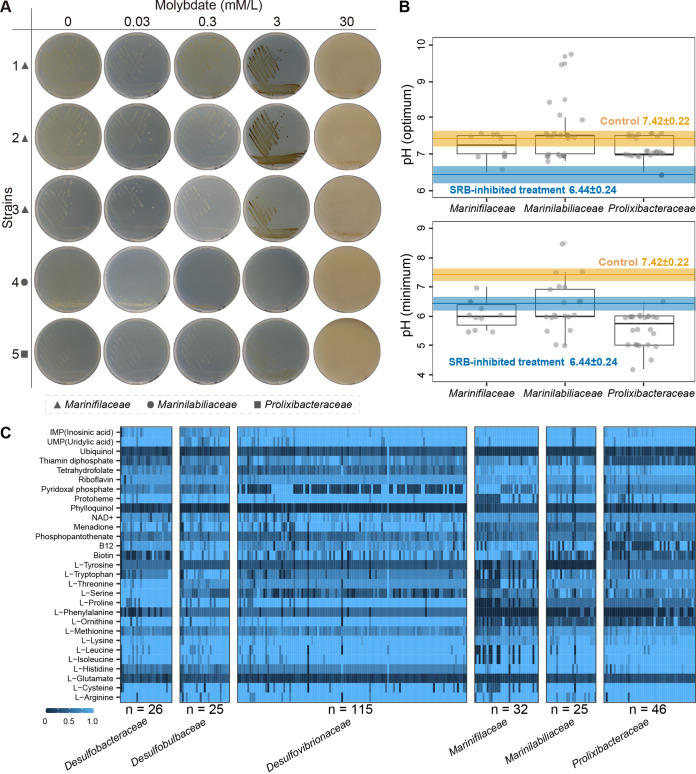
FIG 6.
The molybdate tolerance phenotype and growth pH of the order Marinilabiliales and metabolic reconstructions. (A) Representative images of the five Marinilabiliales strains cultured with molybdate in a series of concentrations (0, 0.03, 0.3, 3, and 30 mM/L) (Table S3B in the supplemental material). Triangle, circle, and square symbols represent the families Marinifilaceae, Marinilabiliaceae, and Prolixibacteraceae, respectively. (B) The two subgraphs display the optimal (top) and minimal (bottom) pH of the order Marinilabiliales members validly published according to the International Code of Nomenclature of Prokaryotes (ICNP) (Table S3C). The orange and blue segments represent the variation of pH on incubation days 12 in the control and SRB-inhibited treatment groups, respectively. (C) Metabolic capacities of the family Desulfobacteraceae (n = 26), Desulfobulbaceae (n = 25), Desulfovibrionaceae (n = 115), Marinifilaceae (n = 32), Marinilabiliaceae (n = 25), and Prolixibacteraceae (n = 46) were reconstructed based on the 29 metabolites (15 amino acids, 12 cofactors, and 2 nucleic acids). The blue and dark segments represent the complete and incomplete pathways in metabolic reconstruction, respectively.

