Abstract
The emergence of the Halcyon linear accelerator has allowed for increased patient throughput and improved treatment times for common treatment sites in radiation oncology. However, it has been shown that this can lead to increased surface dose in sites like breast cancer compared with treatments on conventional machines with flattened radiation beams. Cherenkov imaging can be used to estimate surface dose by detection of Cherenkov photons emitted in proportion to energy deposition from high energy electrons in tissue. Phantom studies were performed with both square beams in reference conditions and with clinical treatments, and dosimeter readings and Cherenkov images report higher surface dose (25% for flat phantom entrance dose, 5.9% for breast phantom treatment) from Halcyon beam deliveries than for equivalent deliveries from a TrueBeam linac. Additionally, the first Cherenkov images of a patient treated with Halcyon were acquired, and superficial dose was estimated.
Keywords: Cherenkov, radiation therapy, optical imaging, surface dose, in vivo dosimetry
1. INTRODUCTION
Breast cancer is a common treatment site in radiation oncology and is typically treated with two tangentially-oriented beams designed to irradiate breast tissue and spare the underlying regions of the chest. On conventional C-arm linear accelerators (linacs), such as the Varian TrueBeam, breast treatments typically use 6 and/or 10 megavolt (MV) x-ray beams with a flattening filter. In recent years, the Varian Halcyon linac has been introduced as a high-throughput alternative to C-arm linacs and combines faster gantry speeds and an enclosed O-ring design with a single 6 MV flattening filter-free (FFF) beam to increase the available dose rates and improve treatment times [1], [2]. One consequence of the lack of a flattening filter is a lower mean x-ray energy, as the lower end of the 6 MV energy spectrum is not attenuated before reaching the patient. These effects can increase the superficial dose received by the patient, reducing the natural “skins-paring” effect of megavoltage treatments. Indeed, studies have shown an increase in superficial dose with FFF vs flattened beams from Monte Carlo simulations, commissioning beam data, as well as in vivo breast treatment measurements; in the latter case, increases in superficial dose of 10–15% have been reported [3]–[5].
Cherenkov imaging is a relatively new imaging modality which uses highly sensitive time-gated cameras to capture optical photons emitted via the Cherenkov effect from therapeutic radiation beams. Cherenkov emission occurs when charged particles move faster than the speed of light in a dielectric medium, resulting in photons emitted in a range of optical wavelengths related to the energy of the incident charged particle [6], [7]. In x-ray radiotherapy, Cherenkov photons are emitted from the transport of secondary electrons through patient tissue or dielectric phantom material in relation to the absorbed dose imparted to the medium. The relationship between Cherenkov emission and dose has been investigated in prior work and is known to depend on particle energy and the optical properties of the medium [8]–[10]. Experimental results show that Cherenkov emission imaged with a highly sensitive camera is linear with surface dose in optically homogeneous media for a given beam energy, and significant progress has been made towards developing techniques to convert imaged Cherenkov emission from patients to dose readings, particularly in breast radiotherapy and total skin electron therapy (TSET) [10]–[14].
This paper explores the use of Cherenkov imaging to estimate and compare superficial dose from FFF x-ray beams delivered by the Varian Halcyon to flattened beams delivered by the Varian TrueBeam in the context of phantom and patient setups. Additionally, this study shows the first patient images acquired from a Halcyon treatment to date.
2. MATERIALS AND METHODS
2.1. Equipment and Setup
All Cherenkov images were acquired using a tripod-mounted C-Dose Research iCMOS camera (DoseOptics LLC, Lebanon NH) in conjunction with the accompanying software. This camera was outfitted with a Gen3 intensifier tube with a red-weighted sensitivity spectrum, as well as a 50 mm Nikon lens set to an f/1.8 aperture [15]. In order to correct for lens vignetting and heterogeneous intensifier sensitivity, a uniformly illuminated image was acquired using an LED backlight (Advanced Illumination, Rochester VT) and all acquired images were divided by the normalized flat field image, which is shown in Figure 1.
Figure 1.
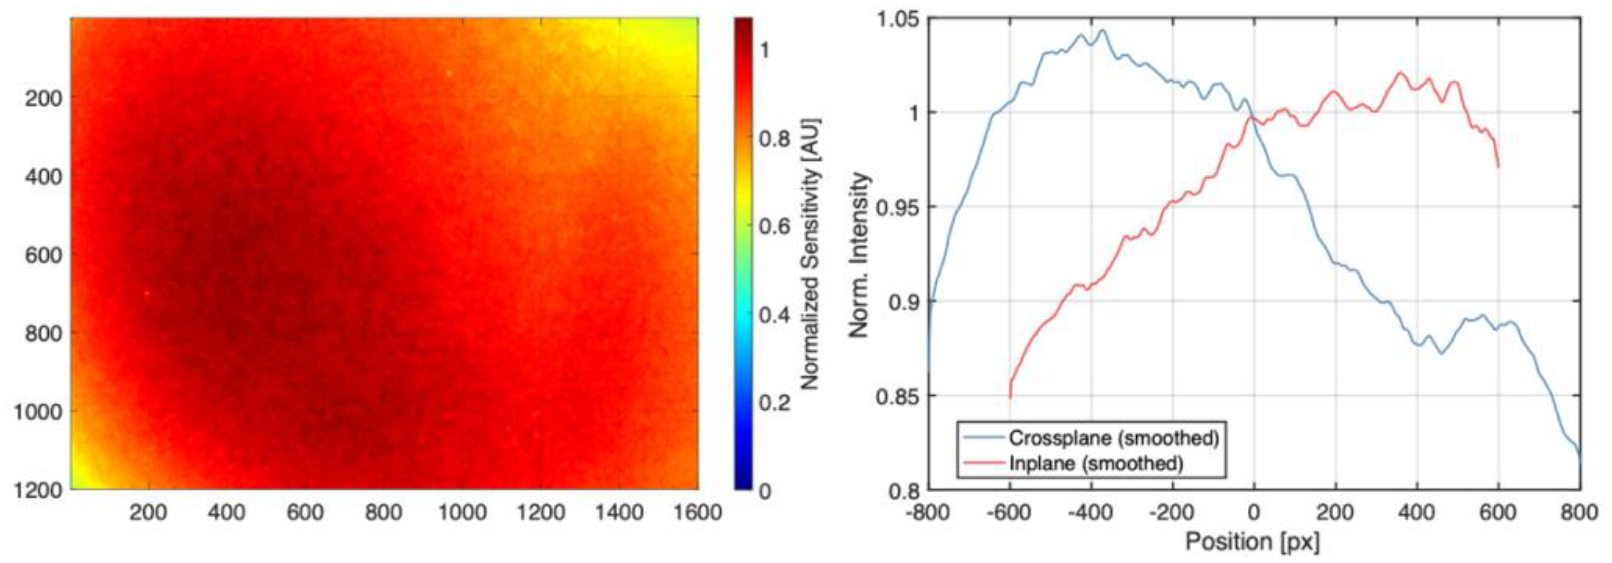
Left: Normalized flat-field image indicating heterogenous camera sensitivity. Right: Crossplane (horizontal) and inplane (vertical) sensitivity profile. The data is normalized to 1 at the center of the 1600 × 1200 imaging chip (800, 600).
The skewed sensitivity distribution shown in Figure 1 is a result of intensifier burn-in from prior use and is corrected for in all experimental data by division by this normalized distribution. For image perspective correction and image registration, a 50 × 50 × 2 cm ABS reference board was included with the C-Dose Research system and provided a printed 6 × 7 checkerboard pattern with 3 cm squares.
Phantoms used in this study included a white opaque solid water block with dimensions of 30 × 30 cm, as well as a silicone breast phantom with tissue-like optical properties, which have been characterized in prior work [15]. Images of these phantoms can be found in Figure 2. For surface dose point measurements, optically stimulated luminescent dosimeters (OSLDs) (NanoDot, Landauer, Glenwood IL) were used, with reported accuracy of 3–5% [16], [17]. The in-house OLSD calibration curve for clinical in vivo dosimetry measurements at our institution was used for all experimental readings. Irradiation was performed in our clinic using both a Varian Halcyon 6 MV FFF beam and a Varian TrueBeam 6 MV beam.
Figure 2.
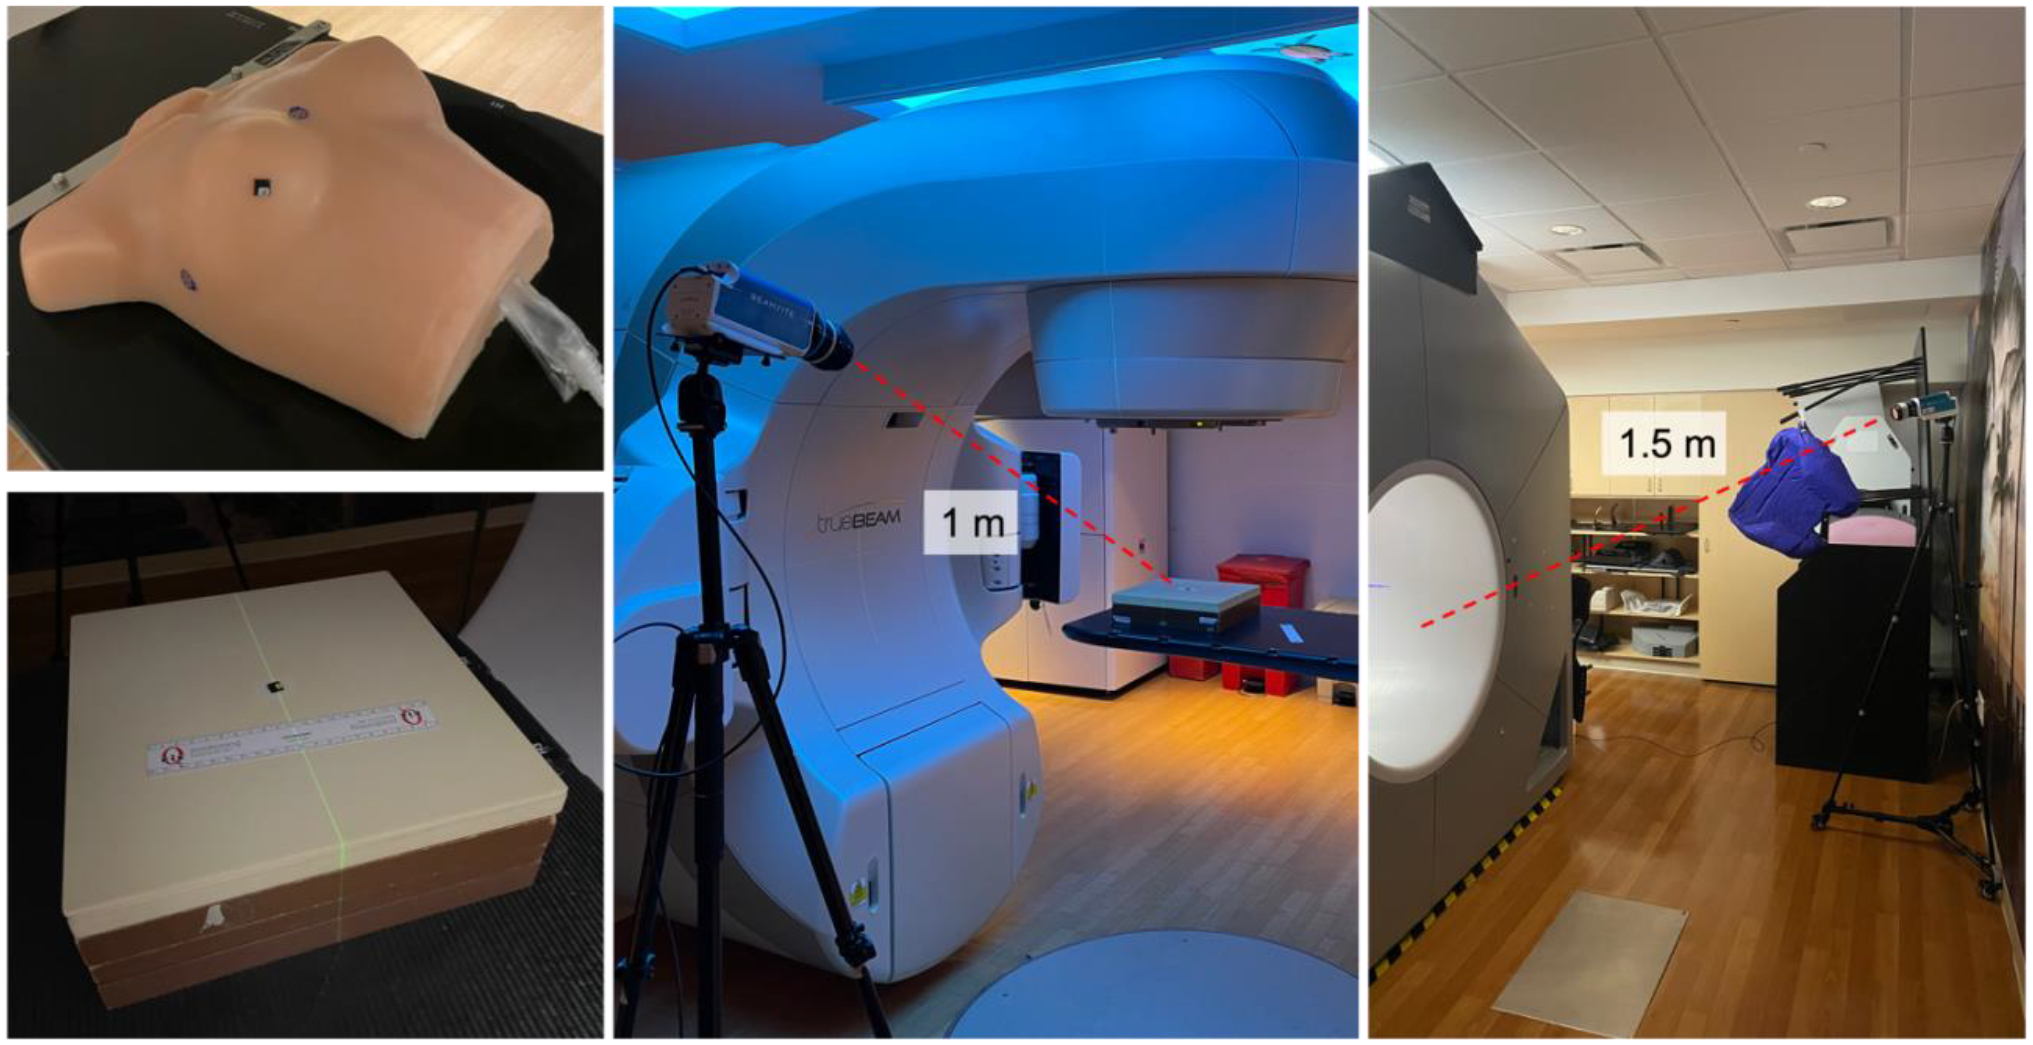
Upper left: Tissue-like breast phantom used for breast treatment studies. Lower Left: Opaque solid water phantom used for flat phantom imaging studies. Center: Flat phantom imaging setup, with tripod-mounted C-Dose camera position 1 m from isocenter. Right: Patient imaging setup on Halcyon, with tripod-mounted C-Dose camera positioned 1.5 m from isocenter, behind the bore to the patient left.
2.2. Treatment Planning
Radiation treatment plans were made for the breast phantom using the Eclipse treatment planning system (TPS) (Varian Medical Systems, Palo Alto CA). First, the breast phantom was scanned on the CT simulator in our clinic. Then, two comparable clinically acceptable whole breast treatment plans using opposed tangent beams were generated, one each for the Halcyon and the Truebeam. Each was set to 266 cGy per fraction prescription dose, and dose homogeneity was achieved using a dynamic MLC sequence optimized with EZFluence (Radformation, New York NY). Additionally, a variant of the TrueBeam plan was created with the MLC sequence removed for simpler comparison with Monte Carlo simulations discussed below. Relevant plan parameters are presented in Table 1, while beam’s eye views and dose cross sections are displayed in Figure 3.
Table 1.
Plan parameters
| Plan | Rx Dose | Field | Monitor Units | Gantry Angle | Collimator Angle |
|---|---|---|---|---|---|
| Halcyon | 266 cGy | LAO | 274 | 50° | 357° |
| RPO | 252 | 229° | 3° | ||
| TrueBeam | 266 cGy | LAO | 241 | 50° | 357° |
| RPO | 213 | 229° | 3° | ||
| TrueBeam (No MLC) | 598 cGy | LAO | 270 | 50° | 357° |
| RPO | 324 | 229° | 3° |
Figure 3.
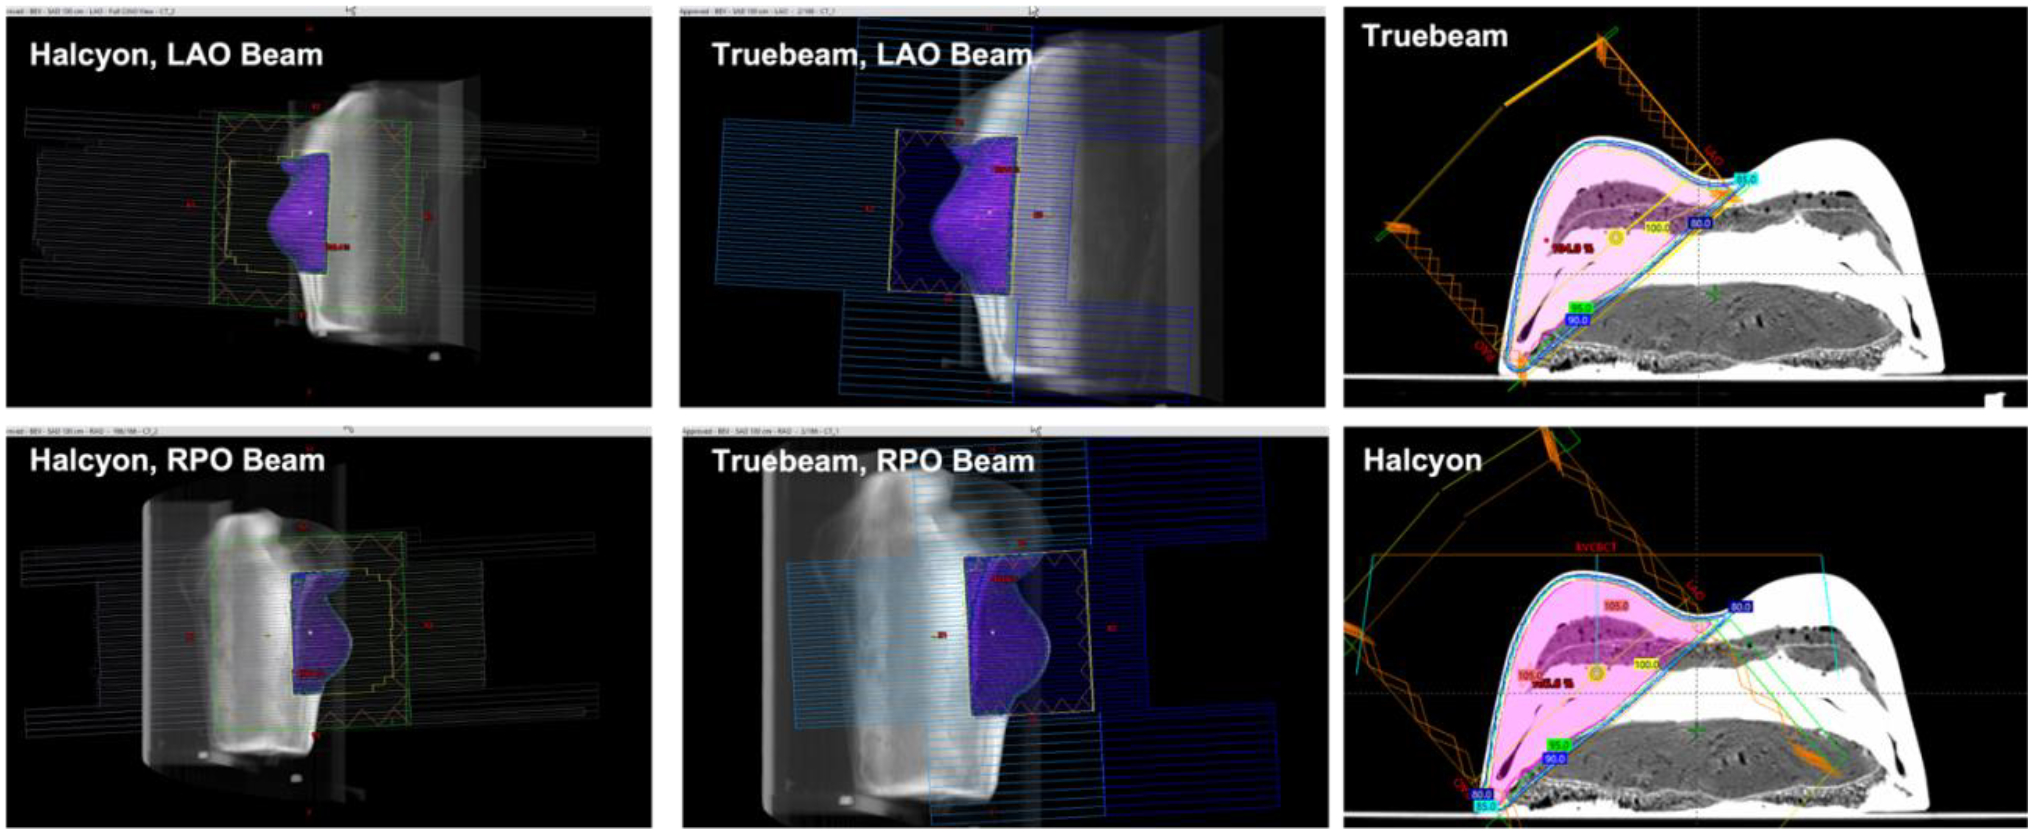
Beam’s eye view perspective for each beam of both the Halcyon and TrueBeam breast phantom plans, along with isocentric cross section of dose volume overlayed on the phantom CT image. Images produced from the TPS.
2.3. Monte Carlo Simulation
In order to obtain more accurate surface dose values than what is reported by the TPS, a TrueBeam Monte Carlo model was developed in TOPAS (version 3.8) using 6 MV Varian phase space files [18], [19]. The phase space file was placed 26.7 cm downstream from the target position, or 73.3 cm upstream from isocenter, as described by Varian [20]. In order to simulate the collimator, the TOPAS TsJaws object was used for both the upper and lower jaws; while not modeled after the TrueBeam jaws, the diverging angles provide a close approximation without accurate models available. The upper jaws were placed directly below the phase space plane, and the lower jaws directly below them at a 90° angle. In order to validate the TOPAS model, a 10 × 10 cm field delivery to a 40 × 40 × 40 cm water tank at 90 cm source-to-surface distance (SSD) was simulated with 3 billion histories.
To simulate the breast phantom treatment, the plan parameters from Table 1 were implemented in the TOPAS simulation, and the CT simulation scan of the breast phantom was imported and positioned in the virtual world. A simulation of 1 billion histories was run for both the RPO and LAO beams, and the dose at isocenter from the simulation output was scaled to the TPS dose at isocenter in order to ensure accurate surface dose values. To extract the surface dose from the MC dose output, a finite element mesh was generated from the phantom CT scan in MATLAB at a fixed −150 HU threshold to determine the surface position. Then at each vertex of the mesh, the dose values from the simulation were sampled along the reverse normal vector to the surface for 5 mm and the resulting values were averaged, in a similar method to that employed by Hachadorian et al in order to account for Cherenkov transport through millimeters of tissue [21]. The surface mesh faces were than assigned these resultant dose values, a 3D rendering was plotted, and the virtual camera position was manually adjusted to match the experimental view of the C-Dose camera; this way, the surface dose rendering from the simulation could be compared to the Cherenkov-based pseudodose distribution.
2.4. Flat Phantom Imaging Setup
For solid water phantom imaging, the camera was positioned such that the irradiated surface at the machine isocenter could be viewed without obstruction by the machines themselves. For both the Halcyon and the TrueBeam, the camera was positioned 1 m from the phantom surface for the solid water phantom to maximize spatial resolution for the Cherenkov intensity profiles, which were acquired at a fixed 0° gantry angle. Images of the camera placement can be found in Figure 2. Deliveries of 100 MU were performed with square field sizes of 5, 10, 20 and 28 cm (max Halcyon field size) to acquire OSLD readings, and 1000 MU was used for Cherenkov images to reduce noise, with the signal reduced by a factor of 10 to be comparable with the OSLD readings. A perspective correction using the reference board was performed by applying a projective transform to the acquired Cherenkov images and converting to a beam’s eye point of view. OSLDs were placed at the field center to normalize surface profiles and compare dose with absolute Cherenkov intensity.
2.5. Breast Phantom Imaging Setup
For breast phantom imaging, the camera was positioned such that the treatment area could be viewed while still clearing the TrueBeam gantry movement, as tangential beams were used. For both the Halcyon and the TrueBeam, the camera was positioned 1.5 m from the phantom surface to mimic the camera position of patient treatments for the breast phantom. Deliveries of the TrueBeam and Halcyon plans in Table 1 were performed and imaged, both with and without OSLDs. Using the reference board aligned to isocenter on both machines, a perspective correction was applied to the TrueBeam treatment image to register it to the Halcyon treatment image for pixel-to-pixel comparison. OSLDs were placed at three demarcated points on the phantom surface for both Halcyon and TrueBeam deliveries to compare and calibrate Cherenkov intensity to surface dose. Cherenkov based pseudodose maps were generated by applying a linear fit model to OSLD dose readings and Cherenkov intensities at the same locations on the phantom and rescaling the Cherenkov intensity maps by the fit coefficients. Separate models were generated for the TrueBeam and Halcyon data to account for the differences in Cherenkov yield at the two energies.
In addition, the TrueBeam plan without the MLC sequence was delivered and imaged, in order to compare to the MC simulated surfaced dose as described above.
2.6. Patient Imaging Setup
The two patients imaged as part of this work were enrolled in an IRB-approved clinical study at out institution. The first patient was treated to the whole right breast on the Halcyon with a prescription dose of 267 cGy per fraction with two opposed 6 MV FFF tangents. She was imaged once per week for three weeks in a row for a total of three days of imaging. The second patient was also treated to the whole right breast with a prescription dose of 267 cGy per fraction with two opposed tangents, but with a 6 MV beam on the TrueBeam, and was imaged once. For patient images on the Halcyon, the camera was placed behind the bore aimed at the superior side of the right breast, 1.5 m from isocenter, in order to accommodate setup workflow and avoid occlusion by clothing and cover sheets. Images of the camera placement can be found in Figure 2. For patient images on the TrueBeam, the camera was placed at the same height and distance from isocenter as on the Halcyon, but directly to the patient right, as the position used on the Halycon was not feasible due to the TrueBeam geometry. OSLDs were placed at various locations on the treatment area for both patients to normalize the pseudodose distribution and did not include imaging dose.
3. RESULTS
Figure 4 shows the 2D Cherenkov intensity profiles on the surface of the flat solid water phantom, with the perspective correction applied. Figure 5 shows the inplane and crossplane profiles drawn through the Cherenkov images, both scaled to OSLD readings at the beam center as well as raw counts, along with linear correlations displayed between both measurements, while Table 2 tabulated the dose readings along with percent differences. Figure 6 shows Cherenkov-converted dose maps (pseudodose) for both the Halcyon and Truebeam treatment plans, along with surface profiles drawn across the surface of each image and a histogram of pseudodose values thresholded at 90 cGy for each image. Figure 7 shows the validation results of the TOPAS MC model when compared with TrueBeam commissioning scan data from our institution, including cross plane and inplane profiles at depths of 1.5 cm, 10 cm, and 20 cm, as well as a central axis percent depth dose (PDD) curve. Figure 8 shows the comparison of Monte Carlo based superficial dose and Cherenkov based pseudodose, along with dose histograms and surface profiles. Figure 9 shows background and Cherenkov images of three fractions for patient 1, and one fraction for patient 2, including summed, LAO, and RAO field images. Lastly, Figures 10 and 11 show superficial pseudodose and OSLD results from the images taken of patient 1 and 2, respectively.
Figure 4.
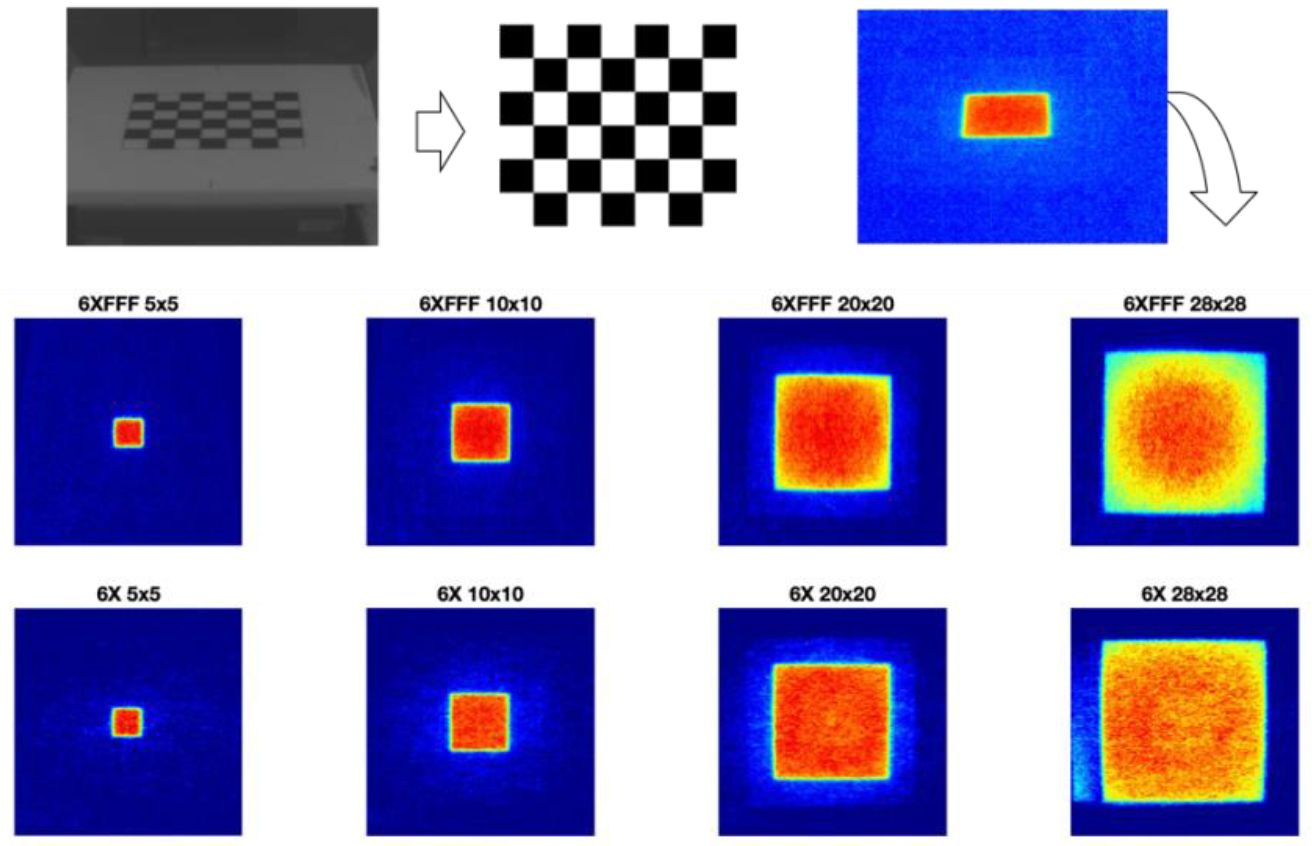
Checkerboard perspective correction applied to 2D surface Cherenkov intensity distributions.
Figure 5.
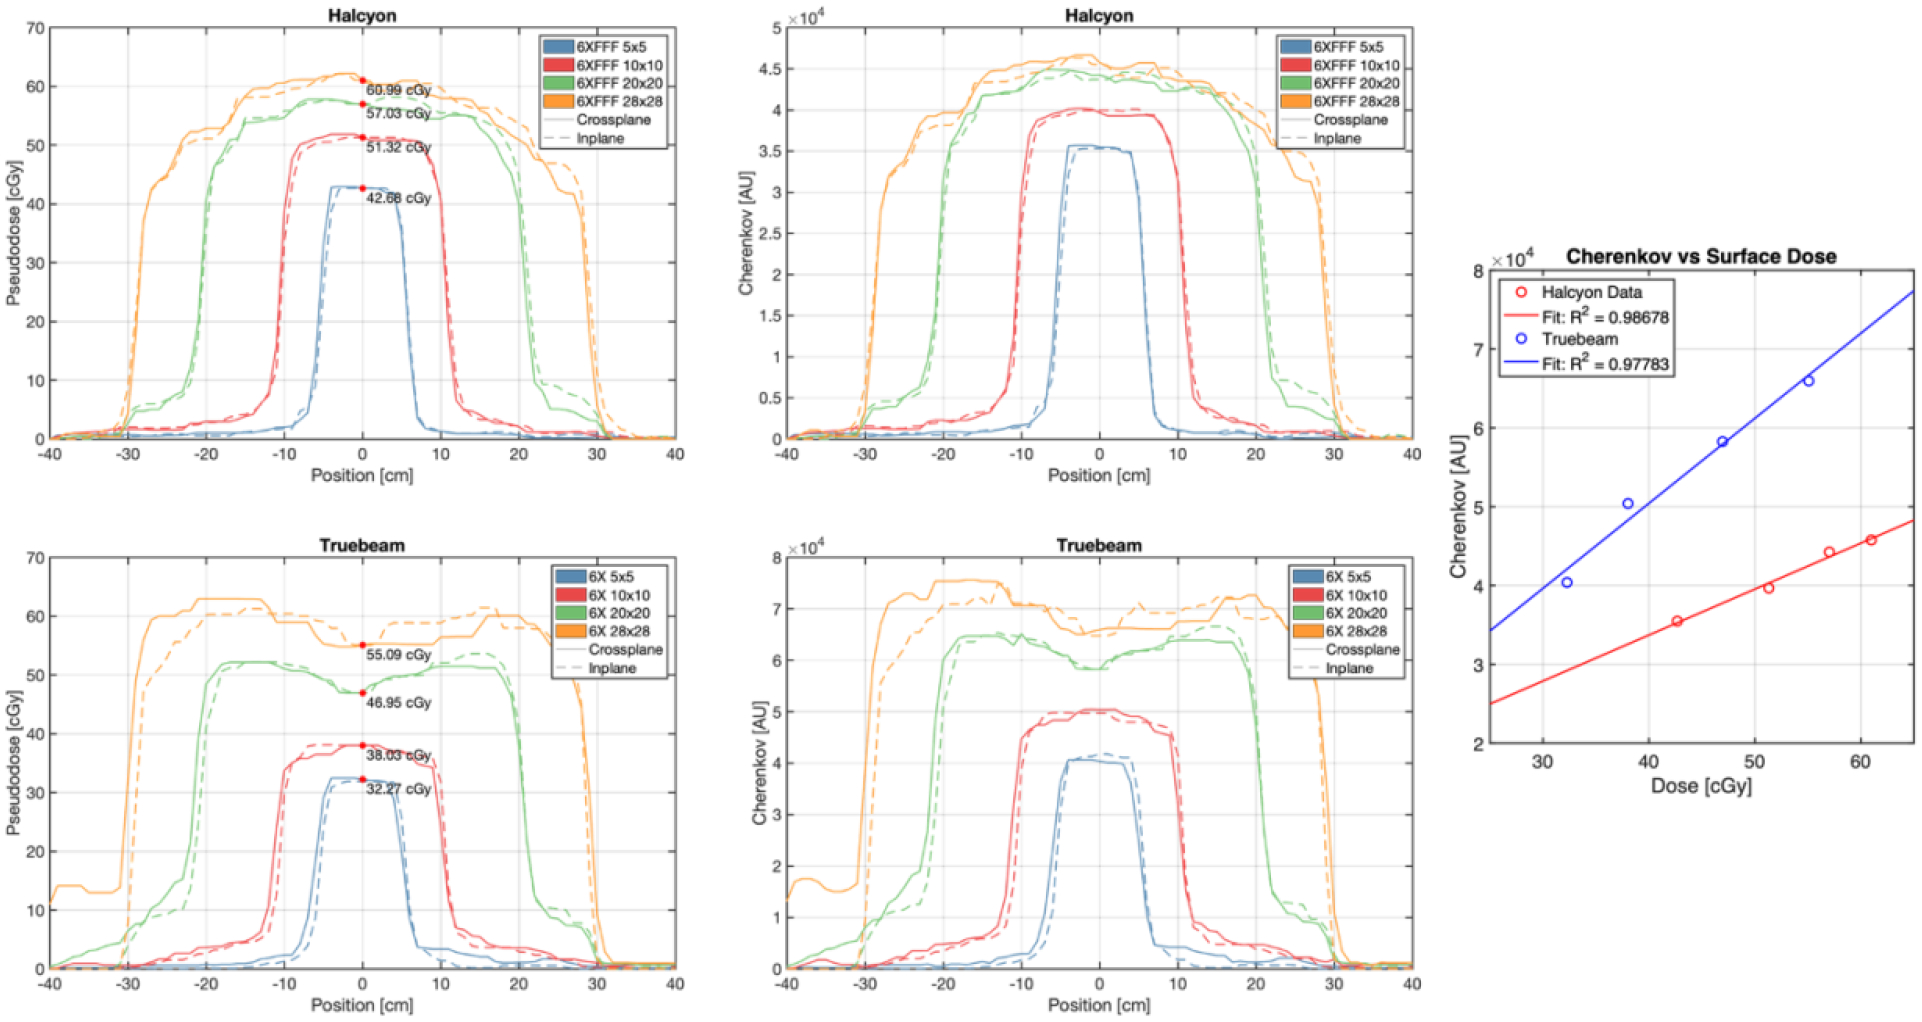
Upper left: Superficial dose-normalized Cherenkov inplane and crossplane profiles for the Halcyon 6 MV FFF beam. Upper right: Superficial raw Cherenkov inplane and crossplane profiles for the Halcyon 6 MV FFF beam. Center left: Superficial dose-normalized Cherenkov inplane and crossplane profiles for the Truebeam 6 MV beam. Center right: Superficial raw Cherenkov inplane and crossplane profiles for the TrueBeam 6 MV beam. Bottom: linear correlations between raw Cherenkov intensity and OSLD dose measured at the center of each field image.
Table 2.
Central axis surface dose for various tested field sizes.
| Field Size | Halcyon (6 MV FFF) | TrueBeam (6 MV) | % Difference |
|---|---|---|---|
| 5 × 5 cm | 42.68 cGy | 32.27 cGy | 32.2% |
| 10 × 10 cm | 51.32 cGy | 38.03 cGy | 34.9% |
| 20 × 20 cm | 57.03 cGy | 46.95 cGy | 21.5% |
| 28 × 28 cm | 60.99 cGy | 55.09 cGy | 10.7% |
Figure 6.
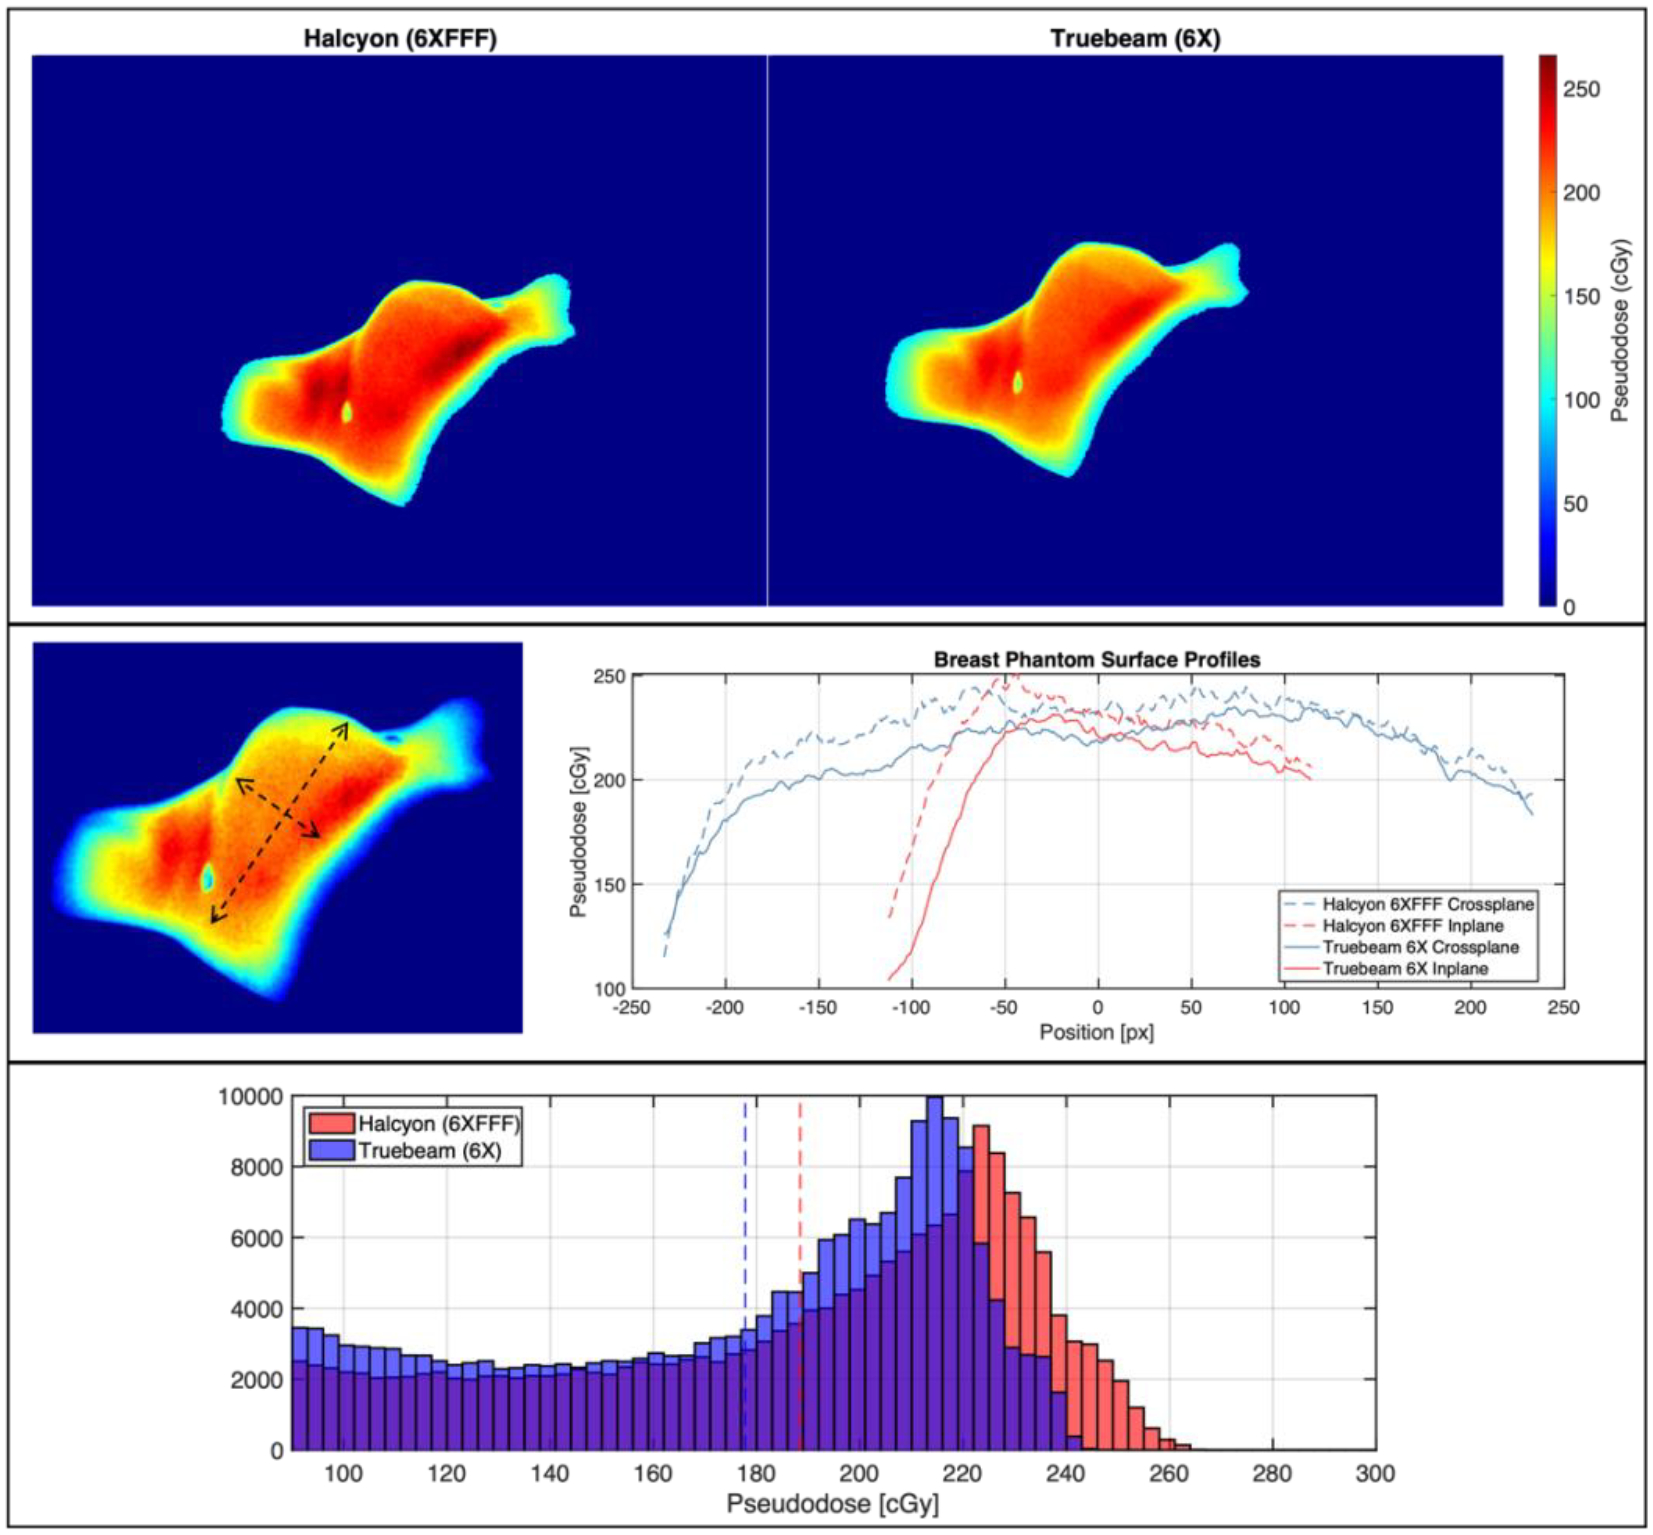
Top: Cherenkov-based superficial pseudodose maps for breast phantom treatment on Halcyon and TrueBeam. Center: Inplane and crossplane superficial pseudodose profiles for the images above. Bottom: Histograms of pseudodose for Halcyon and TrueBeam treatments, where mean values are shown with dotted lines.
Figure 7.

Left: PDD curves compared from TOPAS simulation and commissioning data for a 10 × 10 cm 6 MV beam. Center/Left: Inplane and Crossplane profiles at depths of 1.5 cm, 10 cm, and 20 cm from TOPAS simulation and commissioning data for a 10 × 10 cm 6 MV beam.
Figure 8.
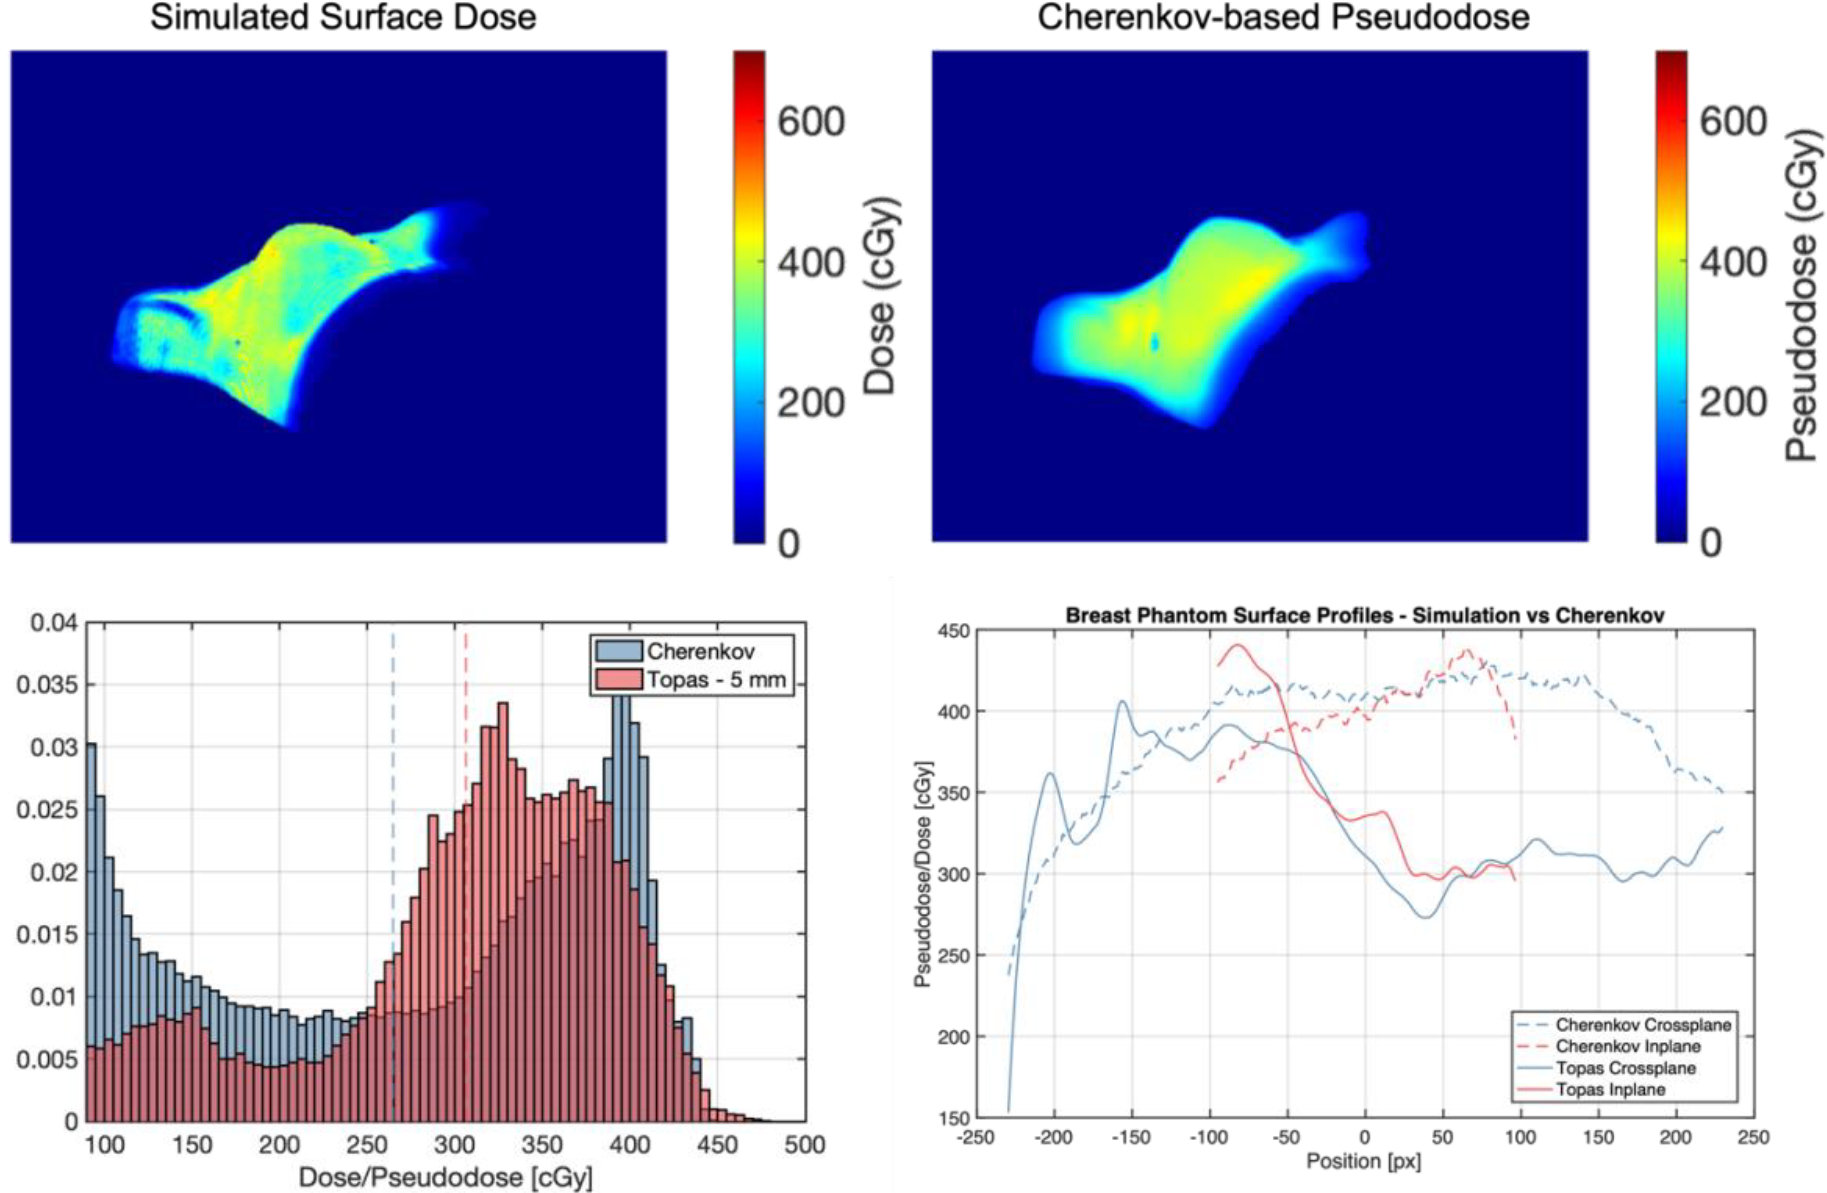
Upper left: Simulated superficial dose sampled 5 mm down from surface of breast phantom. Upper right: Cherenkov-based pseudodose measured from images of TrueBeam plan delivery without MLC sequence. Bottom right: Histograms comparing simulated dose and pseudodose maps, with mean values shown as dotted lines. Bottom right: inplane and crossplane superficial profiles.
Figure 9.
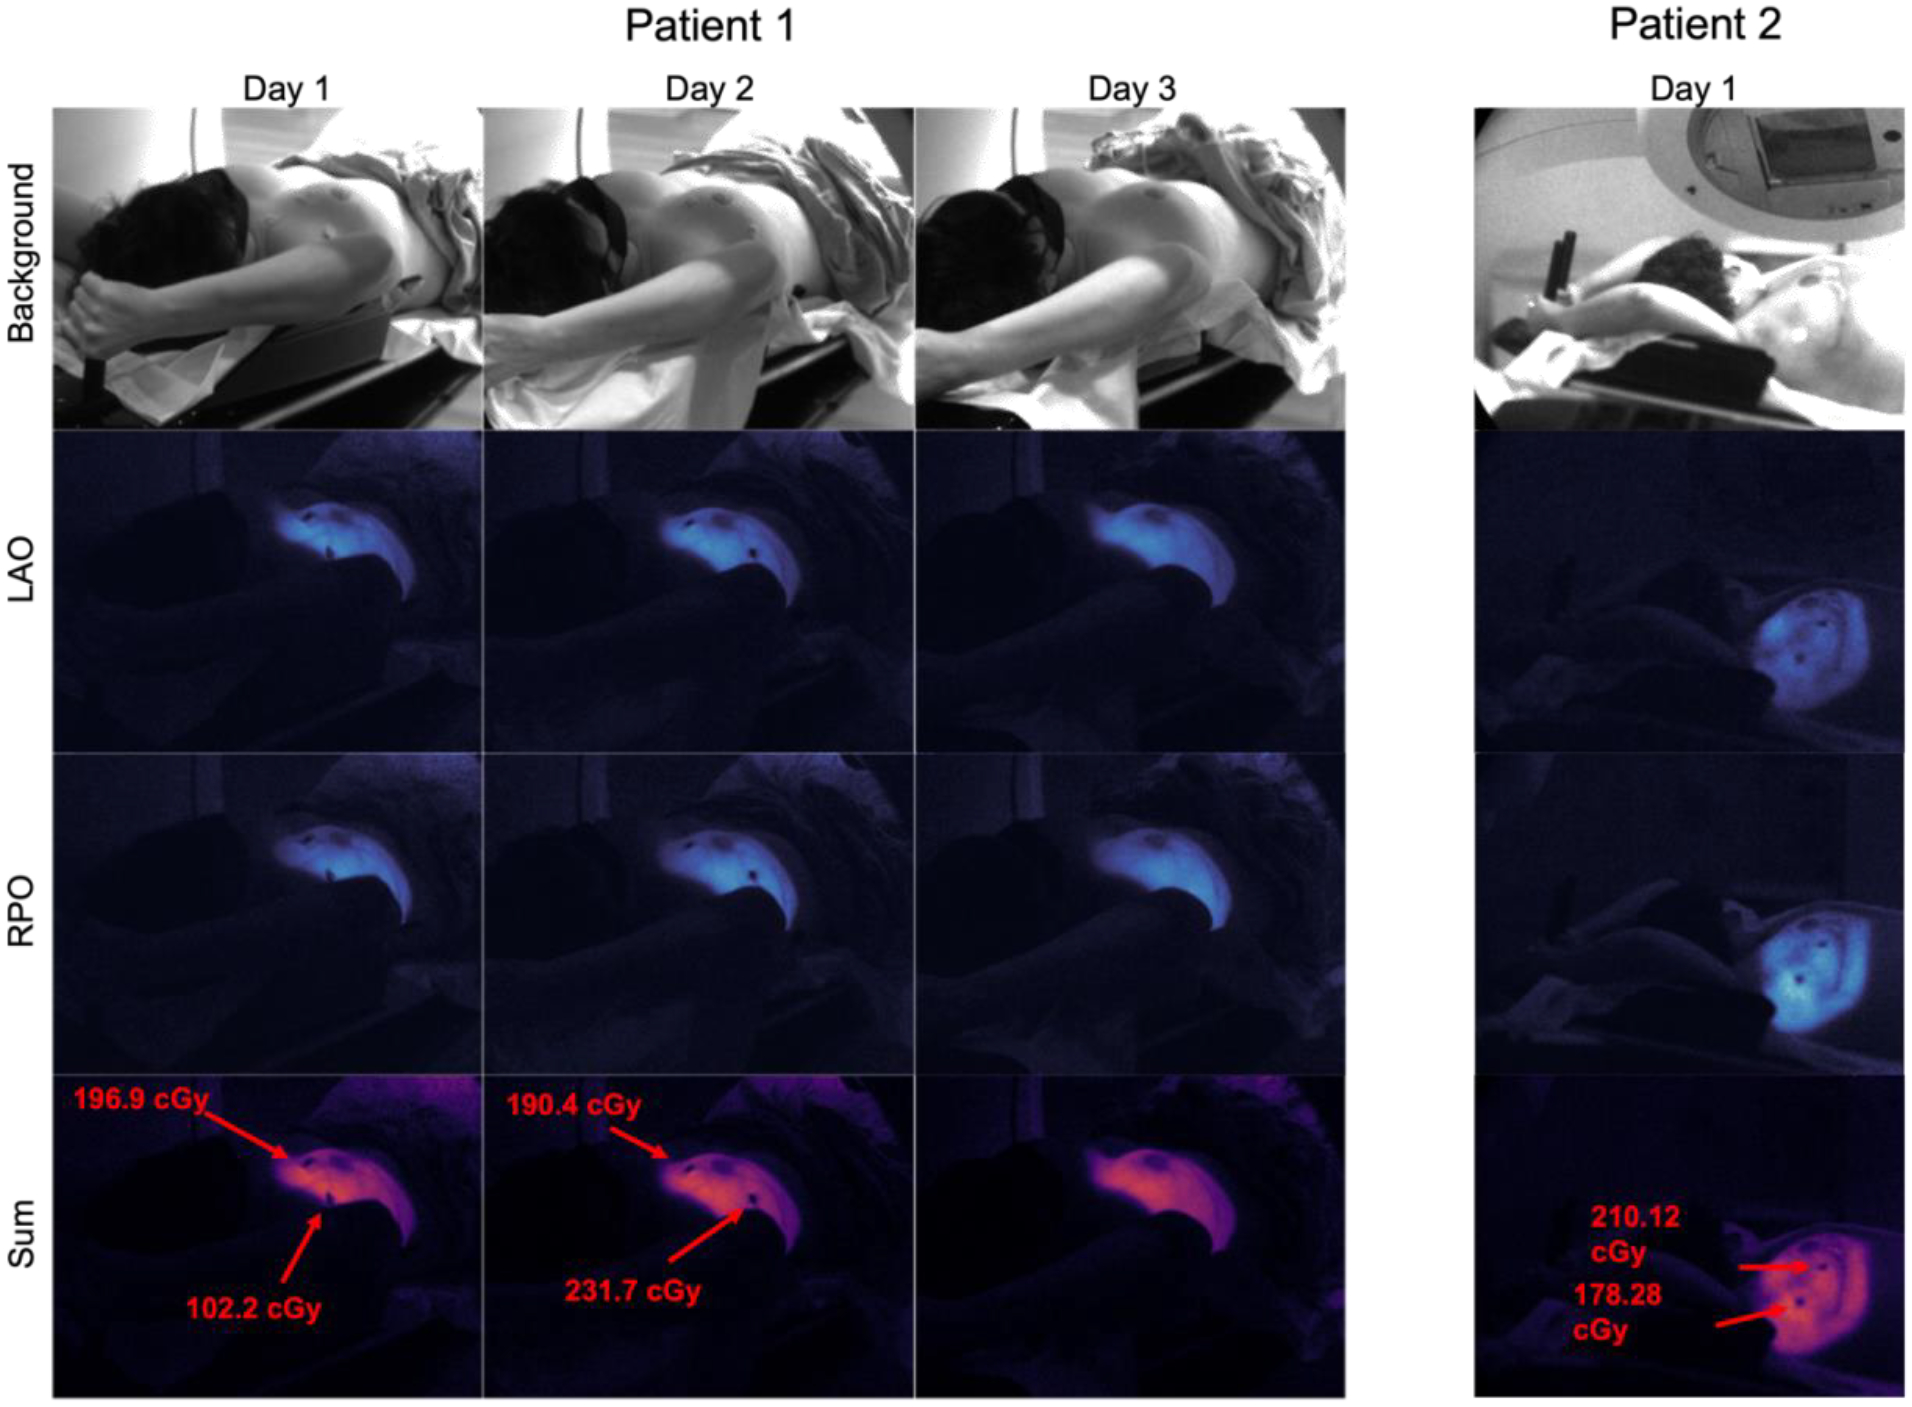
Array of Cherenkov images acquired from three fractions of weekly imaging for patient 1 (Halcyon), and one fraction for patient 2 (TrueBeam). OSLD readings are shown in red where applicable.
Figure 10.
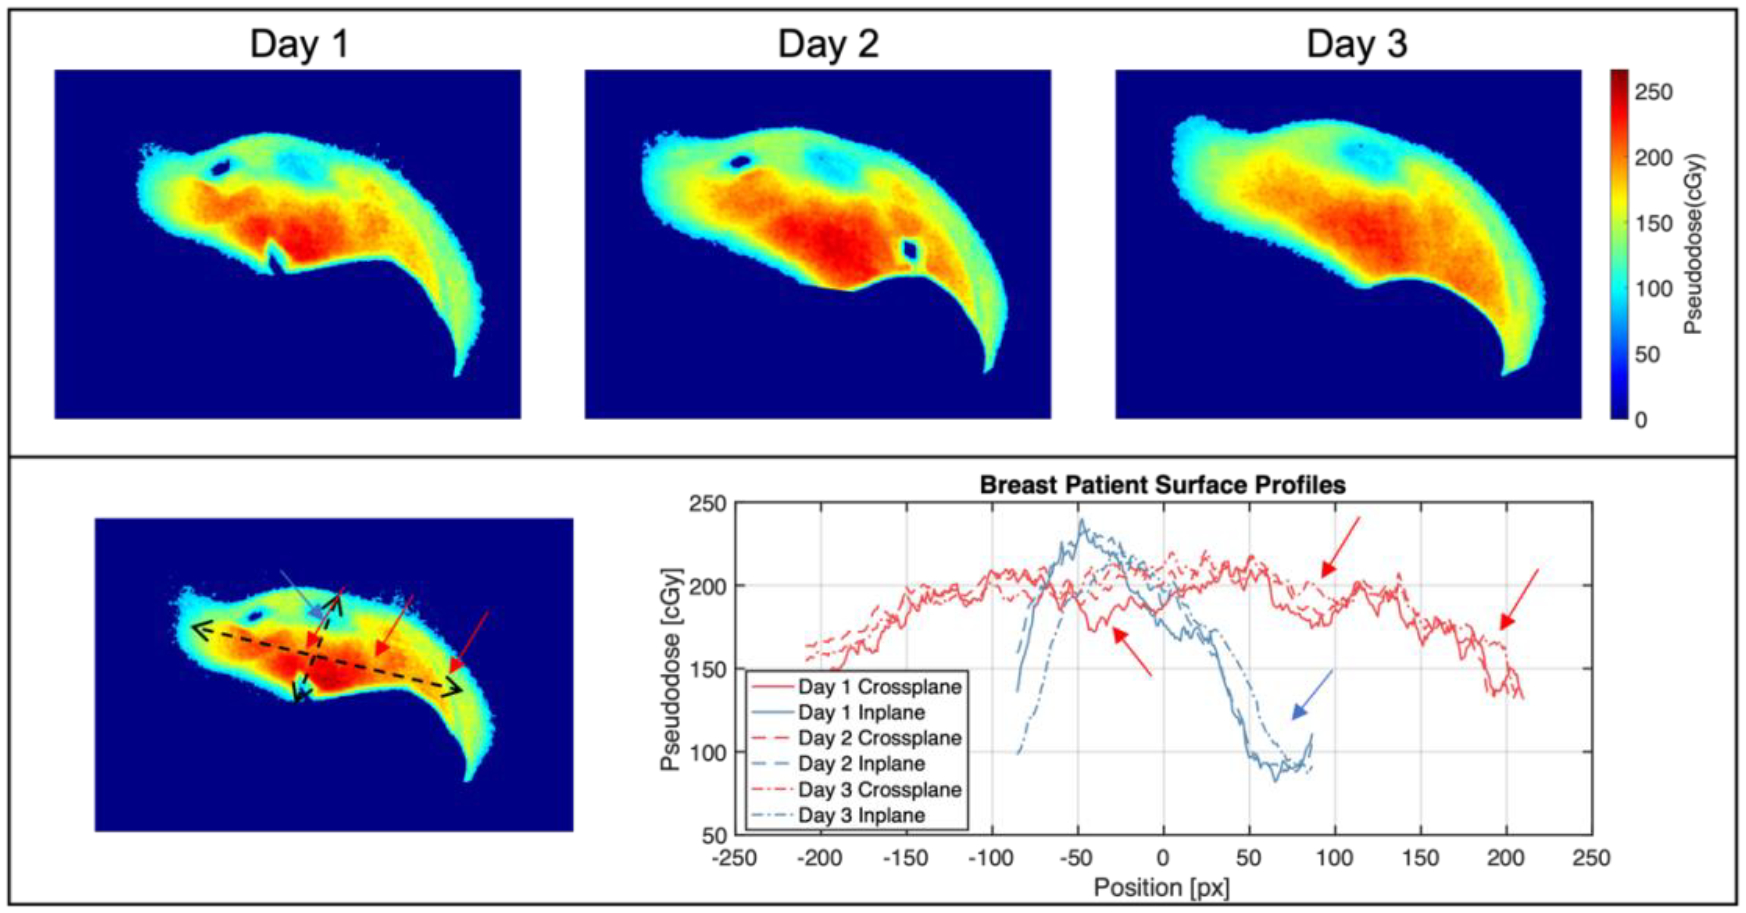
Top: Pseudodose maps from three fractions of patient 1 imaging on Halcyon. Bottom: Surface profiles from all three images, with arrows highlighting intensity dips from heterogeneous tissue attenuation.
Figure 11.

Left: Pseudodose maps from one fraction of patient 2 imaging on TrueBeam. Right: Surface profiles image on the left, with arrows highlighting intensity dips from heterogeneous tissue attenuation.
4. DISCUSSION
4.1. Surface Profiles
Figure 5 shows higher superficial dose at the center of the field for the Halcyon 6 MV FFF beam and the TrueBeam 6 MV beam for the same number of MU, as was expected. Additionally, the Cherenkov distribution shows the rounded nature of the FFF beam at the surface, while horns towards the edge of the 6 MV profiles are observed which are a product of a flattened beam at depth. Absolute Cherenkov intensity is lower for the Halcyon profiles despite the lower surface dose due to a lower mean energy of the FFF beam and the strong dependance of Cherenkov emission on energy in the 1–3 MeV range [8]. However, within each beam energy, surface dose at the field center was highly linearly correlated with Cherenkov intensity for the range of field sizes, for both 6 MV FFF on Halcyon (R2 = 0.987) and 6 MV on TrueBeam (R2 = 0.978).
4.2. Breast Phantom Treatment Comparison
In the breast phantom, as with the flat phantom, OSLD readings indicated a higher surface dose for the Halcyon treatment than for the TrueBeam treatment when the same dose was delivered to the isocenter (matched Rx dose). Once again, lower absolute Cherenkov intensity was observed for the Halcyon treatment delivered with the FFF beam. However, once 2D pseudodose maps were generated based on OSLD readings, higher surface dose was observed throughout most of the observable treatment surface, as indicated in Figure 6. Histogram comparisons show a mean surface pseudodose of 188.4 ± 44.6 cGy for the Halcyon treatment and 177.8 ± 42.1 cGy for the TrueBeam treatment, representing a 5.9% increase for the Halcyon treatment. At the high end of the pseudodose distribution, 95% percentile values for Halcyon and TrueBeam were 243.2 cGy and 228.4 cGy, A 6.5% increase on Halcyon. The difference between the percentage increase on Halcyon for the flat phantom (average 25%, Table 2) compared with the breast phantom is due to the fact that only entrance doses are considered in the flat phantom study. Additionally, the inplane and crossplane profiles in Figure 6 indicate that the surface dose is uniformly higher over the treatment region.
4.3. Monte Carlo Validation and Surface Dose Comparison
Results from the Monte Carlo model validation show strong agreement between the model output and commissioning scan data for both PDD and cross- and inplane profiles for the 10 × 10 cm field size. This suggests that our model approximates the TrueBeam at our institution reasonably well despite the approximations used in collimation geometry within TOPAS compared with the actual TrueBeam collimators.
The surface dose rendering from the simulation shown in Figure 8 displays visible artifacts from the voxelized volume, which are most readily seen at convexities in the mesh. However, the scale of the surface dose from the simulation and the Cherenkov based pseudodose match fairly well with a 15% mean increase in surface dose and broader distribution. More work needs to be done to determine the appropriate sampling of the simulated dose distribution to reflect the physical nature of Cherenkov emission, which travels through the first centimeter of tissue or so with varying degrees of attenuation per wavelength [9], [22]. As of now, the source of discrepancies in the heterogeneities of the simulated dose and pseudodose, such as the cold spot on the inferior side of the breast in the simulation vs the hot spot in the pseudodose at the same location, are still under investigation; one plausible explanation for the hot spot in the Cherenkov data is increased reflected light signal off of the inferior breast wall from the chest wall below it, with is more pronounced at the concavity. This effect will be investigated further in future work.
4.4. Patient Imaging Results
The image in Figure 10 represents the first Cherenkov images of a Halcyon patient treatment to date. Across three days of patient imaging, Cherenkov-based superficial pseudodose was shown to be mostly unchanged, with some decreases in the superior part of the breast on the third day. Since OSLDs were not placed in the same spot from days 1 to 2, readings varied from 100 – 200 cGy, with the former measured near the field edge. The pseudodose map in Figure 11 shows more heterogenous attenuation of the Cherenkov signal, along with a lower surface pseudodose distribution when compared with the three fractions shown in Figure 10; this is consistent with the breast phantom studies, given that the two patient plans were fairly similar. In the profiles shown in Figure 10 and 11, dips in intensity can be seen corresponding to subsurface vasculature and the areola, both of which increase scattering and absorption of optical light thereby decreasing the emitted Cherenkov signal in those areas, which is not reflective of a change in surface dose. Future work must involve incorporating tissue optical property measurements to account for these surface and subsurface features in order to accurately measure surface dose, as has been achieved in published work [12], [21]. Additionally, our clinical study is ongoing, allowing for in vivo superficial dose comparisons across a wider patient cohort between these two machines.
5. CONCLUSIONS
In this study, we have demonstrated the feasibility of using relative Cherenkov intensity as an estimate for high-resolution 2D surface dose in the context of breast radiation therapy. On a flat phantom, Cherenkov imaging reported on differences in superficial dose with field size with high linearity and indicated differences in the spatial features of surface profiles between 6 MV FFF and flattened beams and was normalized to independent dose readings from OSLDs to account for changes in Cherenkov emission yield with beam energy. With a breast phantom, Cherenkov images provided a 2D superficial pseudodose map which when calibrated to OSLD readings was used to compare the surface dose distribution from Halcyon and TrueBeam based treatments, showing 5.6% increased mean surface dose from the Halcyon. An independent Monte Carlo simulation of superficial dose from a modified TrueBeam plan reported surface dose within 16% of that estimated with Cherenkov-based pseudodose, and future work will determine the proper sampling of calculated dose volumes for accurate comparison with Cherenkov emission considering the physics of optical transport and detection. Lastly, the first patient Cherenkov images from a Halcyon treatment were acquired along with a comparable image of a TrueBeam treatment, with little change in estimated surface dose from Cherenkov intensity across three fractions of weekly imaging and higher estimated dose for the patient treatment on Halcyon. In the future, additional patient data acquired from both Halcyon and TrueBeam treatments will allow for an in vivo high resolution superficial dose distribution comparison.
ACKNOWLEDGEMENTS
We would like to thank Vivin Matthew for assistance with patient consent. Additionally, we would like to thank the Radiation Therapy Linac 4 team at the Perelman Center for Advanced Medicine for coordination between research and patient care. This research was funded by NIH R01 CA274411-01 and NIH R21CA239127-01A1.
REFERENCES
- [1].Michiels S et al. , “Volumetric modulated arc therapy of head-and-neck cancer on a fast-rotating O-ring linac: Plan quality and delivery time comparison with a C-arm linac,” Radiother. Oncol, vol. 128, no. 3, pp. 479–484, Sep. 2018, doi: 10.1016/j.radonc.2018.04.021. [DOI] [PubMed] [Google Scholar]
- [2].Barsky AR et al. , “Initial Clinical Experience Treating Patients with Breast Cancer on a 6-MV Flattening-Filter-Free O-Ring Linear Accelerator,” Adv. Radiat. Oncol, vol. 4, no. 4, pp. 571–578, Oct. 2019, doi: 10.1016/j.adro.2019.05.006. [DOI] [PMC free article] [PubMed] [Google Scholar]
- [3].Mohammed M, Chakir E, Boukhal H, Mroan S, and El Bardouni T, “Evaluation of the dosimetric characteristics of 6MV flattened and unflattened photon beam,” J. King Saud Univ. - Sci, vol. 29, no. 3, pp. 371–379, Jul. 2017, doi: 10.1016/j.jksus.2016.09.008. [DOI] [Google Scholar]
- [4].Mesbahi A, “Dosimetric characteristics of unflattened 6MV photon beams of a clinical linear accelerator: A Monte Carlo study,” Appl. Radiat. Isot, vol. 65, no. 9, pp. 1029–1036, Sep. 2007, doi: 10.1016/j.apradiso.2007.04.023. [DOI] [PubMed] [Google Scholar]
- [5].Xiao Y et al. , “Flattening filter-free accelerators: a report from the AAPM Therapy Emerging Technology Assessment Work Group,” J. Appl. Clin. Med. Phys, vol. 16, no. 3, pp. 12–29, 2015, doi: 10.1120/jacmp.v16i3.5219. [DOI] [PMC free article] [PubMed] [Google Scholar]
- [6].Cerenkov PA, “Visible light from pure liquids under the impact of γ-rays,” Cr Acad Sci URSS, vol. 2, pp. 451–457, 1934. [Google Scholar]
- [7].Jarvis LA et al. , “Cherenkov video imaging allows for the first visualization of radiation therapy in real time,” Int. J. Radiat. Oncol. Biol. Phys, vol. 89, no. 3, pp. 615–622, Jul. 2014, doi: 10.1016/j.ijrobp.2014.01.046. [DOI] [PubMed] [Google Scholar]
- [8].Glaser AK, Zhang R, Gladstone DJ, and Pogue BW, “Optical dosimetry of radiotherapy beams using Cherenkov radiation: the relationship between light emission and dose,” Phys. Med. Biol, vol. 59, no. 14, p. 3789, 2014, doi: 10.1088/0031-9155/59/14/3789. [DOI] [PubMed] [Google Scholar]
- [9].Zhang R et al. , “Beam and tissue factors affecting Cherenkov image intensity for quantitative entrance and exit dosimetry on human tissue,” J. Biophotonics, vol. 10, no. 5, pp. 645–656, May 2017, doi: 10.1002/jbio.201500344. [DOI] [PMC free article] [PubMed] [Google Scholar]
- [10].Zhang R, Glaser AK, Gladstone DJ, Fox CJ, and Pogue BW, “Superficial dosimetry imaging based on Čerenkov emission for external beam radiotherapy with megavoltage x-ray beam,” Med. Phys, vol. 40, no. 10, p. 101914, Oct. 2013, doi: 10.1118/1.4821543. [DOI] [PMC free article] [PubMed] [Google Scholar]
- [11].Xie Y et al. , “Cherenkov imaging for total skin electron therapy (TSET),” Med. Phys, vol. 47, no. 1, pp. 201–212, 2020, doi: 10.1002/mp.13881. [DOI] [PMC free article] [PubMed] [Google Scholar]
- [12].Hachadorian R et al. , “Correcting Cherenkov light attenuation in tissue using spatial frequency domain imaging for quantitative surface dosimetry during whole breast radiation therapy,” J. Biomed. Opt, vol. 24, no. 07, p. 1, Nov. 2018, doi: 10.1117/1.jbo.24.7.071609. [DOI] [PMC free article] [PubMed] [Google Scholar]
- [13].Hachadorian RL, Bruza P, Jermyn M, Gladstone DJ, Pogue BW, and Jarvis LA, “Imaging radiation dose in breast radiotherapy by X-ray CT calibration of Cherenkov light,” Nat. Commun, vol. 11, no. 1, Art. no. 1, May 2020, doi: 10.1038/s41467-020-16031-z. [DOI] [PMC free article] [PubMed] [Google Scholar]
- [14].Decker SM et al. , “Estimation of diffuse Cherenkov optical emission from external beam radiation build-up in tissue,” J. Biomed. Opt, vol. 26, no. 9, p. 098003, Sep. 2021, doi: 10.1117/1.JBO.26.9.098003. [DOI] [PMC free article] [PubMed] [Google Scholar]
- [15].Alexander DA et al. , “Detective quantum efficiency of intensified CMOS cameras for Cherenkov imaging in radiotherapy,” Phys. Med. Biol, vol. 65, no. 22, p. 225013, Nov. 2020, doi: 10.1088/1361-6560/abb0c5. [DOI] [PMC free article] [PubMed] [Google Scholar]
- [16].Zhuang AH and Olch AJ, “Validation of OSLD and a treatment planning system for surface dose determination in IMRT treatments,” Med. Phys, vol. 41, no. 8Part1, p. 081720, 2014, doi: 10.1118/1.4890795. [DOI] [PubMed] [Google Scholar]
- [17].Zhuang AH and Olch AJ, “A practical method for the reuse of nanoDot OSLDs and predicting sensitivities up to at least 7000 cGy,” Med. Phys, vol. 47, no. 4, pp. 1481–1488, 2020, doi: 10.1002/mp.14059. [DOI] [PubMed] [Google Scholar]
- [18].“Monte Carlo,” Varian. https://www.myvarian.com/s/montecarlo (accessed Jan. 31, 2023). [Google Scholar]
- [19].Constantin M et al. , “Modeling the TrueBeam linac using a CAD to Geant4 geometry implementation: Dose and IAEA-compliant phase space calculations,” Med. Phys, vol. 38, no. 7, pp. 4018–4024, 2011, doi: 10.1118/1.3598439. [DOI] [PubMed] [Google Scholar]
- [20].Constantin M, “Varian’s Monte Carlo Community Newsletter: Phase Space Update,” Feb. 2013. [Online]. Available: https://www.myvarian.com/s/montecarlo [Google Scholar]
- [21].Hachadorian RL et al. , “Remote dose imaging from Cherenkov light using spatially resolved CT calibration in breast radiotherapy,” Med. Phys, vol. 49, no. 6, pp. 4018–4025, 2022, doi: 10.1002/mp.15614. [DOI] [PMC free article] [PubMed] [Google Scholar]
- [22].LaRochelle EPM, Shell JR, Gunn JR, Davis SC, and Pogue BW, “Signal intensity analysis and optimization for in vivo imaging of Cherenkov and excited luminescence,” Phys. Med. Biol, vol. 63, no. 8, p. 085019, Apr. 2018, doi: 10.1088/1361-6560/aab83b. [DOI] [PMC free article] [PubMed] [Google Scholar]


