. 2023 Apr 21;12:e81511. doi: 10.7554/eLife.81511

Figure 4. Cortico-cerebellar convergence measures using the Lasso model.

(A) Map of the cerebellum showing percentage of cortical parcels with non-zero weights for the Lasso model (n=80 parcels). (B) Percentage of parcels with non-zero weights for functional subregions of the cerebellum. (C) Spherical dispersion of the connectivity weights on the cortical surface for each cerebellar voxel. (D) Average cortical dispersion for each functional subregion of the cerebellum. Error bars indicate standard error of the mean across participants. See Figure 4—figure supplement 1 for the same results using Ridge regression. Error bars indicate 95% confidence intervals across participants (n=24).
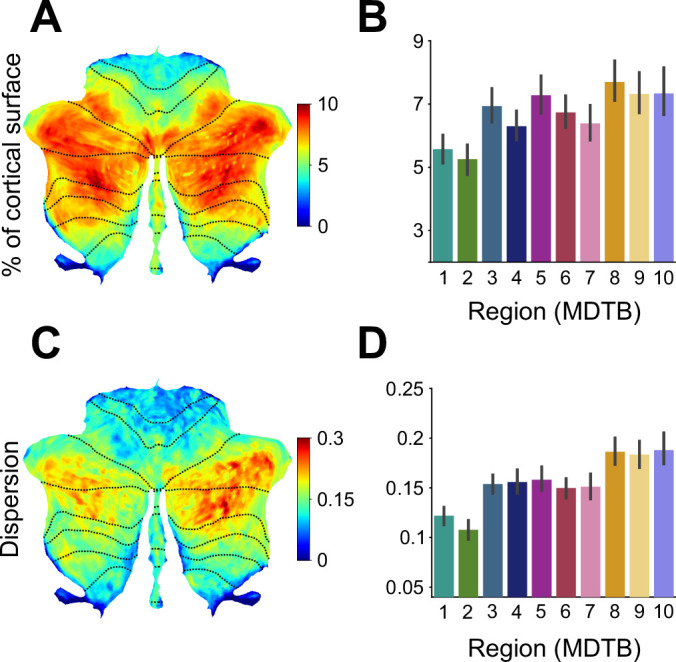
Figure 4.

Figure 4—figure supplement 1. Cortico-cerebellar convergence measures using the Ridge model.
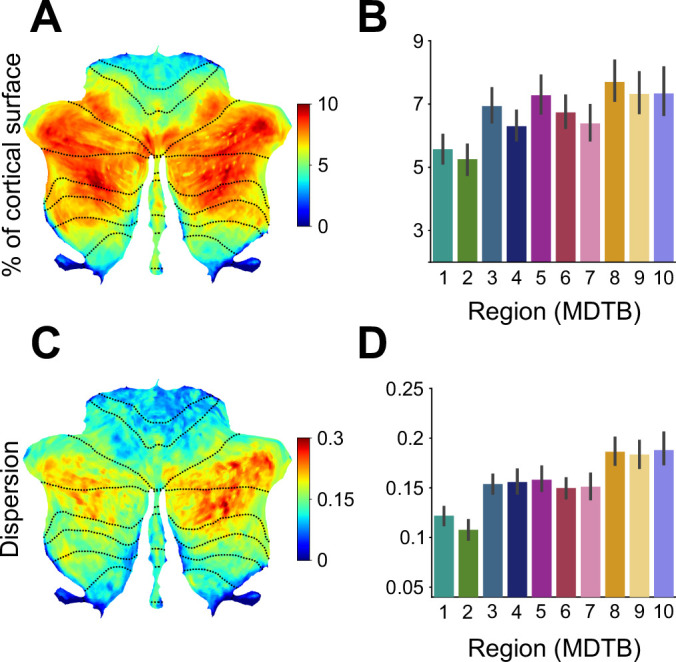
Figure 4—figure supplement 1.

(A) Map of the cerebellum showing percentage of cortical parcels with coefficients for the Ridge model (n=80 parcels) above threshold (see Methods). (B) Percentage of parcels with weights above threshold for functional subregions of the cerebellum. (C) Spherical dispersion of the connectivity weights on the cortical surface for each cerebellar voxel. (D) Average cortical dispersion for each functional subregion of the cerebellum. Error bars indicate standard error of the mean across participants. Error bars indicate 95% confidence intervals across participants (n=24).
Figure 4—figure supplement 2. Percentage of cortical surface across levels of granularity for Lasso regression model.
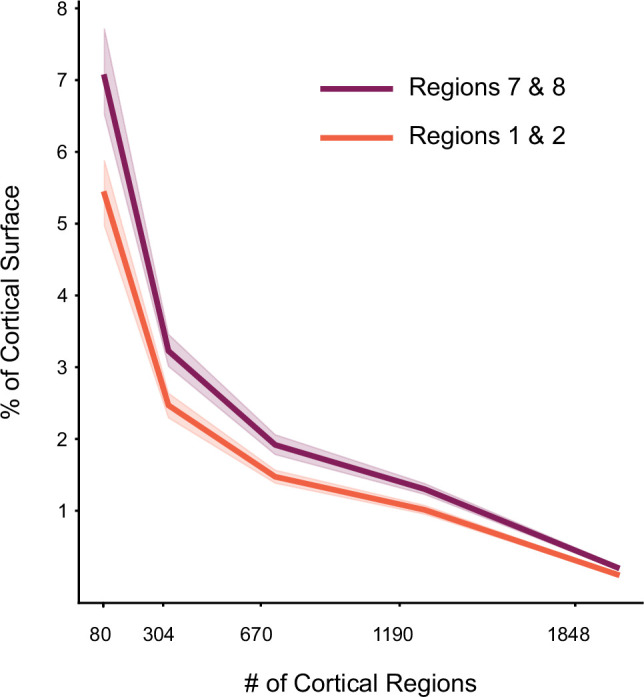
Figure 4—figure supplement 2.

Calculation is performed as in Figure 3B. The results are averaged across the two hand regions of the cerebellum (MDTB functional parcellation, regions 1 and 2), and regions related to narrative and word comprehension (regions 7 and 8). Error bars indicate 95% confidence intervals across participants (n=24).