

Abstract
Aim and Objectives
The aims of this study were to compare the changes in occlusal parameters, TMJ status clinically in patients after the completion of orthognathic surgery, and patients undergoing only orthodontic treatment and with patients having normal occlusion, using T-Scan.
Methodology
This prospective controlled clinical trial, consisting of three groups with a sample size of twelve. Group 1 consisted of patients who underwent orthognathic surgery and orthodontic treatment. Group 2 consists of patients who underwent only orthodontic treatment (camouflage). Clinical examination of the patient (TMJ and Occlusal status) and T-Scan was performed at the time of debonding of the orthodontic brackets, 6 months and 1-year after first evaluation for group 1 and 2 patients.
Results
The collected data between groups are compared and interpreted. The statistical analysis was performed using STATA/IC version 16.1 statistical software. Intragroup comparison for the study variables occlusion time, disocclusion time and maximum bite force between different time periods (T1, T2, T3) for all the three intervention groups using repeated measures. Hypothesis testing for maximum bite force, occlusion time and disocclusion time in orthognathic group (Group 1) as compared to orthodontic group (Group 2) for three different time periods using repeated measures ANOVA and Bonferroni test showed P value < 0.05 which is statistically significant.
Conclusion
In conclusion, evaluation of occlusion using T-Scan give us an insight of the discrepancies in occlusion which is useful during pre-operative planning and especially in the post-operative follow-up period during the retention phase. Examination of TMJ in these patients at various intervals is necessary as any minor occlusal disturbances may lead to TMJ disorders.
Keywords: T scan, Occlusion, TMJ, Bite force, Temporomandibular joint disorder
Introduction
The establishment of an ideal physiologic occlusion is the most desirable outcome following the treatment of simple or complex cases of malocclusion with or without skeletal discrepancies, respectively. The goal to attaining such a balanced occlusion is to facilitate a harmonious interplay of the masticatory system which comprises of the dental components, masticatory muscles, and the temporomandibular joint [1]. The pattern of dental occlusion varies from person to person depending on the eruption sequence of teeth, maxillary and mandibular arch size and shape of craniofacial growth, which is determined by the developmental process. It is seen that, disturbances during the phases of craniofacial growth and development of an individual can potentially lead to a variety of anomalies resulting in maxillo-mandibular deformities [2, 3].
Achieving an ideal occlusal status in such patients is of utmost importance that are routinely managed by therapeutic modifications of the skeletal components and/or the dental contacts by the Maxillofacial Surgeons and Orthodontists. Following the surgical intervention i.e. orthognathic surgery and post-surgical orthodontics (in cases of skeletal discrepancy), or following an orthodontic treatment only (in case of dental discrepancy), it is crucial to accomplish stable occlusal contacts that potentiate symmetrical distribution of the masticatory forces on either sides of the mandible, as a failure to achieve this results in Temporomandibular Disorders (TMD). The etiology of TMD is multifactorial, that makes it quite challenging for the clinicians to isolate a primary cause that predisposes to variety of symptoms [4, 5].
During pre-surgical orthodontics phase, some changes in the occlusion are made to facilitate the surgeon to bring about the segments in a harmonious position. Post-surgical occlusal relationship will be optimized at the end of orthodontic treatment prior to delivery of removable appliances [6, 7]. Such appliances are given for the purpose of retention of newly positioned teeth as post-surgical relapse is another major concern which may alter occlusion and bite forces up to 2 years after debonding, due to skeletal and muscular adaptation in the cranio-maxillofacial area. Similarly, when a patient undergoes dental correction by orthodontic treatment, upon completion of the treatment, the occlusal status is stabilized by means of removable appliances. Eventually, in the next 1–2 years, it is possible for the micro changes to happen in the occlusal table, either per se or due to skeletal relapse which is a known post-operative sequalae of orthognathic surgery. Thus, monitoring of the occlusal status and the influencing bite forces during this retention phase is highly significant [8, 9].
The most commonly used occlusal analysis indicators are articulating papers, impression waxes, etc. But none of these exactly measure the amount of occlusal force, the sequalae of occlusal contacts nor have significantly good precision to detect the areas of premature contacts. To overcome these known limitations of articulating paper, a Digital Occlusal Analysis System (T-Scan) could serve as a better option to evaluate the occlusal status. T-Scan records and displays the real time recording of a patient’s occlusion from the initial point of contact to the maximum intercuspation, while the patient occludes upon a 100 micron thick highly defined sensor. This provides quantifiable information about the magnitude of the bite forces, distribution pattern of the occlusal contacts and the timing discrepancies [10–14].
Aim and Objective
The aims of this study were to evaluate the changes in occlusal discrepancy and the Temporo-mandibular joint status for three groups of patients.
The Objectives were,
To assess the changes in occlusal parameters, in patients after the completion of orthognathic surgery (at the time of debonding of orthodontic brackets, 6 months and 1-year post operatively), and patients undergoing only orthodontic treatment (at the time of debonding of orthodontic brackets, 6 months and 1-year post operatively) with patients having normal occlusion, using T-Scan
To evaluate the status of Temporo-Mandibular Joint (TMJ), clinically.
To compare the above parameters between the 2 groups.
Rationale of the Study
During the pre-surgical orthodontic phase, minor changes to the occlusion are made to facilitate the surgeon to position the segments in a harmonious position. However, post-surgical occlusal relationship will be optimized at the end of orthodontic treatment prior to delivery of removable appliances, which is given for the purpose of retention of newly positioned teeth in that position. Similarly, when a patient undergoes dental correction by orthodontic treatment, upon completion of the treatment, the occlusal status is stabilized by means of removable appliances.
Eventually, in the next 1 to 2 years, it is possible for the micro changes to happen in the occlusal table either per se or due to skeletal relapse which is a known post-operative sequalae of orthognathic surgery. Hence, an occlusal table analysis and TMJ status interpretation clinically is established immediately after debonding and comparing the same at a time points namely 6 months and 1-year post-operatively. On review, these patients will give us an insight in to any minor occlusal disturbances that may lead to TMJ disorders in such patients.
Materials and Methodology
The approval for the study was obtained from the Institutional Review Board-MADC/IRB- XXVIII/2019/431. The study was conducted in the OPD of Department of Oral and Maxillofacial Surgery and Orthodontics, on a consecutive basis, ensuring that they satisfied the study’s inclusion and exclusion criteria.
Group 1 consisted of patients who underwent orthognathic surgery and orthodontic treatment. Group 2 consisted of patients who underwent only orthodontic treatment (camouflage).
Inclusions and Exclusion Criteria
Inclusion criteria: post-orthognathic surgery patients with completed orthodontic correction (at the time of debonding) as Group I, Post-orthodontic treatment patients (at the time of debonding) as Group II were included in our study.
Exclusion Criteria
Group 1: Patients with any history of previous orthognathic surgery and previous orthodontic treatment. Patients with pre-existing history of temporomandibular disorders. Patients undergoing any occlusal changes during the course of a one-year follow up (conservative restorations, root canal treatments, occlusal splints, etc.). Patients who were lost in the follow up period and did not report. Syndromic patients. Patients with parafunctional habits, MPDS are excluded from Group 1.
Group 2: Patients still undergoing orthodontic treatment. Patients with any history of previous orthognathic surgery. Patients with any history of previous orthodontic treatment. Patients with pre-existing history of temporomandibular disorders. Patients undergoing any occlusal changes during the course of 1-year follow up (conservative restorations, root canal treatments, occlusal splints, etc.). Patients who were lost in the follow up period and did not report. Syndromic patients. Patients with parafunctional habits, MPDS are excluded from Group 2.
Materials
Occlusal Analysis Indicators
Digital Occlusal Analysis System—T-Scan (Fig. 1) records and displays the real time recording of a patient’s occlusion from the initial point of contact to the maximum intercuspation, thereby providing quantifiable information about the occlusal forces and timing discrepancies, thus minimizing the probability of developing temporomandibular disorders [15].
Fig. 1.
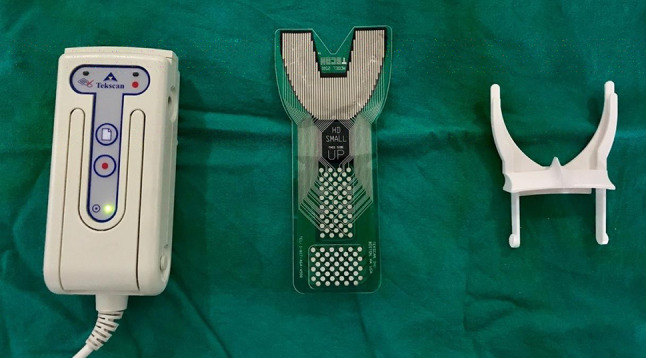
T-Scan Equipment
TMJ Examination Questionnaire (Fig. 2): TMJ Status of all patients were evaluated during each appointment using the RDC-TMD criteria questionnaire [16, 17].
Fig. 2.

RDC TMD Questionnaire
Methods
Clinical examination of the patient (TMJ and Occlusal status) and performing T- Scan (digital occlusal analysis) (Fig. 3) at the time of debonding of the orthodontic brackets, 6 months and 1-year after first evaluation for Group 1 and 2 patients. Comparison of the T-Scan data done at the end of 1-year follow up period and interpreting the changes in the occlusal parameters and also the TMJ status, thereby assessing the probability to develop TMD.
Fig. 3.

T-Scan positioned for recording
Results
The statistical analysis was performed using STATA/IC version 16.1 statistical software (STATA corp., College station, Texas, USA). Intragroup comparison for the study variables occlusion time, disocclusion time and maximum bite force (Right and left) between different time periods (T1, T2, T3) for all the three intervention groups (orthognathic surgery group, orthodontic group, control group) using repeated measures ANOVA test (with Box conservative epsilon correction) followed by post hoc Bonferroni test. Intergroup comparison was performed for the study variables occlusion time, disocclusion time and maximum bite force (Right and left) between the intervention groups (orthognathic surgery group, orthodontic group, control group) using ANOVA test followed by post hoc Bonferroni test.
The descriptive statistics for study variables (Occlusion time, disocclusion time and Maximum bite force [both right and left]) for the two groups Group 1: Orthognathic Surgery group, Group 2: Orthodontic group in three different time periods are displayed in Tables 1, 2, 3, 4 and 5.
Table 1.
Hypothesis testing for maximum bite force in orthognathic group (Group 1) for three different time periods using repeated measures ANOVA (after box conservative epsilon correction) followed by post-hoc Bonferroni test
| Group | Side | Comparison of different time periods | Difference of means | P value (Repeated measures ANOVA) | P value (post-hoc Bonferroni test) |
|---|---|---|---|---|---|
| Centric movements (orthognathic group) | Right side | T2 vs T1 | -.800001 | 0.9933 | 1.000 |
| T3 vs T1 | .05 | 1.000 | |||
| T3 vs T2 | .850001 | 1.000 | |||
| Left lateral movements (orthognathic group) | T2 vs T1 | 0 | – | – | |
| T3 vs T1 | 0 | – | |||
| T3 vs T2 | 0 | – | |||
|
Right lateral movements (orthognathic group) |
T2 vs T1 | 0 | – | – | |
| T3 vs T1 | 0 | – | |||
| T3 vs T2 | 0 | – | |||
| Protrusive movements (orthognathic group) | T2 vs T1 | 1.175 | 0.9120 | 1.000 | |
| T3 vs T1 | 11.325 | 1.000 | |||
| T3 vs T2 | 10.15 | 1.000 | |||
| Centric movements (orthognathic group) | Left side | T2 vs T1 | .35 | 0.9986 | 1.000 |
| T3 vs T1 | −.05 | 1.000 | |||
| T3 vs T2 | −.400001 | 1.000 | |||
| Left lateral movements (orthognathic group) | T2 vs T1 | 0 | – | – | |
| T3 vs T1 | 0 | – | |||
| T3 vs T2 | 0 | – | |||
| Right lateral movements (orthognathic group) | T2 vs T1 | 0 | – | – | |
| T3 vs T1 | 0 | – | |||
| T3 vs T2 | 0 | – | |||
| Protrusive movements (orthognathic group) | T2 vs T1 | −1.175 | 0.9120 | 1.000 | |
| T3 vs T1 | −11.325 | 1.000 | |||
| T3 vs T2 | −10.15 | 1.000 |
*p < 0.05 (statistically significant)
Table 2.
Hypothesis testing for maximum bite force in orthodontic group (group 2) for three different time periods using repeated measures ANOVA (after box conservative epsilon correction) followed by post-hoc Bonferroni test
| Group | Side | Comparison of different time periods | Difference of means | P value (Repeated measures ANOVA) | P value (post-hoc Bonferroni test) |
|---|---|---|---|---|---|
| Centric movements (orthodontic group) | Right | T2 vs T1 | .950001 | 0.9968 | 1.000 |
| T3 vs T1 | .075001 | 1.000 | |||
| T3 vs T2 | −.875 | 1.000 | |||
| Left lateral movements (orthodontic group) | T2 vs T1 | 0 | – | – | |
| T3 vs T1 | 0 | – | |||
| T3 vs T2 | 0 | – | |||
| Right lateral movements (orthodontic group) | T2 vs T1 | 0 | – | – | |
| T3 vs T1 | 0 | – | |||
| T3 vs T2 | 0 | – | |||
| Protrusive movements (orthodontic group) | T2 vs T1 | 3.75 | 0.9481 | 1.000 | |
| T3 vs T1 | 4.45 | 1.000 | |||
| T3 vs T2 | 0.7 | 1.000 | |||
| Centric movements (orthodontic group) | Left | T2 vs T1 | −1.2 | 0.5487 | 1.000 |
| T3 vs T1 | 13.925 | 1.000 | |||
| T3 vs T2 | 15.125 | 1.000 | |||
| Left lateral movements (orthodontic group) | T2 vs T1 | 0 | – | – | |
| T3 vs T1 | 0 | – | |||
| T3 vs T2 | 0 | – | |||
| Right lateral movements (orthodontic group) | T2 vs T1 | 0 | – | – | |
| T3 vs T1 | 0 | – | |||
| T3 vs T2 | 0 | – | |||
| Protrusive movements (orthodontic group) | T2 vs T1 | −3.75 | 0.9509 | 1.000 | |
| T3 vs T1 | −4.2 | 1.000 | |||
| T3 vs T2 | −.450003 | 1.000 |
*p < 0.05 (statistically significant)
Table 3.
Descriptive statistics (Centric movements)
| Variables | Side | Time period | Orthognathic group (Group 1) | Orthodontic group (Group 2) |
|---|---|---|---|---|
| Occlusion time | Right | T1 |
0.21 ± 0.06 Median: 0.2 IQR: 0.17–0.26 |
0.21 ± 0.09 Median: 0.2 IQR: 0.14–0.28 |
| T2 |
0.23 ± 0.12 Median: 0.2 IQR: 0.16–0.3 |
0.21 ± 0.06 Median: 0.2 IQR: 0.18–0.25 |
||
| T3 |
0.36 ± 0.18 Median: 0.36 IQR: 0.21–0.52 |
0.22 ± 0.06 Median: 0.22 IQR: 0.19–0.27 |
||
| Disocclusion time | T1 |
0.13 ± 0.06 Median: 0.13 IQR: 0.08–0.18 |
0.23 ± 0.06 Median: 0.26 IQR: 0.2–0.27 |
|
| T2 |
0.12 ± 0.05 Median: 0.12 IQR: 0.08–0.16 |
0.31 ± 0.18 Median: 0.26 IQR: 0.21–0.42 |
||
| T3 |
0.21 ± 0.28 Median: 0.075 IQR: 0.07–0.36 |
0.32 ± 0.18 Median: 0.27 IQR: 0.21–0.42 |
||
| Maximum bite force | T1 | 52.25 ± 10.42 |
0.63 ± 0.19 Median: 0.64 IQR: 0.47–0.79 |
|
| T2 | 52.60 ± 14.03 |
0.64 ± 0.19 Median: 0.65 IQR: 0.48–0.80 |
||
| T3 | 52.20 ± 9.71 |
0.63 ± 0.18 Median: 0.63 IQR: 0.48–0.79 |
Table 4.
Hypothesis testing for disocclusion time in orthognathic group (group 1) for three different time periods using post-hoc Bonferroni test
| Group | Comparison of different time periods | Difference of means | P value (Repeated measures ANOVA) | P value (post-hoc Bonferroni test) |
|---|---|---|---|---|
| Centric movements (orthognathic group) | T2 vs T1 | −.015 | 0.6836 | 1.000 |
| T3 vs T1 | .0825 | 1.000 | ||
| T3 vs T2 | .0975 | 1.000 | ||
| Left lateral movements (orthognathic group) | T2 vs T1 | −.115 | 0.7544 | 1.000 |
| T3 vs T1 | −.1025 | 1.000 | ||
| T3 vs T2 | .0125 | 1.000 | ||
| Right lateral movements (orthognathic group) | T2 vs T1 | −.0375 | 0.7979 | 1.000 |
| T3 vs T1 | .0175 | 1.000 | ||
| T3 vs T2 | .055 | 1.000 | ||
| Protrusive movements (orthognathicgroup) | T2 vs T1 | .0325 | 0.9651 | 1.000 |
| T3 vs T1 | 0 | 1.000 | ||
| T3 vs T2 | −.0325 | 1.000 |
p < 0.05 (statistically significant)
Table 5.
Hypothesis testing for disocclusion time in orthodontic group (group 2) for three different time periods using post-hoc Bonferroni test
| Group | Comparison of different time periods | Difference of means | P value (Repeated measuresANOVA) | P value (post-hoc Bonferronitest) |
|---|---|---|---|---|
| Centric movements (orthodontic group) | T2 vs T1 | .08 | 0.6774 | 1.000 |
| T3 vs T1 | .085 | 1.000 | ||
| T3 vs T2 | .005 | 1.000 | ||
| Left lateral movements (orthodontic group) | T2 vs T1 | 025 | 0.8337 | 1.000 |
| T3 vs T1 | .0575 | 1.000 | ||
| T3 vs T2 | .0325 | 1.000 | ||
| Right lateral movements (orthodontic group) | T2 vs T1 | −.0575 | 0.8786 | 1.000 |
| T3 vs T1 | −.06 | 1.000 | ||
| T3 vs T2 | −.0025 | 1.000 | ||
| Protrusive movements (orthodontic group) | T2 vs T1 | .015 | 0.9696 | 1.000 |
| T3 vs T1 | .02 | 1.000 | ||
| T3 vs T2 | .005 | 1.000 |
p < 0.05 (statistically significant)
For centric movements (Fig. 4), mean occlusion time was 0.21 ± 0.06 (Median: 2, IQR: 0.17–0.26) for orthognathic surgery group and was 0.21 ± 0.09 (Median: 2, IQR: 0.14–0.28) for orthodontic group at time period (T1). Mean disocclusion time was 0.13 ± 0.06 (Median: 0.13, IQR: 0.08–0.18) for orthognathic surgery group and was 0.23 ± 0.06 (Median: 0.26, IQR: 0.2–0.27) for orthodontic group at time period (T1). Maximum bite force on right side was 0.52 ± 0.10 (Median:0.5, IQR: 0.42–0.55) for orthognathic surgery group and was 0.63 ± 0.19 (Median:0.64, IQR: 0.47–0.79) for orthodontic group at time period (T1). Maximum bite force on left side was 0.52 ± 0.10 (Median:0.5, IQR: 0.46–0.59) for orthognathic surgery group and was 0.36 ± 0.19 (Median:0.36, IQR: 0.21–0.53) for orthodontic group at time period (T1) (Fig. 5).
Fig. 4.

T-Scan showing multi-bite record in centric occlusion
Fig. 7.

Centric Movement - Right and Left
For right lateral movements (Fig. 6), occlusion time was 0.4 ± 0.29 (Median:0.3, IQR: 0.2- 0.61) for orthognathic surgery group and was 0.44 ± 0.31 (Median:0.32, IQR: 0.25- 0.62) for orthodontic group at time period (T1). Disocclusion time was 0.33 ± 0.12 (Median:0.31, IQR: 0.24–0.43) for orthognathic surgery group and was 0.5 ± 0.13 (Median:0.46, IQR: 0.32–0.56) for orthodontic group at time period (T1). Maximum bite force on right side was 100 (Median:100, IQR:0) for orthognathic surgery group and was 100 (Median:100, IQR:0) for orthodontic group at time period (T1). Maximum bite force on left side was 0 (Median:0, IQR:0) for orthognathic surgery group and was 0 (Median:0, IQR:0) for orthodontic group at time period (T1) (Figs. 5 and 7).
Fig. 5.

T-Scan showing bite record in right lateral movement
Fig. 8.

Maximum Bite Force – Protrusive (Right and Left)
For left lateral movements, occlusion time was 0.28 ± 0.16 (Median:0.23, IQR: 0.17- 0.39) for orthognathic surgery group and was 0.28 ± 0.10 (Median:0.32, IQR: 0.21- 0.35) for orthodontic group at time period (T1). Disocclusion time was 0.39 ± 0.3(Median:0.34, IQR:0.15–0.64) for orthognathic surgery group and was 0.31 ± 0.13 (Median:0.29, IQR: 0.21–0.41) for orthodontic group at time period (T1). Maximum bite force on right side was 0 (Median:0, IQR:0) for orthognathic surgery group and was 0 (Median:0, IQR:0) for orthodontic group at time period (T1). Maximum bite force on left side was 100 (Median:100, IQR:0) for orthognathic surgery group and was 100 (Median:100, IQR:0) for orthodontic group at time period (T1). (Figs. 7 and 8).
Fig. 9.

Occlusion time- Centric, Left lateral, Right lateral
For protrusive movements (Fig. 9), occlusion time was 0.45 ± 0.37(Median:0.3, IQR: 0.24- 0.66) for orthognathic surgery group and was 0.28 ± 0.15 (Median:0.29, IQR: 0.16- 0.4) for orthodontic group at time period (T1). Disocclusion time was 0.32 ± 0.18(Median:0.28, IQR: 0.17–0.46) for orthognathic surgery group and was 0.38 ± 0.18 (Median:0.43, IQR: 0.28–0.49) for orthodontic group at time period (T1). Maximum bite force on right side was 0.52 ± 0.33(Median:0.42, IQR:0.31–0.74) for orthognathic surgery group and was 0.27 ± 0.20(Median:0.20, IQR:0.13–0.41) for orthodontic group at time period (T1). Maximum bite force on left side was 0.48 ± 0.33 (Median:0.59, IQR:0.26–0.7) for orthognathic surgery group and was 0.72 ± 0.2 (Median:0.8, IQR:0.59–0.87) for orthodontic group at time period (T1) (Figs. 7 and 8).
Fig. 6.

T-Scan showing bite record in protrusive movement
Intra group comparison for orthognathic group during protrusive movements as evaluated using repeated measures ANOVA (after box conservative epsilon correction) showed that there was no significant difference between three different time periods (T1, T2, T3) for maximum bite force on the right side (p = 0.9120), for maximum bite force on the left side (p = 0.9120), for occlusion time (p = 0.9509) and for disocclusion time (p = 0.9651). Similarly, during left lateral, right lateral and centric movement showed that there was no significant difference between three different time periods (T1, T2, T3). Results are summarized in Table 1.
Intra group comparison for orthodontic group during centric movements as evaluated using repeated measures ANOVA (after box conservative epsilon correction) showed that there was no significant difference between three different time periods (T1, T2, T3) for maximum bite force on the right side (p = 0.9968), for maximum bite force on the left side (p = 0.5487), for occlusion time (p = 0.9613) and for disocclusion time (p = 0.6774). Intra group comparison for orthodontic group during left lateral movements as evaluated using repeated measures ANOVA (after box conservative epsilon correction) showed that there was no significant difference between three different time periods (T1, T2, T3) for occlusion time (p = 0.5150) and for disocclusion time (p = 0.8337). Intra group comparison for orthodontic group during right lateral movements as evaluated using repeated measures ANOVA (after box conservative epsilon correction) showed that there was no significant difference between three different time periods (T1, T2, T3) for occlusion time (p = 0.9614) and for disocclusion time (p = 0.8786). Results are summarized in Table 2.
Intra group comparison for orthodontic group during protrusive movements as evaluated using repeated measures ANOVA (after box conservative epsilon correction) showed that there was no significant difference between three different time periods (T1, T2, T3) for maximum bite force on the right side (p = 0.9481), for maximum bite force on the left side (p = 0.9509), for occlusion time (p = 0.8494) and for disocclusion time (p = 0.9696). For centric movements, mean occlusion time was 0.23 ± 0.12 (Median: 0.2, IQR: 0.16–0.3) for orthognathic surgery group and was 0.21 ± 0.06 (Median: 0.2, IQR: 0.18–0.25) for orthodontic group at time period (T2). Results are summarized in Table 3.
Hypothesis testing for disocclusion time in orthognathic group (Group 1) and orthodontic group (Group 2) for three different time periods using post-hoc Bonferroni test was evaluated and results are compared. P value repeated measures by ANOVA for centric movement in group 1 was noted as 0.6836, 0.7544 for left lateral movement, 0.7979 for right lateral movement and 0.9651 for protrusive movement. For control group centric movement was measured as 0.6774, left lateral movement was 0.8337, right lateral movement was 0.8786 and protrusive movement was noted as 0.9696, respectively. The result showed P < 0.05 which is statistically significant. Results are summarized in Tables 4 and 5.
TMJ evaluation using the RDC-TMD criteria questionnaire revealed that one patient from the Orthognathic Surgery group (Group 1) had clicking on the left side on first appointment which subsided in the next appointments. No other significant changes of the TMJ were observed in other patients. (Fig. 2).
Discussion
The teeth, muscles of mastication, periodontal tissues and temporomandibular joint (TMJ) together it forms masticatory system. Restoration of normal physiological occlusion is essential for a normal functioning masticatory system [18]. Occlusion can be defined as contacts between teeth that are “static” when the mandible is closed and stationary or “dynamic” when the mandible is moving relative to the maxilla [19, 20]. Based on the glossary of Prosthodontics terms (2005), Occlusion is "the static relationship between the incising or occlusal surfaces of the maxillary or mandibular teeth or tooth analogues. The occlusion should be stable and as stress free as possible" [21]. Each individual depending on the shape, size, teeth position, arch size, arch shape, sequence and timing of tooth eruption, craniofacial growth pattern- dental occlusion varies.
Facial deformities occur when there is any disturbance in the developmental processes that directly or indirectly affect the developing tooth buds and associated structures [22, 23]. Any immature occlusal relationship, occlusal-articulating blockages, iatrogenic cause leads to occlusal traumas which stimulate changes in the masticatory muscles, tooth-supporting tissues and the temporomandibular joint (TMJ) [24, 25]. In maxillofacial surgery, orthognathic surgical procedures are widely performed to treat maxillary, mandibular deformities as well as facial asymmetries. The ideal goal of all the procedures performed so far is to correct and achieve the ideal physiological occlusion of the patient which results in good masticatory function, better facial aesthetics, and improved temporomandibular joint (TMJ) function [25, 26].
Occlusal analyzers are the device used to record the occlusal- articulation relations. Traditionally, in dental practice articulating paper has been accepted as the key diagnostic tool to determine occlusal contact points [27]. The articulating paper spotlight the premature occlusal contacts, high points between two arches, but it fails to register the intensity and magnitude of the generated occlusal load which is very essential [28]. Many authors argued and supported the theory that the interpretation marks on the articulating paper is subjective and inaccurate in measuring the intensity and magnitude of occlusal forced generated. There are also variety of analyzers available to register this occlusal—articulation relationship. To overcome the drawbacks of subjective articulating paper technique legends have introduced the T-scan, a computerized occlusal analysis system.
T scans are a windows-compatible, digitized occlusal analysis system used for registering inter-arch occlusal contacts dynamically during various mandibular movements, and for representing these in a graphic form in real time, provide information about their duration and their relational force. The development of T scan technology begins 30 years back, in 1984 first T-Scan® I computerized occlusal analysis system was introduced by Maness et al. Mane’s development yields measurement in real time of occlusal forces recorded using the T-SCAN intraoral sensor. In 1987, Mylar encased sensor technology Tek scan, the prototypical grid-based sensor technology especially organized and planned for occlusal analysis to dynamically measure occlusion more accurately then T scan I. Followed in 1995 T-Scan II for Windows®, then to T-Scan III -software versions 5, 6, and 7 was developed in 2004, Turbo recording in 2008, Till now the advancement has reached up to many versions, the latest one known as T-Scan 8 introduced in 2014 (Tek scan Inc., South Boston, MA, USA) [24, 29, 30].
The T-scan equipment comprises of a flexible sensor which gets inserted into a sensor handle, which is autoclavable, in turn being connected to a computer. The sensors are repetitive for a one patient, which are made up of 1370 active pressure sensing locations (1122 pressure sensing locations for small sensors) [31]. The program records and analyzes the differentials of applied voltage, and gives relative values of the force and duration of occlusal contacts, with a time precision of 10 ms. The results are delivered in the form of graphs describing force variation with time; force histograms are projected on an individualized dental arch (that can be modified according to mesio-distal tooth dimensions or missing teeth) allowing the practitioner to picture the location and duration of inter-arch contacts over time. The T-Scan records the first contact, center of force, maximum bite force and intercuspation [32].
A T-Scan efficiently allows a simultaneous examination of the entire arch of the patient, thereby enabling easy identification and visualization of the problem. This feature attributes to T-Scan being much more informative than the routine examination done employing an articulating paper. Furthermore, data obtained from the T-Scan system helps locate and identify traumatic occlusal contacts and can be used to compare occlusal force symmetry before and after treatment. Besides, the T-Scan system can be used to evaluate changes in the state of a patient’s occlusion after orthognathic surgery, and also serve as a useful tool for patient follow-up and the diagnosis or evaluation of relapse after treatment [32].
Jimoh Olubummo et al. [32] in his study used T-scan system in patients undergoing orthognathic surgery and compared with normal healthy patients. He included 30 healthy adults as a control and 40 patients undergoing orthognathic surgery as study group. Jimoh et al. evaluated force distribution, center of force and assessed number of teeth contributed to occlusion at maximum intercuspation. He concluded as T- scan is considered as a good tool and help clinicians to predict the treatment outcome and detect relapse as earlier as possible. In our study other than analyzing occlusal status we have also studied the temporomandibular status between three groups using RDC-TMD criteria questionnaires, which is clinically significant.
Conclusion
Hereby we conclude that,
Evaluation of occlusion using T-Scan in patients who undergo orthognathic surgery/orthodontic treatment will give us an insight of the discrepancies in occlusion which is useful during pre-operative planning and especially in the post-operative follow-up period during the retention phase.
Detection of such minor discrepancies using T-Scan majorly helps in avoiding clinician-based bias during subjective evaluation of occlusion; and also helps in detection of relapse at an earlier stage.
Examination of TMJ in these patients at various intervals is necessary as any minor occlusal disturbances may lead to TMJ disorders.
In our study, upon interpretation of the statistical data, it revealed that there were no significant changes in occlusion observed between the three groups (orthognathic surgery, orthodontic and control groups), during the one-year follow-up period of the retention phase.
Additionally, TMJ evaluation also reported that there were no significant changes in the joints of these patients during the one-year follow-up period. Beneficial advantages or deleterious changes within TMJ after OGS or with minor occlusal disturbance after orthodontic treatment could not be established from this study. Therefore, the TMJ changes still remains unclear and controversial.
Author Contribution
Dr. MR, Dr. MS, Dr. RP- Collected and analysed the data. Dr. MR, Dr. SSMS- Study design and T scan Analysis. Dr. MR, Dr. MS—Interpretation of Result, Statistical Analysis. Dr. MR, Dr. KP—Manuscript writing. Dr. MR, Dr. KP—Critical analysis and input.
Funding
This study did not receive any grant from funding agencies in the public, commercial or non-profit sectors. The authors did not receive support from any organization for the submitted work. No funding was received to assist with the preparation of this manuscript and for conducting this study.
Declarations
Conflicts of interest
The authors declare that they have no conflicts of interest.
Ethical Approval
This article does not include any animal studies. All procedures performed on human participants were in accordance with the ethical standards of the Institutional Ethical Committee and Review Board (MADC/IRB- XXVIII/2019/431).
Informed Consent
Written informed consent was obtained from all participants.
Footnotes
Publisher's Note
Springer Nature remains neutral with regard to jurisdictional claims in published maps and institutional affiliations.
Contributor Information
R. Manikandhan, Email: drmaniramanathan@gmail.com
S. Manikandan, Email: sarvodayamanikandan@gmail.com
Keerthana Ponvel, Email: drkeerthana.omfs@madch.edu.in.
Ratna Parameswaran, Email: drratna.ortho@madch.edu.in.
Sathya Shankar, Email: drsatya.prostho@madch.edu.in.
References
- 1.Tiwari B, Ladha K, Lalit A, Naik BD. Occlusal concepts in full mouth rehabilitation: an overview. J Indian Prosthodont Soc. 2014;14(4):344–351. doi: 10.1007/s13191-014-0374-y. [DOI] [PMC free article] [PubMed] [Google Scholar]
- 2.Rangarajan V, Yogesh PB, Gajapathi B, Ibrahim MM, Kumar RG, Karthik M. Concepts of occlusion in prosthodontics: a literature review, part II. J Indian Prosthodon Soc. 2016;16(1):8. doi: 10.4103/0972-4052.164915. [DOI] [PMC free article] [PubMed] [Google Scholar]
- 3.Derton N, Gracco A, Procopio O. Surgical and orthodontic treatment of skeletal Class III featuring severe transversal and sagittal discrepancy. Int Orthod. 2012;10(2):148–164. doi: 10.1016/j.ortho.2012.03.009. [DOI] [PubMed] [Google Scholar]
- 4.Chisnoiu AM, Picos AM, Popa S, Chisnoiu PD, Lascu L, Picos A, Chisnoiu R. Factors involved in the etiology of temporomandibular disorders-a literature review. Clujul Medical. 2015;88(4):473. doi: 10.15386/cjmed-485. [DOI] [PMC free article] [PubMed] [Google Scholar]
- 5.Li DT, Leung YY. Temporomandibular disorders: current concepts and controversies in diagnosis and management. Diagnostics. 2021;11(3):459. doi: 10.3390/diagnostics11030459. [DOI] [PMC free article] [PubMed] [Google Scholar]
- 6.Liao YF, Chiu YT, Huang CS, Ko EW, Chen YR. Presurgical orthodontics versus no presurgical orthodontics: treatment outcome of surgical-orthodontic correction for skeletal class III open bite. Plast Reconstr Surg. 2010;126(6):2074–2083. doi: 10.1097/PRS.0b013e3181f52710. [DOI] [PubMed] [Google Scholar]
- 7.Seo HJ, Denadai R, Pai BC, Lo LJ. Modern surgery-first approach concept in cleft-orthognathic surgery: a comparative cohort study with 3D quantitative analysis of surgical-occlusion setup. J Clin Med. 2019;8(12):2116. doi: 10.3390/jcm8122116. [DOI] [PMC free article] [PubMed] [Google Scholar]
- 8.Choi YJ, Lim H, Chung CJ, Park KH, Kim KH. Two-year follow-up of changes in bite force and occlusal contact area after intraoral vertical ramus osteotomy with and without Le Fort I osteotomy. Int J Oral Maxillofac Surg. 2014;43(6):742–747. doi: 10.1016/j.ijom.2014.02.005. [DOI] [PubMed] [Google Scholar]
- 9.Al-kalaly AA, Dyson JE, Wong RW, Schätzle M, Cheung LK, Rabie AB. Effect of different advancement positions on the maximum retrusive force of the mandible. Orthod Craniofac Res. 2013;16(1):56–64. doi: 10.1111/ocr.12004. [DOI] [PubMed] [Google Scholar]
- 10.Iwase M, Ohashi M, Tachibana H, Toyoshima T, Nagumo M. Bite force, occlusal contact area and masticatory efficiency before and after orthognathic surgical correction of mandibular prognathism. Int J Oral Maxillofac Surg. 2006;35(12):1102–1107. doi: 10.1016/j.ijom.2006.08.014. [DOI] [PubMed] [Google Scholar]
- 11.Saraçoǧlu A, Özpinar B. In vivo and in vitro evaluation of occlusal indicator sensitivity. J Prosthet Dent. 2002;88(5):522–526. doi: 10.1067/mpr.2002.129064. [DOI] [PubMed] [Google Scholar]
- 12.Kerstein R. Articulating paper mark misconceptions and computerized occlusal analysis technology. Dent Implantol Update. 2008;19(6):41–46. [PubMed] [Google Scholar]
- 13.Anilkumar Komuravelli D, Gawande S, Bhoir SK, Prof HO. Occlusal indicators-a simplified approach. J Interdiscip Dent Sci. 2021;10(1):07–14. [Google Scholar]
- 14.Qadeer S, Özcan M, Edelhoff D, Van Pelt H. Accuracy, reliability and clinical implications of static compared to quantifiable occlusal indicators. Eur J Prosthodont Restor Dent. 2021;28:1–2. doi: 10.1922/EJPRD_2202Qadeer12. [DOI] [PubMed] [Google Scholar]
- 15.Sarah Qadeer BD (2015) The limitations of traditional non-digital occlusal indicators when compared to the T-scan computerized occlusal analysis technology. In: Handbook of Research on Computerized Occlusal Analysis Technology Applications in Dental Medicine. IGI Global
- 16.Schiffman E, Ohrbach R, Truelove E, Look J, Anderson G, Goulet JP, List T, Svensson P. Diagnostic criteria for temporomandibular disorders (DC/TMD) for clinical and research applications: recommendations of the International RDC/TMD Consortium Network and Orofacial Pain Special Interest Group. J Oral Facial Pain Headache. 2014;47(6):438–445. doi: 10.11607/jop.1151. [DOI] [PMC free article] [PubMed] [Google Scholar]
- 17.Schiffman EL, Truelove EL, Ohrbach R, Anderson GC, John MT, List T, Look JO. Assessment of the validity of the research diagnostic criteria for temporomandibular disorders: overview and methodology. J Orofac Pain. 2010;24(1):7. [PMC free article] [PubMed] [Google Scholar]
- 18.Wieczorek A, Loster J, Loster BW. Relationship between occlusal force distribution and the activity of masseter and anterior temporalis muscles in asymptomatic young adults. Biomed Res Int. 2013 doi: 10.1155/2013/354017. [DOI] [PMC free article] [PubMed] [Google Scholar]
- 19.Davies S, Gray RM. What is occlusion? Br Dent J. 2001;191:235. doi: 10.1038/sj.bdj.4801151. [DOI] [PubMed] [Google Scholar]
- 20.Davies SJ, Gray RM, Sandler PJ, O'Brien KD. Orthodontics and occlusion. Br Dent J. 2001;191(10):539–549. doi: 10.1038/sj.bdj.4801229. [DOI] [PubMed] [Google Scholar]
- 21.Nalini MS, Sinha M. Role of T-scan in digital occlusal analysis—a review. Int J Res Rep Dent. 2018;1(2):1–7. [Google Scholar]
- 22.Bishara SE, Burkey PS, Kharouf JG. Dental and facial asymmetries—a review. Angle Orthod. 1994;64(2):89–98. doi: 10.1043/0003-3219(1994)064<0089:DAFAAR>2.0.CO;2. [DOI] [PubMed] [Google Scholar]
- 23.Cheong YW, Lo LJ. Facial asymmetry: etiology, evaluation, and management. Chang Gung Med J. 2011;34(4):341–351. [PubMed] [Google Scholar]
- 24.Bozhkova TP. The T-scan system in evaluating occlusal contacts. Folia Med. 2016;58(2):122. doi: 10.1515/folmed-2016-0015. [DOI] [PubMed] [Google Scholar]
- 25.Komali G, Ignatius AV, Srivani GS, Anuja K. T-scan system in the management of temporomandibular joint disorders—a review. J Indian Acad Oral Med Radiol. 2019;31(3):252. doi: 10.4103/jiaomr.jiaomr_46_19. [DOI] [Google Scholar]
- 26.Pahkala RH, Kellokoski JK. Surgical-orthodontic treatment and patients’ functional and psychosocial well-being. Am J Orthod Dentofac Orthop. 2007;132(2):158–164. doi: 10.1016/j.ajodo.2005.09.033. [DOI] [PubMed] [Google Scholar]
- 27.Lai W, Kazuhiro Y, Kooji H, Ritsuo T, Tadaharu K. The long term stability after orthognathic surgery in prognathic patients with mandibular asymmetry. Sichuan da xue xue bao Yi xue ban J Sichuan Univ Med Sci Edition. 2003;34(1):104–108. [PubMed] [Google Scholar]
- 28.Sharma A, Rahul GR, Poduval ST, Shetty K, Gupta B, Rajora V. History of materials used for recording static and dynamic occlusal contact marks: a literature review. J Clin Exp Dent. 2013;5(1):e48. doi: 10.4317/jced.50680. [DOI] [PMC free article] [PubMed] [Google Scholar]
- 29.Brizuela-Velasco A, Álvarez-Arenal Á, Ellakuria-Echevarria J, Río-Highsmith JD, Santamaría-Arrieta G, Martín-Bianco N (2015) Influence of articulating paper thickness on occlusal contacts registration: a preliminary report. Int J Prosthodont 28(4):360–362 [DOI] [PubMed]
- 30.Kürklüarpacay D, Bayindir F, Dinçkalyanikoğlu N. Evaluation of premature contacts using the T-scan III. Open J Stomatol. 2019;9(5):136–145. doi: 10.4236/ojst.2019.95014. [DOI] [Google Scholar]
- 31.Pyakurel U, Long H, Jian F, Sun J, Zhu Y, Jha H, Lai W. Mechanism, accuracy and application of T-Scan system in dentistry—a review. J Nep Dent Assoc. 2013;13(1):52–56. [Google Scholar]
- 32.Agbaje JO, Van de Casteele E, Salem AS, Anumendem D, Shaheen E, Sun Y, Politis C. Assessment of occlusion with the T-scan system in patients undergoing orthognathic surgery. Sci Rep. 2017;7(1):5356. doi: 10.1038/s41598-017-05788-x. [DOI] [PMC free article] [PubMed] [Google Scholar]