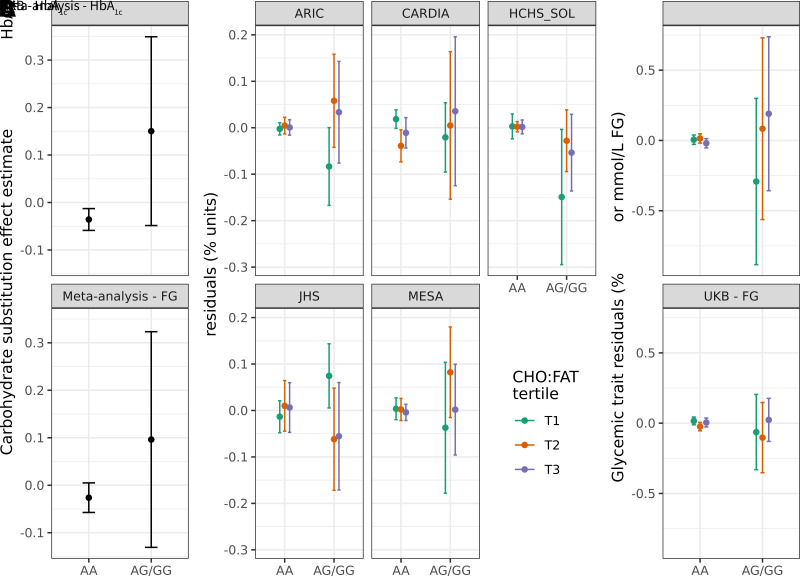
Figure 1.
Exploration of the rs79762542 interaction and replication. A: Genotype-stratified dietary main effect estimates. B: Stratified plots (one for each cohort with HbA1c available) display residualized HbA1c within strata defined by both genotype at rs79762542 (none vs. any minor alleles) and tertile of carbohydrate/fat ratio. This ratio was defined in the pooled data set on a caloric basis and is used to provide a visual representation of the modeled macronutrient exchange. C: Similar stratified plots for the UKB replication cohort. For B and C, the y-axis displays residuals after regressing the relevant trait (HbA1c or FG) on the set of covariates used in the replication analysis. Error bars indicate 95% CIs for the effect estimates (A) or mean residual values after stratification (B and C).

