Abstract
Neutral loss (NL) spectral data presents a mirror of MS2 data, and is a valuable yet largely untapped resource for molecular discovery and similarity analysis. Tandem mass spectrometry (MS2) data is effective for the identification of known molecules and the putative identification of novel, previously uncharacterized molecules (unknowns). Yet, MS2 data alone is limited in characterizing structurally related molecules. To facilitate unknown identification and complement the METLIN-MS2 fragment ion database for characterizing structurally related molecules, we have created a MS2 to NL converter as a part of the METLIN platform. The converter has been used to transform METLIN’s MS2 data into a neutral loss database (METLIN-NL) on over 860,000 individual molecular standards. The platform includes both the MS2 to NL converter and a graphical user interface enabling comparative analyses between MS2 and NL data. Examples of NL spectral data are shown with oxylipin analogues and two structurally related statin molecules to demonstrate NL spectra and their ability to help characterize structural similarity. Mirroring MS2 data to generate NL spectral data offers a unique dimension for chemical and metabolite structure characterization.
Graphical Abstract
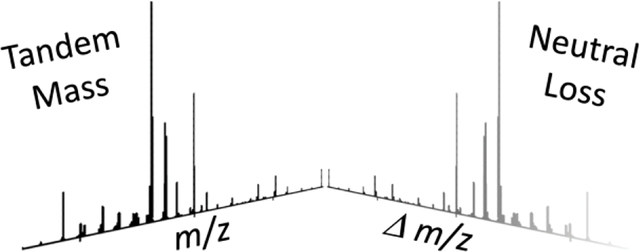
Similarity analysis1–4 and molecular networking5,6 using tandem mass spectrometry (MS2) data have become valuable approaches for identifying previously uncharacterized molecules (unknowns).1 Yet key structural information can be lost when relying solely on fragment ion data, for example, the loss of a sulfate ion from two similar molecules of different masses will not result in fragment ion overlap.7 This is of significant practical relevance. A user who would try to identify an unknown based on a MS2 database similarity search would not succeed in obtaining structurally relevant matches. However, retrieving this structurally useful information is possible by analyzing the differences between the molecular ion and the fragment ion, or better known as the neutral loss (NL) and symbolized by Δm/z. NLs1,2 constitute a rich resource, and have already been widely used in proteomics, pharmacology, and metabolomics for over three decades1,2,8–12 as represented by over a thousand papers on the topic. Yet, even though mass spectrometry-based NL analysis has been extensively applied, no small molecule MS2 to NL conversion programs exist, nor any comprehensive library of NL spectra.
Unlike MS2 data, which projects the m/z values and intensity of the precursor and each fragment, NL data, Δm/z, is projected as the difference between precursor ions and its respective fragment ions. It also can be generated as a difference between fragment ions.10
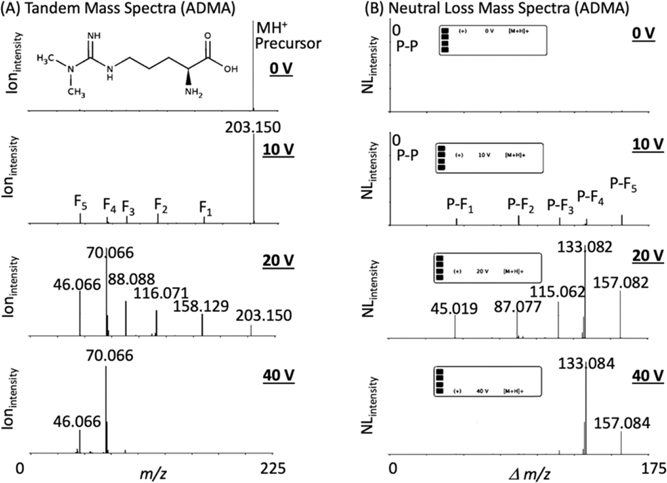
The new METLIN NL converter has been created as a general resource, and to convert METLIN’s 860,000 MS2 small molecule molecular standards database into a mirrored NL database (METLIN-NL) to facilitate neutral loss searching. The NL data was derived across a broad range of standards representing hundreds of different chemical classes.3,13 The converter was designed to input METLIN’s MS2 data and convert it to METLIN-NL spectra (e.g. Figure 1 asymmetric dimethylarginine (ADMA)) by using the converter to calculate the differences between the precursor molecular ion and the fragment ions in the experimental MS2 mass spectra (Figure 1A). The NL spectra (NLintensity vs Δm/z) were created (e.g. ADMA Figure 1B) with the NL intensity (NLintensity) using the fragment ion intensities from each precursor/fragment generated NL (Δm/z). It should be noted that not all precursor to fragment peaks represent a true NL between the precursor and fragment ions, and therefore some of the peaks in the NL spectra can also be considered (as recently described10) hypothetical neutral losses.
Figure 1.
The METLIN-NL mass spectral database was derived from the METLIN-MS2 data on over 860,000 molecular standards. (A) Asymmetric dimethylarginine (ADMA) and its representative METLIN-MS2 spectra at four different collision energies. (B) METLIN-NL spectra (NLintensity vs. Δm/z) of ADMA was generated by calculating the difference between the precursor and fragment ions with NLintensity based on the original fragment ion intensities. “P” refers to precursor ion and “F” refers to fragment ion.
The MS2 to NL converter (https://metlin.scripps.edu and https://github.com/masspec/MS2ToNLConverter) allows users to view a single MS2 or NL spectra or do a comparison between two MS2 or NL data. When using METLIN IDs, the MS2 and NL data are already calculated but when using CSV files, the MS2 data is automatically converted to NL. To facilitate these analyses, METLIN-NL is built on a Linux platform with the initial version of the graphical user interface (GUI) created using Highcharts, HTML, JQuery, MySQL, and PHP. The GUI allows for comparative analyses between different compounds including neutral loss data (NLint vs Δm/z) as well as MS/MS data (Fragint vs m/z) in both positive and negative ionization modes. The GU also offers visualization either at each individual collision energy, or a “composite spectra” that is constitute of all spectra across the multiple collision energies. Once a spectrum (or spectra) has been generated, users will be able to hover the cursor on each peak to obtain detailed information about m/z, intensity, ionization mode, compound’s name, and collisional energy values. The user input – e.g. CSF file, for the website https://metlin-nl.scripps.edu/ requires compound name, masses with intensities, collision energy, positive/negative mode, and precursor value. Users have access to two downloadable CSV file to demonstrate formatting.
The converter operates in the following modes and allows users to create/compare the following data types:
| Input #1 | Input #2 | Graph Type |
|---|---|---|
| METLIN ID | --- | Shows MS2 and NL Spectra |
| METLIN ID | METLIN ID | Compares MS2 and NL Spectra |
| CSV | --- | Shows MS2 and NL Spectra |
| CSV | CSV | Compares MS2 and NL Spectra |
| METLIN ID | CSV | Compares MS2 and NL Spectra |
| CSV | METLIN ID | Compares MS2 and NL Spectra |
METLIN-NL is a compilation of NLintensity vs Δm/z spectra generated from METLIN’s eight distinct MS2 data sets created from 860,000 standards3. This compilation is represented within METLIN-NL at four different collision energies and in both positive and negative ionization modes. The rationale behind providing multiple conditions is that MS2 collision energies have not been standardized and such broad acquisition parameters are required to represent the output across different instrument types. An additional rationale for the array of conditions is that different molecules can fragment differently depending on the collision energies thus METLIN provides a broad range of empirical data across its 860,000 standards. It is worth noting that all of METLIN’s MS2 data is empirical data and has not been generated from predictive in silico-based approaches.
A secondary set of METLIN-NL data has also been accumulated based on precursor minus fragment ion transitions as well as all possible fragment to fragment ion transitions to provide a more comprehensive set of experimentally derived structural data. Unlike the original METLIN-MS2 database, METLIN-NL represents a translation that more effectively enables the molecular annotation of unknown molecular entities since NL data inherently corrects for molecular weight differences.
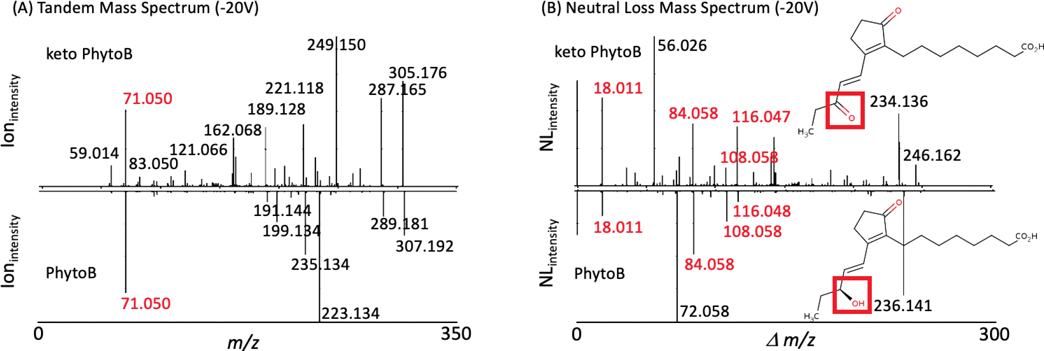
To test the utility of METLIN-NL we examined two different types of molecular structures, oxylipins and a pharmaceutical (statin) drug and its demethylated metabolite. Oxylipins14 represent a class of highly active lipid metabolites ubiquitous in humans and plants, and specifically, the phytoprostanes (PhytoPs) class of oxylipins resemble prostaglandin-like compounds that are found in seeds and vegetable oils derived from oxidative cyclization of α-linolenic acid. Since PhytoPs are a class of highly structurally related oxylipins and are suspected to have additional unidentified analogs,14–16 we chose them to demonstrate the utility of METLIN-NL. Tandem MS and NL data were recently generated on a set of PhytoPs, including the structural analogs 16-B1-PhytoP and 16-keto 16-B1-PhytoP (Figure 2). When trying to extrapolate/correlate the observed tandem MS spectra of the two PhytoPs, classic similarity searching was of very limited value providing only one overlapping ion, even though some fragments presented an expected two Dalton difference (Figure 2A). This exemplifies that two structurally very similar molecules can yield highly different MS2 spectra limiting similarity searching possibilities and thereby severely impacting the usefulness of this approach for the identification of chemically closely related substances. However NL similarity analysis yielded multiple overlapping NLs (Figure 2B). Further analysis of the tandem MS data as well as the molecular weight difference between the two molecules being 2 Daltons, were consistent with 16-keto 16-B1-PhytoP. This NL data (unlike the MS2 data) helped to easily correlate the two molecules, and the distinguishing NL and fragment ions exclusive to 16-keto 16-B1-PhytoP and 16-B1-Phyto provided significant structural information.
Figure 2.
MS2 and NL data on two related oxylipins (16 keto 16-B1-PhytoP and 16-B1-PhytoP) and the statin drugs rosuvastatin and desmethyl rosuvastatin. (A) Oxylipin MS2 data show little overlap (in red) in contrast to the (B) NL spectra with the high resolution neutral loss data facilitating similarity analysis with both providing complementary structural information. The red box denotes the only (minor) structural differences between the two molecules.
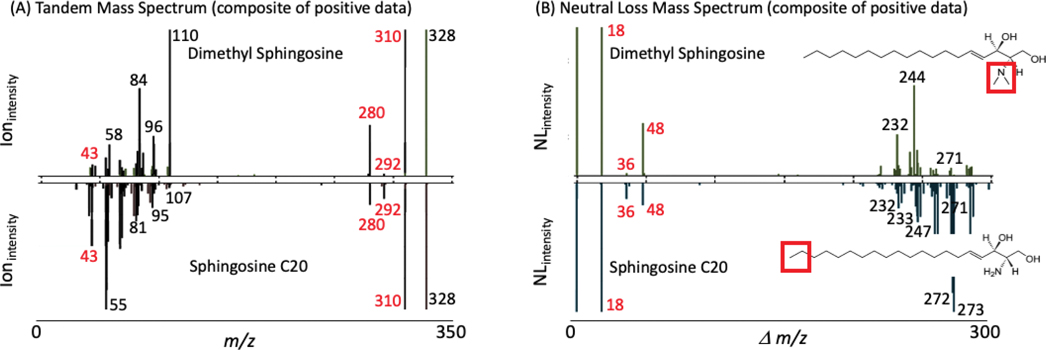
Another example with dimethyl sphingosine and sphingosine C20 (Figure 3A & 3B) further shows the synergy that MS2 and NL data can have between structural analogues. Dimethyl sphingosine and sphingosine C20 (A) MS2 and (B) NL data, each have the same elemental composition yet distinct structures. In this case both the MS2 data and the NL data show multiple overlapping peaks thus representing an example where both types of complementary data provide confirmation of the structural similarity yet each has unique distinguishing information.
Figure 3.
Synergy between MS2 and neutral loss data on two related sphingosine molecules. Dimethyl sphingosine and sphingosine C20 (A) MS2 and (B) neutral loss data, both the MS2 data and the neutral loss data show both overlapping and distinctly different peaks. The red box denotes the structural differences between the two molecules.
The purpose of having a large database is to help reduce the need for speculation, and allow for the rapid identification of molecules. However, since many molecular structures are not represented in any database, similarity analyses offer an alternative in the preliminary characterization process. This process extends beyond naturally occurring molecules and can be applied just as readily to xenobiotics and other chemical entities. The third example in applying METLIN-NL is shown here for a non endogenous drug molecule and its metabolite.
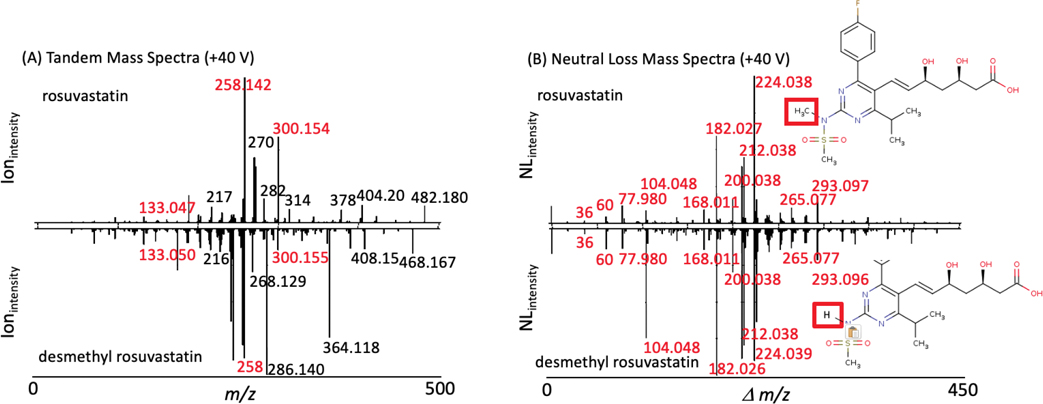
The well known cholesterol-lowering statin drug rosuvastatin17 (trade name Crestor) and its active metabolite desmethyl rosuvastatin18 differ in mass by 14 Daltons (demethylation reaction) and the MS2 and NL data (Figure 4A & 4B) of these two molecules have recently been acquired and populated within METLIN and METLIN-NL. As was observed with the oxylipins, tandem MS data was of limited utility when searching METLIN (Figure 4A), where 3 fragment ions were overlapping between the two molecules. However NL matching/detection showed near complete overlap (Figure 4B). Further analysis of the tandem MS data as well as the molecular weight difference between the two molecules being 14 Daltons, were consistent with loss of a methyl group. For the rosuvastatin NL data, the overlap in the NL data clearly dominated the comparative analyses, making similarity searching much more effective using NL while the MS2 data provided complementary information that was informative for structural determination. Overall, the NL data which was completely derived from the MS2 data, is more effective (than MS2) at showing similarity.
Figure 4.
MS2 and NL data on two related statins. Rosuvastatin and desmethyl rosuvastin (A) MS2 and (B) NL data, the MS2 data show few overlapping peaks (in red) while the NL spectra provide near complete overlap. Interestingly, while the NLs help facilitate similarity, the MS2 data provides more structurally distinguishing features. The red box denotes the only (minor) structural differences between the two molecules.
METLIN’s molecular standards with systematically acquired experimental MS2 data across multiple collision energies, allows for the comprehensive generation and graphical user interface (beta) visualization (Figure 4) of NL data. Fragment ion and NL similarity analysis1 was originally developed to aid in the identification of novel molecules (unknowns)1 by using fragment ion and NL data to help align an unknown molecule to compounds with similar fragmentation data within a database. However now, with a NL database of small molecules available via METLIN-NL, NL similarity analysis can be more readily applied to a host of biological and chemical challenges.
Overall, The METLIN MS2 to NL converter and METLIN-NL empirically derived data will enable new types of analyses facilitating more rapid identification of unknown compounds via both fragment ion and NL similarity searching.2 Both biologists and chemists will be able to apply METLIN-NL to the structure elucidation of unknowns derived from animals,19 plants,14,20 or microbiota21; and METLIN-NL can also be used as a resource for informatics22 as well as identifying unexpected synthetic chemical or enzymatically modified drug products (e.g. pharmaceuticals23) as it is populated with both biological and chemical entities. Given METLIN’s extensive userbase,3 and the ubiquitous application of mass spectrometry-based NL analysis (dating back three decades), METLIN-NL and its MS2 to NL converter promises to have wide-ranging utility.
Acknowledgements
This research was partially funded by National Institutes of Health grants R35 GM130385 (G.S.), P30 MH062261 (G.S.), P01 DA026146 (G.S.), and U01 CA235493 (G.S.) and by Ecosystems and Networks Integrated with Genes and Molecular Assemblies (ENIGMA), a Scientific Focus Area Program at Lawrence Berkeley National Laboratory for the U.S. Department of Energy, Office of Science, Office of Biological and Environmental Research, under contract number DE-AC02-05CH11231 (G.S.).
References
- 1.Benton HP; Wong DM; Trauger SA; Siuzdak G XCMS2: Processing Tandem Mass Spectrometry Data for Metabolite Identification and Structural Characterization. Anal. Chem. 2008, 80, 6382–6389. 10.1021/ac800795f [DOI] [PMC free article] [PubMed] [Google Scholar]
- 2.Guijas C; Montenegro-Burke JR; Domingo-Almenara X; Palermo A; Warth B; Hermann G; Koellensperger G; Huan T; Uritboonthai W; Aisporna AE; Wolan DW; Spilker ME; Benton HP; Siuzdak G METLIN: A technology platform for identifying knowns and unknowns. Anal Chem 2018, 90(5), 3156–64. 10.1021/acs.analchem.7b04424 [DOI] [PMC free article] [PubMed] [Google Scholar]
- 3.Xue J; Guijas C; Benton HP; Warth B; Siuzdak G METLIN MS2 molecular standards database: a broad chemical and biological resource. Nat. Methods 2020, 17, 953–954. 10.1038/s41592-020-0942-5 [DOI] [PMC free article] [PubMed] [Google Scholar]
- 4.Tautenhahn R; Cho K; Uritboonthai W; Zhu Z;Patti GJ; Siuzdak G An accelerated workflow for untargeted metabolomics using the METLIN database. Nat Biotechnol. 2012, 30,826–828. 10.1038/nbt.2348 [DOI] [PMC free article] [PubMed] [Google Scholar]
- 5.Li D; Baldwin IT; Gaquerel E Navigating natural variation in herbivory-induced secondary metabolism in coyote tobacco populations using MS/MS structural analysis. Proc Natl Acad Sci U S A. 2015, 112 (30), E4147–4155. 10.1073/pnas.1503106112 [DOI] [PMC free article] [PubMed] [Google Scholar]
- 6.Watrous J; Roach P; Alexandrov T; Heath BS; Yang JY; Kersten RD; van der Voort M; Pogliano K; Gross H; Raaijmakers JM;Moore BS; Laskin J; Bandeira N; Dorrestein PC Mass spectral molecular networking of living microbial colonies. Proc Natl Acad Sci U S A. 2012, 109(26):E1743–E1752. 10.1073/pnas.1203689109 [DOI] [PMC free article] [PubMed] [Google Scholar]
- 7.Flasch M; Bueschl C; Woelflingseder L; Schwartz-Zimmermann HE; Adam G; Schuhmacher R; Marko D; Warth B Stable Isotope-Assisted Metabolomics for Deciphering Xenobiotic Metabolism in Mammalian Cell Culture. ACS Chem Biol. 2020. 15, 970–981. 10.1021/acschembio.9b01016 [DOI] [PMC free article] [PubMed] [Google Scholar]
- 8.Martin DB; Eng JK, Nesvizhskii AI; Gemmill A; Aebersold R Investigation of neutral loss during collision-induced dissociation of peptide ions. Anal Chem. 2005. 77, 4870–4882. 10.1021/ac050701k. [DOI] [PMC free article] [PubMed] [Google Scholar]
- 9.Horai H; Arita M; Kanaya S; Nihei Y; Ikeda T; Suwa K; Ojima Y; Tanaka K; Tanaka S; Aoshima K; Oda Y; Kakazu Y; Kusano M; Tohge T; Matsuda F; Sawada Y; Hirai MY; Nakanishi H; Ikeda K; Akimoto N; Maoka T; Takahashi H; Ara T; Sakurai N; Suzuki H; Shibata D; Neumann S; Iida T; Tanaka K; Funatsu K; Matsuura F; Soga T; Taguchi R; Saito K; Nishioka T MassBank: a public repository for sharing mass spectral data for life sciences. J Mass Spectrom. 2010, 45, 703–714. 10.1002/jms.1777 [DOI] [PubMed] [Google Scholar]
- 10.Xing S; Hu Y; Yin Z; Liu M; Tang X; Fang M; Huan T Retrieving and Utilizing Hypothetical Neutral Losses from Tandem Mass Spectra for Spectral Similarity Analysis and Unknown Metabolite Annotation. Anal Chem. 2020, 92, 14476–14483. 10.1021/acs.analchem.0c02521 [DOI] [PubMed] [Google Scholar]
- 11.Heller DN; Murphy CM; Cotter RJ; Fenselau C; Uy OM Constant neutral loss scanning for the characterization of bacterial phospholipids desorbed by fast atom bombardment. Anal Chem. 1988, 60, 2787–2791. https://pubs.acs.org/doi/pdf/10.1021/ac00175a029 [DOI] [PubMed] [Google Scholar]
- 12.Schwudke D; Oegema J; Burton, Entchev E.; Hannich JT; Ejsing CS; Kurzchalia T; Shevchenko A. Lipid profiling by multiple precursor and neutral loss scanning driven by the data-dependent acquisition. Anal Chem. 2006, 78, 585–595. 10.1021/ac051605m [DOI] [PubMed] [Google Scholar]
- 13.Djoumbou Feunang Y; Eisner R; Knox C; Chepelev L; Hastings J; Owen G; Fahy E; Steinbeck C; Subramanian S; Bolton E; Greiner R; Wishart DS ClassyFire: automated chemical classification with a comprehensive, computable taxonomy. J Cheminform. 2016, 8, 61. 10.1186/s13321-016-0174-y [DOI] [PMC free article] [PubMed] [Google Scholar]
- 14.Galano JM; Lee YY; Oger C; Vigor C; Vercauteren J; Durand T; Giera M; Lee JC Isoprostanes, neuroprostanes and phytoprostanes: An overview of 25 years of research in chemistry and biology. Prog Lipid Res. 2017, 68, 83–108. 10.1016/j.plipres.2017.09.004 [DOI] [PubMed] [Google Scholar]
- 15.Watrous JD; Niiranen TJ; Lagerborg KA; Henglin M; Xu YJ; Rong J; Sharma S; Vasan RS; Larson MG; Armando A; Mora S; Quehenberger O; Dennis EA; Cheng S; Jain M Directed Non-targeted Mass Spectrometry and Chemical Networking for Discovery of Eicosanoids and Related Oxylipins. Cell Chem Biol. 2019, 26(3), 433–442. 10.1016/j.chembiol.2018.11.015 [DOI] [PMC free article] [PubMed] [Google Scholar]
- 16.Young RSE; Bowman AP; Williams ED; Tousignant KD; Bidgood CL; Narreddula VR; Gupta R; Marshall DL; Poad BLJ; Nelson CC; Ellis SR; Heeren RMA; Sadowski MC; Blanksby SJ Apocryphal FADS2 activity promotes fatty acid diversification in cancer. Cell Rep. 2021, 34, 108738. 10.1016/j.celrep.2021.108738 [DOI] [PubMed] [Google Scholar]
- 17.Fellström BC; Jardine AG; Schmieder RE; Holdaas H; Bannister K; Beutler J; Chae DW; Chevaile A; Cobbe SM; Grönhagen-Riska C; De Lima JJ; Lins R; Mayer G; McMahon AW; Parving HH; Remuzzi G; Samuelsson O; Sonkodi S; Sci D; Süleymanlar G; Tsakiris D; Tesar V; Todorov V; Wiecek A; Wüthrich RP; Gottlow M; Johnsson E; Zannad F; AURORA Study Group. Rosuvastatin and cardiovascular events in patients undergoing hemodialysis. N Engl J Med. 2009, 360, 1395–1407. 10.1056/nejmoa0810177 [DOI] [PubMed] [Google Scholar]
- 18.Martin PD; Warwick MJ; Dane AL; Hill SJ; Giles PB; Phillips PJ; Lenz E Metabolism excretion, and pharmacokinetics of rosuvastatin in healthy adult male volunteers. Clin Ther. 2003, 25(11), 2822–2835. 10.1016/S0149-2918(03)80336-3 [DOI] [PubMed] [Google Scholar]
- 19.Rosenberg G; Yehezkel D; Hoffman D; Mattioli CC; Fremder M; Ben-Arosh H; Vainman L; Nissani N; Hen-Avivi S; Brenner S; Itkin M; Malitsky S; Ohana E; Ben-Moshe NB; Avraham R Host succinate is an activation signal for Salmonella virulence during intracellular infection. Science 2021, 371(6527), 400–405. 10.1126/science.aba8026 [DOI] [PubMed] [Google Scholar]
- 20.Lipan L; Collado-González J; Domínguez-Perles R; Corell M; Bultel-Poncé V; Galano JM; Durand T; Medina S; Gil-Izquierdo Á; Carbonell-Barrachina Á Phytoprostanes and Phytofurans-Oxidative Stress and Bioactive Compounds-in Almonds are Affected by Deficit Irrigation in Almond Trees. J Agric Food Chem. 2020, 68(27),7214–7225. 10.1021/acs.jafc.0c02268 [DOI] [PubMed] [Google Scholar]
- 21.Guo H; Chou WC; Lai Y; Liang K; Tam JW; Brickey WJ; Chen L; Montgomery ND; Li X; Bohannon LM; Sung AD; Chao NJ; Peled JU; Gomes ALC; van den Brink MRM; French MJ; Macintyre AN; Sempowski GD; Tan X; Sartor RB; Lu K; Ting JPY Multi-omics analyses of radiation survivors identify radioprotective microbes and metabolites. Science 2020, 370, 6516. 10.1126/science.aay9097 [DOI] [PMC free article] [PubMed] [Google Scholar]
- 22.Wandy J; Zhu Y; van der Hooft JJ; Daly R; Barrett MP; Rogers S, “Ms2lda.org: web-based topic modelling for substructure discovery in mass spectrometry,” Bioinformatics, vol. 34, no. 2, pp. 317–318, 2018. 10.1093/bioinformatics/btx582 [DOI] [PMC free article] [PubMed] [Google Scholar]
- 23.Giera M; de Vlieger JS; Lingeman H; Irth H; Niessen WM Structural elucidation of biologically active neomycin N-octyl derivatives in a regioisomeric mixture by means of liquid chromatography/ion trap time-of-flight mass spectrometry. Rapid Commun Mass Spectrom. 2010, 24(10), 1439–1446. 10.1002/rcm.4534 [DOI] [PubMed] [Google Scholar]


