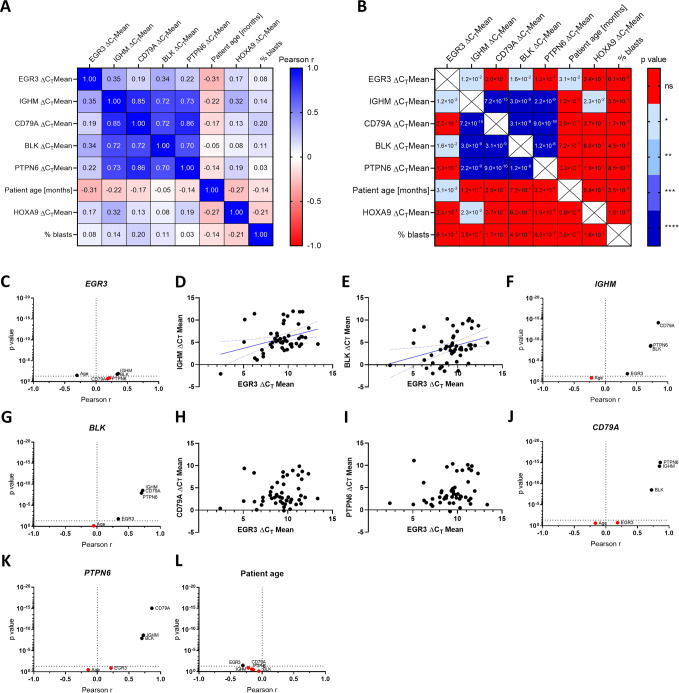
Fig. 5. Pearson correlation testing of the diagnosis cohort.
Pearson correlation matrix indicating the Pearson r value (A) and p value (B) of all tested correlations. Volcano plots showing Pearson correlations of EGR3 (C), IGHM (F), BLK (G), CD79A (J), PTPN6 (K) and patient age (L). Correlations with p ≥ 0.05 were considered non-significant and marked in red. Patients plotted according to their IGHM/EGR3 (D), BLK/EGR3 (E), CD79A/EGR3 (H) and PTPN6/EGR3 (I) ΔCT mean expression values.

