

SUMMARY
Five-year survival for pancreatic ductal adenocarcinoma (PDAC) patients remains below 7% due to the lack of effective treatments. Here, we report that combined ablation of EGFR and c-RAF expression results in complete regression of a significant percentage of PDAC tumors driven by Kras/Trp53 mutations in genetically engineered mice. Moreover, systemic elimination of these targets induces toxicities that are well-tolerated. Response to this targeted therapy correlates with transcriptional profiles that resemble those observed in human PDACs. Finally, inhibition of EGFR and c-RAF expression effectively blocked tumor progression in nine independent patient-derived xenografts (PDX) carrying KRAS and TP53 mutations. These results open the door to the development of targeted therapies for PDAC patients.
SIGNIFICANCE
To date, no therapeutic strategy has achieved significant regression of human or mouse PDAC. Here, we describe the complete regression of a subset of mouse Kras/Tpr53 mutant tumors upon systemic ablation of EGFR and c-RAF expression. Similar results were obtained upon EGFR and c-RAF knockdown in PDX-derived tumor models. This therapeutic strategy was well tolerated due to the lack of effect on MAPK and PI3K signaling in normal tissues. EGFR inhibitors have already been approved to treat PDAC patients in combination with gemcitabine. Thus, our results should stimulate the identification of selective c-RAF inhibitors that preserve MAPK and PI3K activity. Availability of such inhibitors will make possible to translate these observations to a clinical scenario.
INTRODUCTION
Pancreatic ductal adenocarcinoma (PDAC) is the third cause of cancer deaths in the US and is projected to become second after lung cancer by 2030 (Rahib et al., 2014). The 5-year survival rate of PDAC patients remains below 7% due to the lack of effective treatments. Gemcitabine, a nucleoside analogue approved in 1997, is still the standard of care (Burris III et al., 1997; Hidalgo, 2010) and its combination with nab-paclitaxel or erlotinib has shown only modest improvements (Von Hoff et al., 2013; Moore et al., 2007). Other therapies such as FOLFIRINOX are very toxic and can only be administered to selected patients (Garrido-Laguna and Hidalgo, 2015). The main genetic drivers of PDAC have been identified (Maitra and Hruban, 2008). Whereas mutations in KRAS appear to be the main initiating event, additional mutations in several tumor suppressors including TP53, CDKN2A, SMAD4, BRCA2 and TGFBR2 contribute to tumor progression. Unfortunately, none of these cancer drivers are currently druggable, thus making it difficult to devise effective therapies against PDAC. Only a small percentage of clinically relevant mutations may benefit from available targeted therapies (Aguirre et al., 2018).
So far, therapeutic strategies in genetically engineered mouse (GEM) PDAC models have failed to achieve tumor regression. Only tumor models driven by a doxycycline-inducible K-RASG12D undergo tumor regression upon silencing of K-RASG12D expression (Collins et al., 2012; Ying et al., 2012). Genetic studies in mice have illustrated that PDAC development requires EGFR expression due to its essential role in acinar to ductal metaplasia, a natural process thought to be responsible for tumor initiation in the presence of oncogenic K-RAS mutant (Ardito et al., 2012; Navas et al., 2012). However, in the absence of p53, EGFR expression is no longer essential for tumor development, although tumors appear with considerable delay. Thus, indicating that EGFR signaling still plays a role in the development of mutant Kras/Trp53-driven PDAC tumors (Ardito et al., 2012; Navas et al., 2012). Indeed, EGFR inhibitors have shown limited but reproducible responses in PDAC patients, leading to FDA approval of erlotinib for treating PDAC (Moore et al., 2007). Hence, we reasoned that combining inhibition of EGFR with other effector molecules known to play a role in K-RAS oncogenic signaling might unveil more efficacious therapies to treat PDAC.
RESULTS
Mutational complexity of PDACs driven by Kras/Trp53 mutations
GEM PDAC models driven by a resident oncogenic Kras mutant and loss or inactivation of Trp53 closely reproduce the natural history and histopathology of human tumors (Guerra et al., 2011; Hingorani et al., 2005). Exomic next generation sequencing (NGS) of these tumors revealed a number of missense mutations (13.3 mutations/tumor) (Table S1) similar to those reported elsewhere (Chung et al., 2017), a significant mutational complexity albeit more limited than that of their human counterpart (Bailey et al., 2016; Biankin et al., 2012; Jones et al., 2008; Raphael et al., 2017; Waddell et al., 2015; Witkiewicz et al., 2015). Bioinformatic analysis revealed that almost half of these mutated genes could be integrated within the signaling pathways found mutated in human PDACs (Jones et al., 2008). Interestingly, these mouse tumors display a wide heterogeneity since none of the 146 mutated genes identified in our analysis appeared in more than one tumor (Table S1). Thus, limiting our therapeutic options to those targeting K-RAS signaling pathways.
Combined Egfr and Raf1 ablation completely inhibits PDAC development in a tumor initiation model
We and others have previously reported that Egfr ablation prevented the formation of PanIN lesions in oncogenic Kras-driven GEM PDAC models. Furthermore, the absence of EGFR delayed PDAC development in the absence of p53 (Ardito et al., 2012; Navas et al., 2012). To identify effector molecules that could cooperate with Egfr ablation in preventing mutant Kras/Trp53-driven PDAC development, we added conditional floxed alleles to the Kras+/LSLG12Vgeo;Trp53lox/lox;Elas-tTA/TetO-Cre strain. This strain has been designated as KPeC to indicate that the driver mutations are selectively induced by the elastase gene promoter in the acinar cell compartment instead of in all pancreatic cell lineages as in the classical KPC model (Hingorani et al., 2005).
Among those K-RAS effectors likely to cooperate with EGFR in mediating PDAC development, we selected the CDK4 cell cycle kinase and the c-RAF kinase based on our prior observations that they are essential for the development of K-RASG12V driven lung tumors (Blasco et al., 2011; Puyol et al., 2010; Sanclemente et al., 2018). Moreover, ablation of CDK4 or c-RAF does not induce unacceptable toxic effects such as those observed upon ablation of the MEK1/2 and ERK1/2 kinases (Blasco et al., 2011; Puyol et al., 2010). To interrogate whether tampering with CDK4 activity could cooperate with EGFR ablation in preventing PDAC development, we mutated the endogenous Cdk4 to encode a kinase dead K35M isoform to better recapitulate pharmacological treatments.
As illustrated in Figure 1A, control KPeC mice (n=20) succumbed to PDAC at the average of 15 weeks of age. Expression of the kinase dead CDK4K35M (n=14) did not prevent PDAC development, but it increased the median survival of the tumor-bearing mice to similar to that observed in the absence of EGFR (Ardito et al., 2012; Navas et al., 2012). Combined ablation of Egfr and expression of CDK4K35M did not decrease the rate of PDAC development or further extended survival (n=11) (Figure 1A). Surprisingly, in contrast to the results obtained with lung tumors, ablation of Raf1 had no effect on PDAC development and all animals (n=13) succumbed to pancreatic tumors with a latency similar to that of KPeC mice (Figure 1B). However, concomitant ablation of Egfr and Raf1 completely prevented PDAC development (n=14), up to two years of age (Figure 1B). Detailed histological analysis of serial sections of their pancreata failed to identify PanIN lesions or even metaplasias. These mice retained K-RASG12V expression in their acinar cell compartment as determined by the presence of β-galactosidase, a surrogate marker for K-RASG12V expression (Guerra et al., 2003). Isolation of these cells by laser-capture microdissection confirmed efficient recombination of Raf1lox and Egfrlox alleles (Figure 1C). No such recombination was observed in adjacent acinar cells negative for β-galactosidase expression (Figure 1C). Thus, EGFR and c-RAF, but not CDK4, must signal through independent pathways essential for initiation and development of pancreatic tumors. Finally, inhibition of PDAC development requires complete absence of EGFR and c-RAF expression because different combinations of floxed and wild-type Egfr and Raf1 alleles in KPeC mice delayed, but did not prevent, PDAC development (Figure 1B).
Figure 1. Effect of Egfr, Raf1 and Cdk4 targeting on PDAC development.
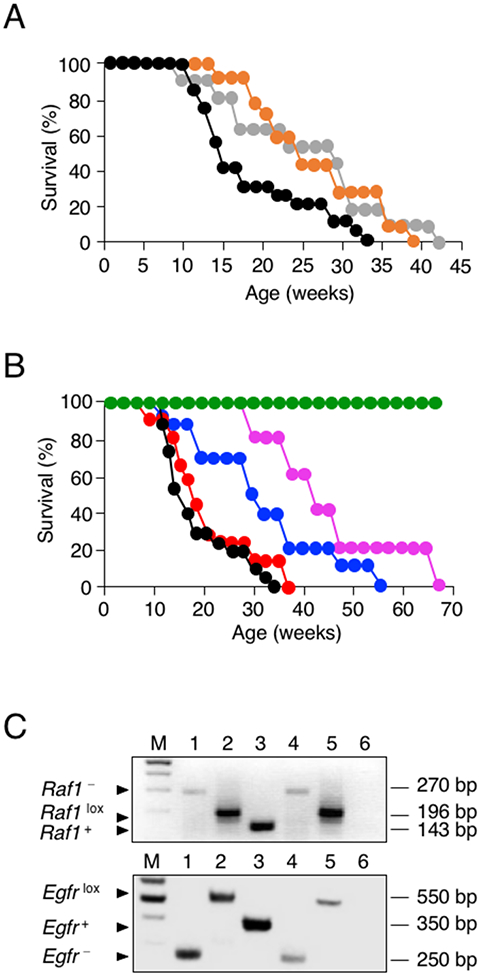
(A) Survival of control KPeC (black, n=20), KPeC;Cdk4K35M/K35M (orange, n=14), and KPeC;Egfrlox/lox;Cdk4K35M/K35M (gray, n=11) mice. All mice died of PDAC tumors at the indicated times.
(B) Survival of control KPeC (black, n=20), KPeC;Raf1lox/lox (red, n=13), KPeC;Egfrlox/lox;Raf1+/lox (blue, n=10), KPeC;Egfr+/lox;Raf1lox/lox (pink, n=5) and KPeC;Egfrlox/lox;Raf1lox/lox (green, n=14) mice. All mice died of PDAC tumors at the indicated times.
(C) PCR analysis of Egfr and Raf1 alleles using DNA extracted from laser captured acinar cells expressing K-RASG12V (identified by the X-Gal marker). Migration of recombined Egfr− and Raf1− alleles (lane 1), conditional Egfrlox and Raf1lox alleles (lane 2) and wild-type Egfr+ and Raf1+ alleles (lane 3) used as controls. DNA extracted from X-Gal positive (lane 4) and negative (lane 5) acinar cells of KPeC;Egfrlox/lox;Raf1lox/lox mice. Lane 6, blank control. Lane M, DNA size markers. DNA fragment size is indicated.
Generation of a “therapeutic” PDAC model for the genetic evaluation of anti-tumor and toxic effects of therapeutic targets
Target ablation at the time of tumor initiation does not reflect therapeutic intervention in the clinic. Moreover, in most studies, targets are selectively ablated in selected tissues or in those cells that express the oncogenic insult(s) (Drosten et al., 2017; Pérez-Mancera et al., 2012). These strategies fail to provide information regarding the toxic effects that might occur in the clinic when the targets are inhibited via systemic administration of the corresponding inhibitors. Therefore, we have developed a GEM strain that separates temporally and spatially tumor development from target ablation/inhibition. This strain, Kras+/FSFG12V;Trp53frt/frt;Elas-tTA/TetO-FlpO;Tg.UBC-CreERT2, designated as KPeFC, incorporates two distinct recombinases, FlpO and CreERT2. FlpO, responsible for tumor induction, is expressed by the same Tet-Off system used in the KPeC strain. Indeed, KPeFC and KPeC mice develop PanIN lesions and PDACs with complete penetrance and similar kinetics (Figure S1A, S1B). Expression of the tamoxifen (TMX)-inducible CreERT2 recombinase is driven by the promoter of the human Ubiquitin C gene (UBC), a locus expressed in all adult tissues (Ruzankina et al., 2007). Thus, exposure of KPeFC mice to a TMX containing diet allows the systemic recombination of any conditional floxed allele added to this strain.
Systemic ablation of EGFR and c-RAF expression in adult mice induces tolerable toxicities
Many therapies fail in the clinic due to unacceptable toxic effects (Gewirtz et al., 2010; Hwang et al., 2016). Thus, we examined whether concomitant, systemic ablation of EGFR and c-RAF expression could be well tolerated in mice. To this end, we exposed 12 week old Egfrlox/lox;Raf1lox/lox;Tg.UBC-CreERT2 mice to a TMX containing diet for 15 weeks (n=5 males, n=5 females). This treatment resulted in efficient recombination of both floxed alleles (Figure 2A). Egfr+/+;Raf1+/+;Tg.UBC-CreERT2 siblings were used as controls. Mice lost weight during the initial treatment, yet they recovered a few weeks later (Figure 2B). Egfrlox/lox;Raf1lox/lox;Tg.UBC-CreERT2 mice developed skin alterations such as hyperplasia and disorganization of the epidermis, hyperkeratosis, folliculitis and inflammation with increased numbers of mast cells and significant hair loss (Figure 2C). Moreover, these animals occasionally developed ulcers and scabs (Figure 2C). These toxic effects were similar to those previously observed in mice lacking EGFR in keratinocytes (Franzke et al., 2012). These skin defects are highly reminiscent of the acneiform rash and folliculitis observed in human patients treated with EGFR inhibitors (Owczarczyk-Saczonek et al., 2013). We also observed a slight disorganization of the crypts in the small intestine with increased numbers of apoptotic cells, however the overall architecture of the tissue was not affected (Figure 2D). No significant toxicities were observed in mice upon ablation of c-RAF expression. Taken together, these observations suggest that combined inhibition of EGFR and c-RAF signaling might be well tolerated by patients.
Figure 2. Ablation of EGFR and c-RAF expression induces acceptable toxicities.
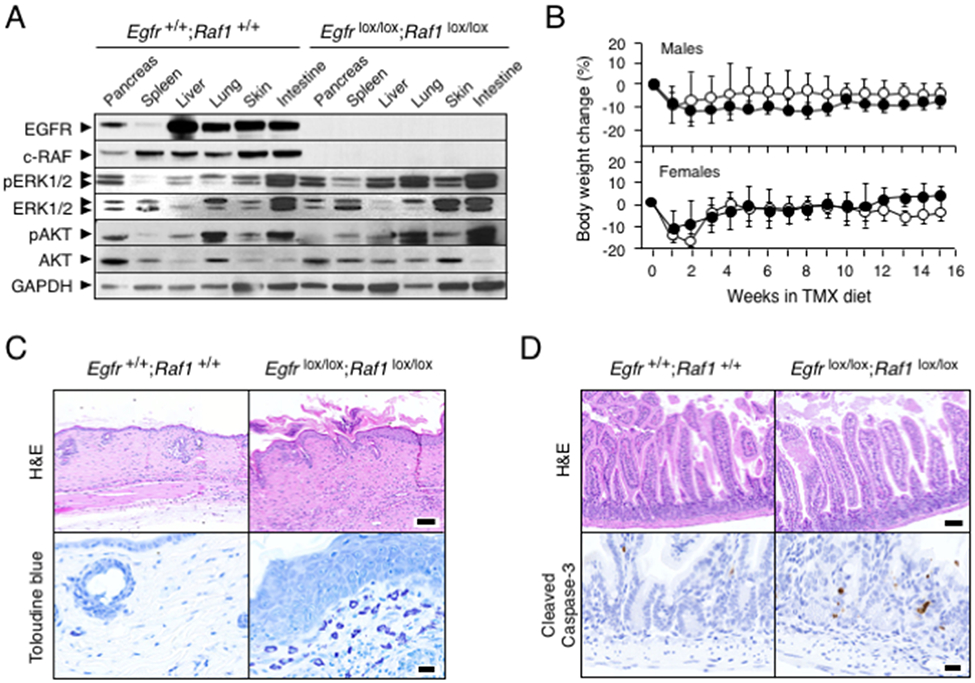
(A) Western blot analysis of EGFR, c-RAF, pERK1/2, ERK1/2, pAKT and AKT expression in tissues obtained from Egfr+/+;Raf1+/+;Tg.UBC-CreERT2 and Egfrlox/lox; Raf1lox/lox;Tg.UBC-CreERT2 mice after 3 weeks of TMX exposure. GAPDH served as a loading control.
(B) Body weight change in Egfr+/+;Raf1 +/+;Tg.UBC-CreERT2 (solid circles, n=5) and Egfrlox/lox;Raf1lox/lox;Tg.UBC-CreERT2 mice (open circles n=5) exposed to TMX for the indicated length of time. Error bars indicate mean ± SD.
(C) Representative H&E and Toluidine-blue staining of skin sections from Egfr+/+;Raf1+/+;Tg.UBC-CreERT2 and Egfrlox/lox;Raf1lox/lox;Tg.UBC-CreERT2 mice exposed to TMX for 15 weeks. Scale bars represent 100 μm (H&E) and 20 μm (toluidine blue).
(D) Representative H&E and cleaved Caspase-3 staining in sections of small intestine of Egfr+/+;Raf1+/+;Tg.UBC-CreERT2 and Egfrlox/lox;Raf1lox/lox;Tg.UBC-CreERT2 mice exposed to TMX for 15 weeks. Scale bars represent 100 μm (H&E) and 20 μm (cleaved Caspase-3).
Previous studies have shown that systemic ablation of the MEK1/2 and ERK1/2 kinases results in the rapid degeneration of the intestinal and colonic crypts leading to death within two weeks of TMX exposure (Blasco et al, 2011). Similar results have been observed upon ablation of the three members of the RAF kinase family but not when the systemic targeting was limited to c-RAF (Sanclemente et al., 2018). As illustrated in Figure 2A, concomitant elimination of Egfr and Raf1 in a variety of tissues did not affect either MAPK nor PI3K signaling, two of the main pathways responsible for homeostatic RAS signaling, an observation that may explain the minimal toxic effects observed upon ablation of EGFR and c-RAF expression.
Regression of advanced PDAC tumors upon systemic ablation of EGFR and c-RAF expression
Next, we assessed the consequences of systemically ablating EGFR and c-RAF expression in mice carrying advanced Kras/Trp53 mutant PDACs. Tumor bearing KPeFC (n=14) and KPeFC;Egfrlox/lox;Raf1lox/lox mice (n=45) carrying lesions ranging from 2 to 50 mm3 were exposed to a TMX-containing diet. Unfortunately, 4 out of 14 KPeFC and 14 out of 45 KPeFC;Egfrlox/lox;Rafllox/lox animals had to be eliminated due to various circumstances including the appearance of unrelated tumors, mainly sarcomas and papillomas. To determine whether these tumors were a consequence of spurious expression of the FlpO recombinase, we introduced a Rosa26CAG-tdTomato,-EGFP allele in KPeFC mice. These mice displayed FlpO-mediated recombinant activity in skin as well as in other tissues as revealed by the presence of dTomato+ cells (Figure S2A). Moreover, most of these dTomato+ cells became green upon TMX exposure due to expression of the EGFP marker mediated by the CreERT2 recombinase (Figure S2A). In addition, a significant percentage of KPeFC;Egfrlox/lox;Raf1lox/lox mice (n=19) could not be included in the study due to inefficient Cre-mediated recombination (Figure S2B). As a consequence, only 10 control KPeFC and 12 KPeFC;Egfrlox/lox;Raf1lox/lox mice could be evaluated in the trial.
Control KPeFC mice (n=10) died between 2 to 8 weeks following TMX exposure (Figure 3A). To our surprise, 8 of 12 KPeFC;Egfrlox/lox;Raf1lox/lox mice displayed a rapid decrease in tumor volume upon TMX exposure. Six mice, designated as “Regressors” (R), became tumor-free by micro-ultrasound analysis after six weeks of TMX exposure (Figure 3B, 3C). Four of these “Regressor” animals (R1-R4) were sacrificed after six weeks of TMX exposure whereas the remaining animals, R5 and R6, were allowed to survive for 10 additional weeks. No tumor reappearance, as evaluated by micro-ultrasound analysis, was observed during this time period (Figure 3B). Detailed histological examination of their pancreata revealed normal tissue architecture (Figure 3D). One “Regressor” mouse (R2) did not display any lesion at the location where the tumor was formerly located. Yet, the other “Regressor¨ mice (R1, R3 and R4) exhibited single tiny scars, presumably remnants of their original tumor (Figure 3D). These scars appeared as very small fibrotic lesions measuring between 0.05 mm3 to 0.5 mm3, reflecting a reduction in tumor volume over 5,000-fold (Figure 3D). They were mostly composed of a dense network of organized collagen fibers, along with a significant content of hyaluronic acid (Figure S3A, S3B). We also observed signs of chronic inflammation characterized by the presence of macrophages and T lymphocytes at their edges (Figure S3A, S3B). Scars of R1 and R6 mice contained a small percentage of Ki67+ proliferating cells that expressed significant levels of CK19 and pERK and retained EGFR expression, suggesting that they represent residual unrecombined tumor cells (Figure 3D, 3E). Indeed, some of these cells displayed atypia and loss of cellular architecture. Scars present in the remaining “Regressor” mice (R3-R5) also contained CK19+ epithelial cells organized in ductal-like structures. However, they express low levels of pERK and no EGFR. Although a few of these cells also stained for Ki67, they did not present atypia suggesting that they may not be neoplastic cells (Figure 3E).
Figure 3. Egfr and Raf1 ablation induces regression of PDAC tumors.
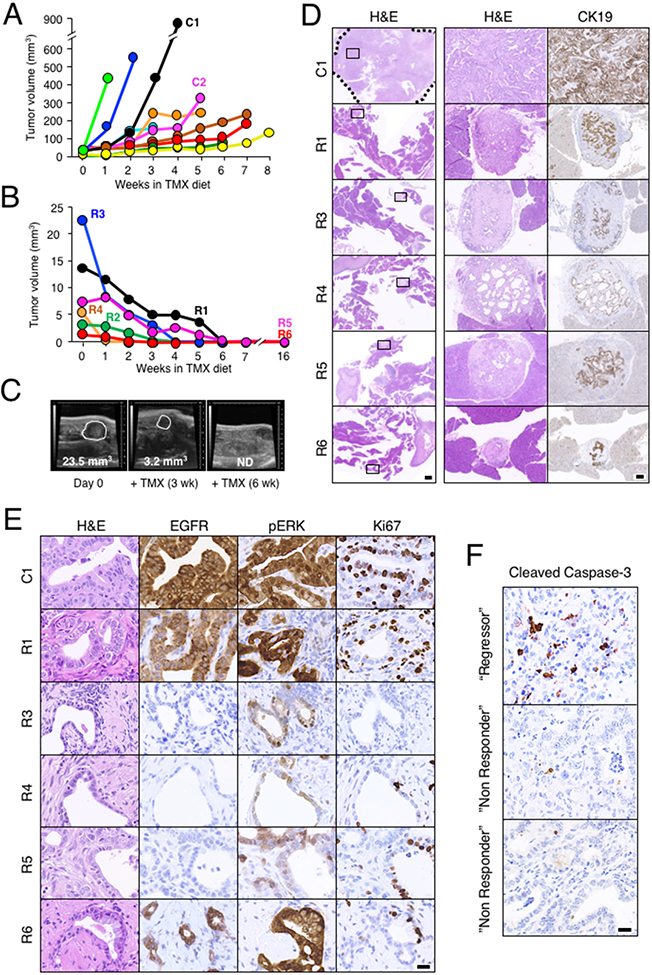
(A) Total tumor volume visualized by weakly ultrasound imaging of KPeFC;Egfr+/+;Raf1+/+ control mice (n=10 mice, 15 tumors) exposed to a TMX diet for the indicated time. Each color represents a different mouse. Mice were sacrificed at humane end point due to tumor burden at the last time point indicated in the graph. C1 identifies the control mouse analyzed in panels D and E. C2 identifies the control mouse analyzed in Figure 4F (see below).
(B) Total tumor volume visualized by weakly ultrasound imaging of KPeFC;Egfrlox/lox;Raf1lox/lox mice (n= 6 mice, 7 tumors) exposed to a TMX diet for the indicated time. Each color represents a different mouse. Mice were sacrificed for histopathological analysis at the last time point indicated in the graph. R1 to R6 identifies the “Regressor” mice analyzed in panels D and E (see below).
(C) Representative ultrasound images of the regression of a large tumor present in the “Regressor” R3 mouse after 3 and 6 weeks of TMX exposure. Visible lesions are outlined. Tumor volumes are indicated. ND: not detectable.
(D) Representative low (left, scale bar represents 1000 μm) and high (middle and right, scale bar represents 100 μm) magnification images of H&E and anti-cytokeratin19 (CK19) staining of sections of the pancreata of control KPeFC;Egfr+/+;Raf1+/+ (C1) and “Regressor” KPeFC;Egfrlox/lox;Raf1lox/lox (R1, R3-R6) mice after TMX exposure. The tumor present in the control C1 mouse is outlined by a dotted line. Box insets mark the areas shown at higher magnification in the right columns.
(E) Representative images of H&E, anti-EGFR, anti-pERK and anti-Ki67 stained sections from control KPeFC;Egfr+/+;Raf1+/+ (C1) and “Regressor” KPeFC;Egfrlox/lox;Raf1lox/lox (R1, R3-R6) mice. Scale bar represents 20 μm. No scar lesions were observed in “Regressor” mouse R2.
(F) Representative IHC staining of Cleaved Caspase 3 of sections of a pancreatic tumor (“Regressor”) from a KPeFC;Egfrlox/lox;Raf1lox/lox mouse that decreased 30% in volume after two weeks of TMX exposure and of tumors (“Non Responder”) from two independent KPeFC;Egfrlox/lox;Raf1lox/lox mice that continued growing during the same period of time. Scale bar represents 20 μm.
Tumor regression appeared to be mediated by apoptotic cell death. Immunohistochemical analysis of a tumor that regressed around 30% during the first two weeks of TMX exposure (“Regressor”) revealed a 7% of cleaved Caspase 3 expression (Figure 3F). In contrast, tumors of two independent mice that continued growing during the same period of time (“Non Responder”) only displayed a 0.5% of cleaved Caspase 3 expression (Figure 3F).
Finally, the pancreata of these “Regressor” mice contained low-grade PanINs (3 to 10 per mouse) including the R2 mouse in which the original PDAC had completely disappeared. Most of these lesions expressed EGFR (Figure S3C). Whether these PanINs are derived from cells that were not able to progress or represent late events during the course of the study, remains to be determined.
PDAC tumors “Resistant” to combined ablation of Egfr and Raf1
Tumors present in two mice that initially regressed with kinetics similar to those of the “Regressor” mice, started to grow rapidly after 6 to 8 weeks of TMX exposure killing them 4 to 5 weeks later (Figure 4A). Western blot analysis of tumor tissue revealed the absence of EGFR and c-RAF, indicating that tumor progression was not due to incomplete recombination of the conditional Egfr and/or Raf1 alleles (Figure 4B). Therefore, we have designated these mice as “Resistant” (T). Whether tumor progression was due to the acquisition of new mutations or to the emergence of clones that did not require EGFR and c-RAF signaling, remains to be determined. Indeed, the tumor present in the T2 “Resistant” mouse had a distinct sarcomatoid phenotype as illustrated by the lack of expression of CK19 and pERK (Figure 4C).
Figure 4. PDAC tumors of KPeFC mice resistant to Egfr and Raf1 ablation.
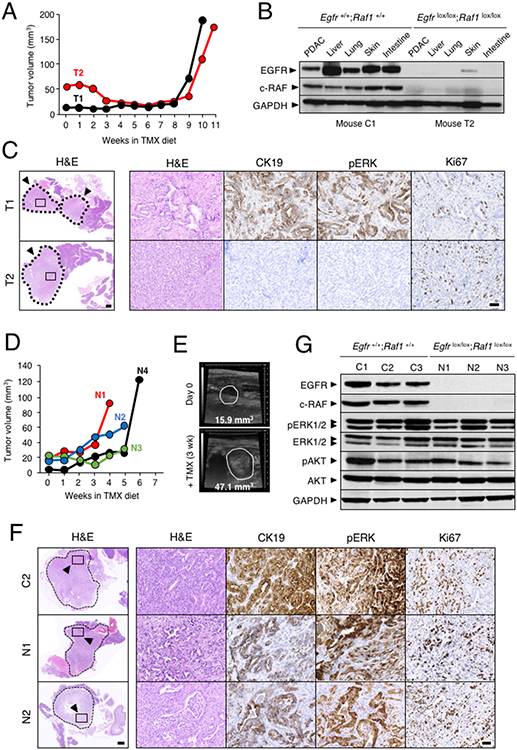
(A) Tumor volume visualized by weakly ultrasound imaging of KPeFC;Egfrlox/lox;Raf1lox/lox mice exposed to TMX. Each colour represents a different mouse. Mice were sacrificed at humane end point due to tumor burden at the last time point indicated in the graph. T1 and T2 identify “Resistant” mice analyzed in panels B and C (see below)
(B) Western blot analysis of EGFR and c-RAF expression in lysates derived from PDAC present in KPeFC;Egfr+/+;Raf1+/+control C1 mouse depicted in Figure 3A and KPeFC;Egfrlox/lox;Raf1 lox/lox T2 mouse exposed to TMX for 11 weeks. GAPDH served as a loading control.
(C) Representative H&E stained paraffin sections of the pancreata of KPeFC;Egfrlox/lox;Raf1lox/lox T1 and T2 mice after 10 and 11 weeks of TMX exposure, respectively. Tumors are outlined by a dotted line. Scale bar represents 1000 μm. Box insets mark areas shown at higher magnification in the adjacent images shown to the right stained for H&E, CK19, pERK and Ki67. Scale bar represents 50 μm.
(D) Tumor volume visualized by weakly ultrasound imaging of KPeFC;Egfrlox/lox;Raf1lox/lox mice (n=4 mice, 4 tumors) exposed to a TMX diet for the indicated time. Each color represents a different mouse. Mice were sacrificed at humane end point due to tumor burden at the last time point indicated in the graph. N1 to N4 identify “Non Responder” mice analyzed in panels E to F (see below)
(E) Representative ultrasound images of the progression of the tumor present in the “Non Responder” N2 mouse after 3 weeks of TMX exposure. Visible lesions are outlined. Tumor volumes are indicated.
(F) Representative H&E stained paraffin sections of the pancreata of control C2 KPeFC;Egfr+/+;Raf1+/+ mouse (depicted in Figure 3A) and of “Non Responder” N1 and N2 KPeFC;Egfrlox/lox;Raf1lox/lox mice after four and five weeks of TMX exposure, respectively. Tumors are outlined by dotted lines. Scale bar represents 1000 μm. Box insets mark areas shown at higher magnification in the adjacent images shown to the right. stained for H&E, CK19, pERK and Ki67. Scale bar represents 50 μm.
(G) Western blot analysis of EGFR and c-RAF expression in lysates obtained from PDAC present in control KPeFC;Egfr+/+;Raf1+/+ mice depicted in Figure 3A (C1-C3) and in “Non Responder” N1-N3 KPeFC;Egfrlox/lox;Raf1lox/lox mice exposed to TMX. Expression levels of pERK1/2, ERK1/2, pAKT and AKT are also shown. GAPDH served as a loading control.
Moreover, four KPeFC;Egfrlox/lox;Raf1lox/lox mice did not respond to the TMX diet. Tumors present in these animals, designated as “Non Responders” (N), progressed similarly to those present in control KPeFC mice (Figure 4D, 4E). Histopathological analyses did not reveal significant differences with tumors present in control animals or in KPeFC;Egfrlox/lox; Raf1lox/lox mice not exposed to TMX diet (Figure 4F). These tumors did not express EGFR or c-RAF, yet they retained active MAPK and PI3K/AKT signaling pathways (Figure 4G). Thus, we hypothesized that these tumors must have undergone additional alterations that made them independent of EGFR/c-RAF signaling. Alternatively, they may have originated from a putative distinct type of acinar cell that does not require these signaling pathways for proliferation.
Transcriptional differences between cells derived from “Regressor” and “Non Responder” pancreatic tumors
To gain insights into the mechanisms responsible for the differential responses of these PDAC tumors to EGFR and c-RAF ablation, we generated tumor cell lines from 15 KPeF;Egfrlox/lox;Raf1lox/lox mice that were not enrolled in the preclinical trial because they lacked the UBC-CreERT2 transgene. Elimination of EGFR and c-RAF expression upon infection with AdCre particles led to apoptotic cell dead, as determined by cell cycle analysis, in 4 of these 15 cell lines designated as “Regressors”, RC. In contrast, other cell lines (4 out of 15) were completely resistant to cell death. They were designated as “Non Responder” cells, NC. The results obtained with 3 RC and 3 NC cell lines are illustrated in Figure 5A and 5B. The remaining seven cells lines displayed a mixed phenotype with various percentages of cells undergoing cell death upon AdCre infection. Thus, suggesting the existence of intratumoral heterogeneity in these experimental tumors (McGranahan and Swanton, 2017).
Figure 5. Differential proliferative properties of PDAC cells lines upon ablation of EGFR and c-RAF expression.
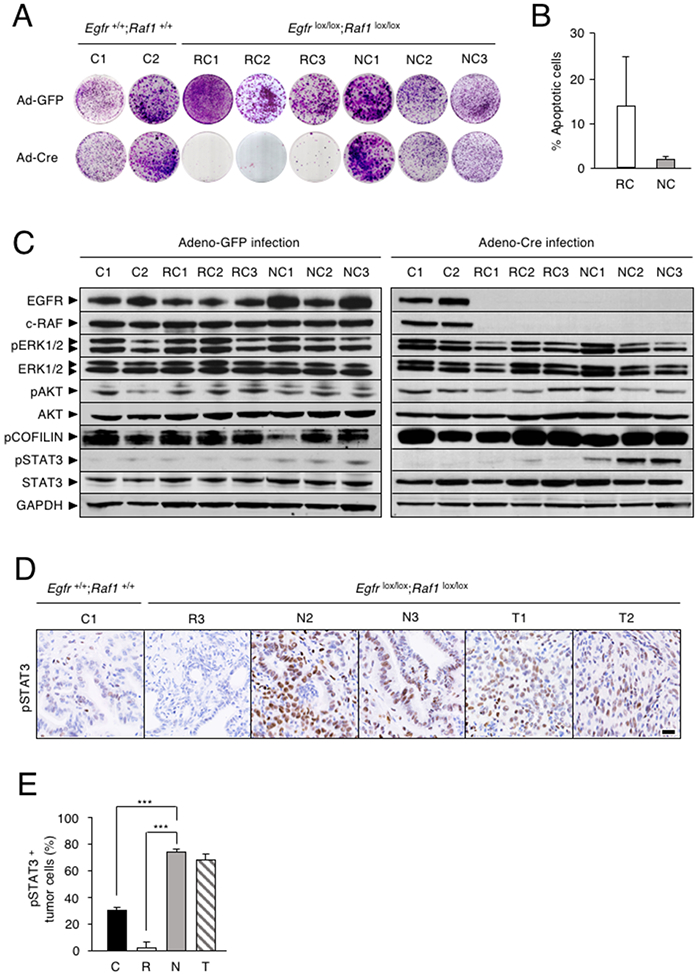
(A) Colony formation assay of tumor cell lines established from individual PDACs of two KPeFC;Egfr+/+;Raf1+/+ control mice (C1 and C2) and of six KPeFC;Egfrlox/lox;Raf1lox/lox animals, 3 “Regressor cells” (RC1-RC3) and 3 “Non responder” cells (NC1-NC3).
(B) Percentage of apoptotic cells (subG1 phase) at 96 hr after AdCre infection in (open bar) RC and (gray bar) NC cell lines (n=3). Error bars indicate mean ± SD.
(C) Western blot analysis of EGFR, c-RAF, pERK1/2, ERK1/2, pAKT, AKT, pCOFILIN, pSTAT3 and STAT3 protein expression in whole cell extracts of the indicated cell lines obtained 5 days after AdGFP or AdCre infection. GAPDH served as a loading control.
(D) pSTAT3 IHC in PDAC sections of KPeFC;Egfr+/+;Raf1+/+ (C1) mouse and KPeFC;Egfrlox/lox;Raf1lox/lox mice that harbored tumors that regressed (R3), progressed (N1, N3) or relapsed (T1, T2) upon Egfr and Raf1 ablation. Scale bar represents 20 μm.
(E) Quantification of pSTAT3 positive tumor cells in PDAC sections from control KPeFC;Egfr+/+;Raf1+/+ (C, solid bar, n=3), “Regressor” KPeFC;Egfrlox/lox;Raf1lox/lox (R, open bar, n=3). “Non Responder” KPeFC;Egfrlox/lox;Raf1lox/lox (N, grey bar, n=3) and “Resistant” KPeFC;Egfrlox/lox;Raf1lox/lox (T, striped bar, n=2) mice. Error bars indicate standard deviation. p values were calculated using the unpaired Student’s t test. ***p < 0.001.
Analysis of known K-RAS effectors in NC and RC cells failed to demonstrate significant differences in the phosphorylation levels of the ERK and AKT kinases as well as in pCOFILIN (Figure 5C), suggesting that the MAPK, PI3K and ROCK1 pathways might not be responsible for the proliferation of NC cells in the absence of EGFR and c-RAF expression. Interestingly, ablation of EGFR and c-RAF expression in NC cells induced increased phosphorylation of STAT3 at the canonical Tyr705 residue (Figure 5C). These observations were further substantiated by IHC analysis (Figure 5D, 5E). Tumors present in “Non Responder” mice as well as in mice that became resistant to Egfr and Raf1 ablation, constitutively expressed high levels of nuclear pSTAT3 (Figure 5D, 5E). No increase in pSTAT3 expression was observed in control KPeFC tumors or in those few ductal-like cells present in the residual scars of “Regressor” mice (Figure 5D, 5E).
Next, we determined the transcriptional profiles by RNAseq analysis of three RC cell lines and three NC cell lines. As illustrated in Figure 6A, RC and NC cells displayed distinct transcriptional profiles that included more than two thousand differentially expressed genes (Table S2).
Figure 6. Differential transcriptional profiles of PDAC cells sensitive and resistant to Egfr and Raf1 ablation.
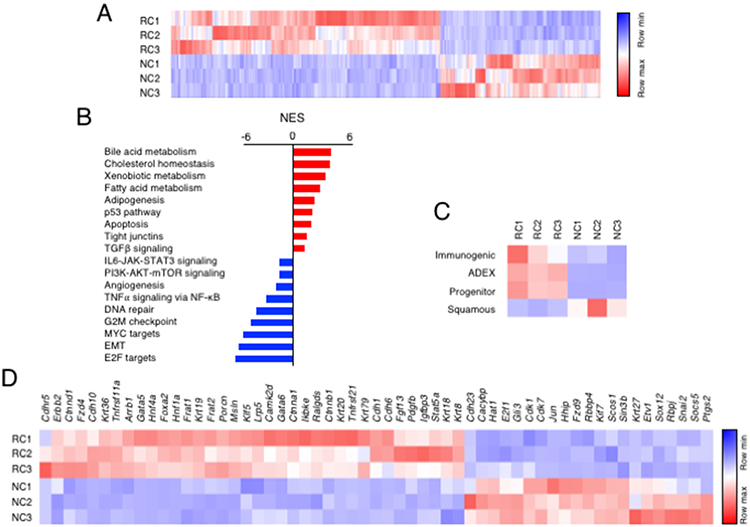
(A) Heatmap representing color-coded expression levels of differentially expressed genes in “Regressor” (RC) vs “Non Responder” (NC) cells infected with AdGFP particles.
(B) GSEA pathway analysis of RC vs NC cells. Pathways enriched in “Regressor” RC (red bars) and “Non Responder” NC (blue bars) cells are indicated. The normalized enrichment score (NES) ranking was generated by the GSEA.
(C) Heatmap comparing the transcriptional profiles of RC and NC cells with those of human PDAC (Bailey et al., 2016).
(D) Genes selected from the two thousand genes differentially expressed between RC and NC cells based on their involvement in signaling pathways known to participate in the development and/or progression of PDAC. Genes are ordered according to the log2 fold change.
See also Table S2.
Gene Set Enrichment Analysis (GSEA) (Liberzon et al., 2015) identified several pathways enriched in RC vs NC cells (Figure 6B). The most significantly enriched gene signatures in RC cells included those corresponding to “bile acid, cholesterol, xenobiotic and fatty acid metabolism”, “apoptosis” and “p53 pathway” (Figure 6B). Significantly enriched gene sets in the NC cells were those corresponding to “E2F targets”, “EMT” and “MYC targets”. Other enriched pathways included the “PI3K/AKT/mTOR” and “IL6/JAK/STAT3” signaling pathways (Figure 6B). Comparison of data obtained by RNAseq analysis with a transcriptional classification of human PDACs (Bailey et al., 2016), revealed that NC cells displayed a transcriptional profile most similar to the “squamous subtype”. In contrast, RC cells fit best with the other classifications, “Immunogenic”, “ADEX” and “Progenitor” (Bailey et al., 2016) (Figure 6C). A list of 57 genes selected from pathways known to play relevant roles in PDAC development and progression is highlighted in Figure 6D.
EGFR and c-RAF are essential for proliferation of patient-derived pancreatic tumor xenografts (PDX)
To determine whether combined inhibition of EGFR and c-RAF signaling could provide therapeutic benefit to PDAC patients, we knocked down their expression in cells derived from nine PDX tumor models harboring KRAS and TP53 mutations (Table S3). A tenth PDX tumor model (PDX-10) carrying a wild-type TP53 was also included in the study. Individual knockdown of EGFR or c-RAF expression with two independent shRNAs for each locus reduced their proliferative properties to various extents. However, combined knockdown of EGFR and c-RAF expression completely interfered with the proliferative capacity of those cell derived from nine out of the ten PDX tumor models (Figure S4). Only those cells derived from PDX-6 were partially inhibited upon EGFR or c-RAF knockdown. Four of the PDX-derived tumor cells that fully responded to EGFR or c-RAF knockdown (PDX-1 to 4) were injected into immunocompromised mice. Again, only the combined knockdown of EGFR and c-RAF effectively inhibited growth of these human PDAC tumor cells in vivo (Figure 7). These observations suggest that combined inhibition of EGFR and c-RAF expression may have significant therapeutic activity in human PDAC tumors.
Figure 7. EGFR and c-RAF expression are required for proliferation of cells derived from PDX tumor models.
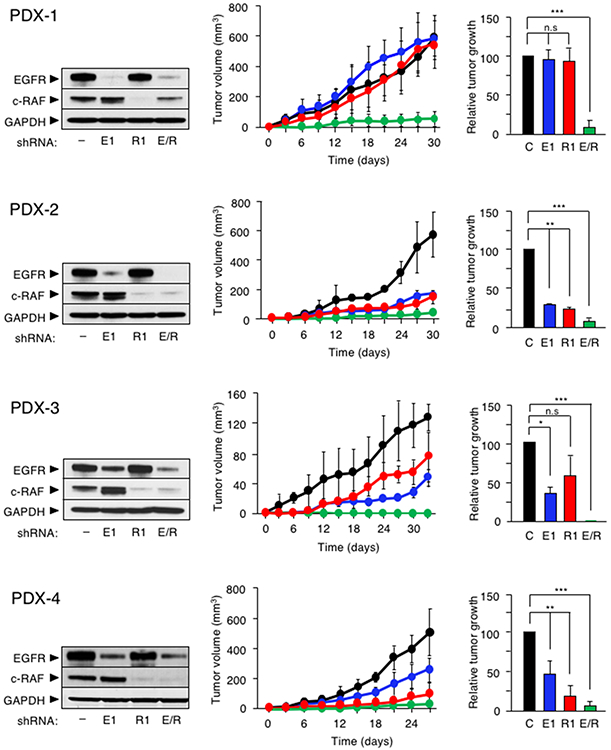
Western blot analysis of EGFR and c-RAF protein expression in whole cell extracts obtained from (left), tumor growth curve (center), and quantification of tumor growth at the end of the experiment (right) of the indicated PDX cell line infected with a scramble shRNA (–, black) or with shRNAs against EGFR (E1, blue), c-RAF (R1, red) and EGFR plus c-RAF (E/R, green). GAPDH served as a loading control. Error bars indicate mean ± SD. p values were calculated using the unpaired Student’s t test. *p < 0.05, **p < 0.01, ***p < 0.001. n.s: no significant.
Finally, we determined whether pharmacological inhibition of the kinase activities of EGFR and c-RAF led to similar results. Unfortunately, none of three different c-RAF kinase inhibitors (MLN2480, GW5074 and PLX8394) displayed significant inhibitory activity in various in vitro and in vivo assays (Sanclemente et al., 2018). Thus, we had to inhibit c-RAF by knocking down its expression with specific shRNAs as described above. To block EGFR activity, we used two independent inhibitors, Gefitinib and Erlotinib (Burotto et al., 2015; Lim et al., 2014). Exposure of cells derived from the ten independent PDX tumors described above to Gefitinib at IC50 concentrations determined in short term cultures (Table S4) along with the two independent c-RAF shRNAS resulted in the complete inhibition of their proliferations, including those cells derived from the PDX-6 tumor model that were partially resistant to EGFR and c-RAF knockdown (Figure 8). Moreover, cells derived from 7 out of 10 PDX tumor models underwent cell death resulting in a reduced number of cells at the end of the 12-day experiment (Figure 8). Similar results were obtained with Erlotinib, except for PDX-3 and PDX-6-derived cells that only displayed partial inhibition (Figure 8). These results, taken together, suggest that pharmacological intervention may also result in significant inhibition of human PDAC tumors in the clinic.
Figure 8. Pharmacologic inhibition of EGFR in combination with c-RAF knockdown inhibits proliferation of PDAC cells derived from PDX tumor models.
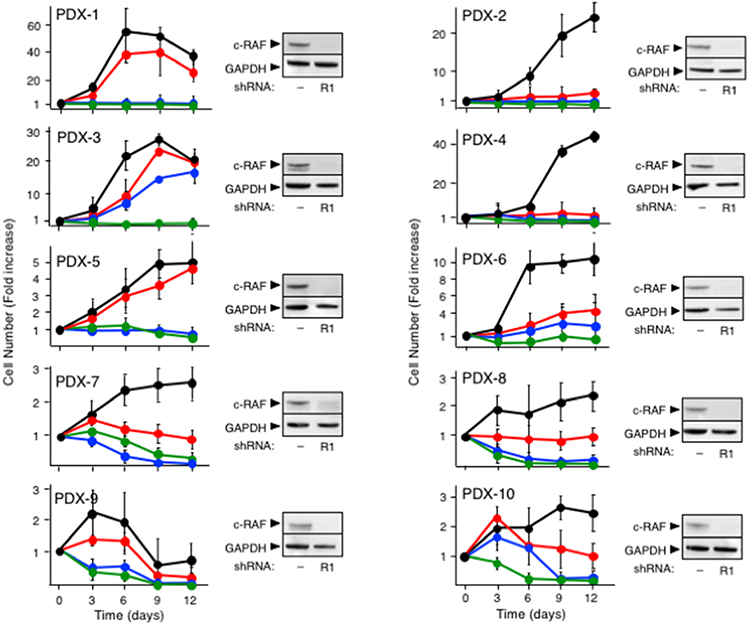
Cell proliferation of the indicated PDX-derived cells infected with scramble shRNA (black), infected with shRNA R1 against c-RAF (red), infected with shRNA R1 against c-RAF and exposed to Gefitinib (IC50) (green), infected with shRNA R1 against c-RAF and exposed to Erlotinib (IC50) (blue) (left) and Western blot analysis of c-RAF expression in whole cell extracts obtained from the indicated PDX-derived cells using either a scramble shRNA (−) or a shRNAs against c-RAF (R1) (right). Proliferation was determined by CellTiter-Glo and expressed as fold increase in the number of cells determined at each of the indicated days. Error bars indicate mean ± SD. GAPDH served as loading control in Western blot.
See also Table S4.
DISCUSSION
Strategies used to treat PDAC in the clinic have achieved very limited benefit. Likewise, experimental therapeutic strategies in GEM PDAC models have only resulted in modest tumor delays (Chio et al., 2016; Kamerkar et al., 2017; Todoric et al., 2017). Only genetic tampering with oncogenic K-Ras mutant expression in mice has led to significant levels of tumor regression (Collins et al., 2012; Ying et al., 2012). In this study, we demonstrate that combined inhibition of EGFR and c-RAF expression is a very effective therapy against PDAC, both in mutant Kras/Trp53-driven GEM tumor models as well as in human PDXs. Of equal relevance for future application of these observations to a clinical scenario is the fact that systemic elimination of these targets results in tolerable toxicities, primarily resulting from the lack of EGFR activity. These observations are likely to be a consequence of the unexpected lack of effect of Egfr and Raf1 ablation on the MAPK cascade, a signaling pathway essential for normal homeostasis (Blasco et al., 2011). Human PDACs are genetically more complex than those of GEM tumor models (Chung et al., 2017; Jones et al., 2008). Yet, the inhibitory effect of EGFR and c-RAF knockdown in nine out of ten independent PDX tumor models illustrates that this therapeutic strategy may also have profound effects in the clinic. It is somewhat surprising that human PDX-derived tumor cells are more sensitive than the corresponding mouse tumors in spite of their more complex mutational profile. Whether the higher sensitivity of the human PDX tumors to EGFR and c-RAF inhibition is a consequence of the lack of desmoplastic tissue and/or their experimental manipulation via passage in immunocompromised mice remains to be determined.
Replacement of EGFR ablation by pharmacological inhibition of EGFR kinase activity yielded similar results. Unfortunately, inhibition of c-RAF activity may represent a bigger challenge since currently available panRAF inhibitors will affect the MAPK pathway and hence elicit unacceptable toxicities such as those already observed in the clinic with MEK inhibitors. Moreover, we have been unable to reproduce the results obtained upon c-RAF knockdown with c-RAF kinase inhibitors. Preliminary results using conditional Raf1 kinase alleles in our lung “therapeutic model” suggests that the therapeutic effect observed upon loss of c-RAF expression may not be mediated by its kinase activity (unpublished observation). Therefore, the potential application of our results to a clinical scenario may require sophisticated medicinal chemistry strategies to either block c-RAF kinase independent activities or induce its degradation.
Detailed analysis of the genomic landscapes of human PDACs beyond the known driver mutations has failed to outline meaningful stratifications that could be correlated with clinical outcome (Witkiewicz et al., 2015). Only transcriptional studies have been able to define the existence of distinct PDAC subtypes (Bailey et al., 2016; Collisson et al., 2011; Moffitt et al., 2015; Mueller et al., 2018; Raphael et al., 2017). GEM PDAC tumors also exhibit distinct transcriptional signatures. Interestingly, the “Non Responder” tumors displayed a transcriptional pattern similar to the “squamous” signature of human PDACs characterized by worse prognosis (Bailey et al., 2016). In contrast, the transcriptional profile of “Regressor” tumors is more similar to the other subtypes (Bailey et al., 2016). More importantly, these GEM tumors display drastically different responses to a therapeutic regiment based on Egfr and Raf1 ablation. Recent studies carried out with human PDAC organoids have also described a correlation between their transcriptional profiles and their response to cytotoxic compounds (Tiriac et al., 2018). Whether such correlation would exist using selected inhibitors against those targets identified here remains to be determined. A deeper understanding of the molecular mechanisms responsible for the lack of response of certain GEM tumors of EGFR and c-RAF inhibition should serve to identify additional therapeutic targets that will increase the limited armamentarium available to fight pancreatic cancer.
STAR METHODS
CONTACT FOR REAGENT AND RESOURCE SHARING
Further information and requests for resources and reagents should be directed to and will be fulfilled by the Lead Contact, Carmen Guerra (mcguerra@cnio.es).
EXPERIMENTAL MODEL AND SUBJECT DETAILS
Mice
Elas-tTA/TetO-Cre;Kras+/LSLG12Vgeo, Trp53lox/lox, Egfrlox/lox, Raf1lox/lox, Kras+/FSFG12V, Trp53frt/frt, Tg.UBC-CreERT2 and Rosa26+/tm1.3(CAG-tdTomato,-EGFP)Pjen/J strains have been previously described (Guerra et al., 2007; Jesenberger et al., 2001; Jonkers et al., 2001; Lee et al., 2012; Natarajan et al., 2007; Nieto et al., 2017; Plummer et al., 2015; Ruzankina et al., 2007). The Cdk4K35M/K35M strain was obtained by a Cre-dependent FLEx switch strategy that replaced expression of the wild-type CDK4 protein by a CDK4K35M kinase dead isoform (Schnütgen et al., 2003) (Schnütgen et al., 2003). The transgenic TetO-FlpO strain was generated by pronuclear injection of CMV-TetO-FlpO DNA into B6.CBA zygotes (Pease and Saunders, 2011). All mice were maintained in a mixed 129/Sv-C57BL/6 background. Immunodeficient NU-Foxn1nu mice (females, 5-weeks-old) were purchased from Harlan Laboratories. All animal experiments were approved by the Ethical Committees of the Spanish National Cancer Research Centre (CNIO) and they were performed in accordance with the guidelines stated in the International Guiding Principles for Biomedical Research Involving Animal, developed by the Council for International Organizations of Medical Sciences (CIOMS). All strains were genotyped by Transnetyx (Cordova, Tennessee, USA).
Mouse PDAC cell cultures
To generate mouse PDAC explants, freshly isolated tumors were minced with sterile razor blades, digested with collagenase P (1.5 μg/ml) in Hank’s Balanced Salt Solution (HBSS) for 30 min at 37° C, and cultured in DMEM with 10% of fetal bovine serum (FBS) and 1% Penicillin/Streptomycin. All studies were done on cells maintained in culture for less than ten passages. Their corresponding genotypes were verified by PCR analysis. PDAC cells explants were infected with AdCre particles (multiplicity of infection, 100) and seeded for colony formation assay 5 days after. AdGFP particles were used as negative controls. Cells (5×10³) were seeded and allowed to form colonies for 2 weeks. Plates were fixed with 0.1% glutaraldehyde (Sigma) and stained with 0.5% Crystal Violet (Merck). Colonies were counted and quantified.
PDX tumor models
PDX tumors models were used include Panc-1, Panc-2, Panc-4, Panc-185, Panc-198, H-PDAC-H-X132, H-PDAC-M-X3 and H-PDAC-M-X7 (Table S3). Panc-1, Panc-2, and Panc-4 were obtained from patients who underwent surgical resection at the Koç University Hospital, Istanbul, Turkey with approval by the Ethical Committee (CEI 60-1057-A068). Panc-185, Panc-198, H-PDAC-H-X132 were obtained from Hospital HM Sanchinaro, Madrid, Spain, with approval by the Ethical Committee (CEIC HM Hospitales, FHM.06.10). H-PDAC-M-X3 and H-PDAC-M-X7 were obtained from the Hospital Virgen de la Arrixaca, Murcia, Spain, with approval by the Ethical Committee (CEIC HCUVA-2013/01). Specific informed consent for PDX model generation was obtained from all patients. PDAC003T and PDAC013T tumor models have been already described (Nicolle et al., 2017).
PDX knockdown assays
Cells derived from these PDX tumor models were infected with lentiviral supernatants expressing shRNAs against EGFR (E1, TRCN0000121203 and E2, TRCN0000121206), c-RAF (R1, TRCN0000001065 and R2, TRCN0000001068). The E1, E2 and R2 shRNAs were cloned in a plasmid that carries a Puromycin resistant cassette. Instead, the R1 shRNA was cloned in a plasmid that conferred Blasticidine resistance. A scrambled shRNA control vector was used as a negative control. Infected PDX cells were seeded in 96-well plates at a density of 1,500 cells per well and proliferation was assessed using the MTT assay. For in vivo studies, infected cells (0.5x10⁶) derived from PDAC003T, PDAC013T, Panc-1 and Panc-4 tumor models were injected 1:1 in PBS:Matrigel Matrix (Corning, 354234) into dorsal flanks of immunodeficient mice. Tumor growth was measured every 3 days with a caliper and calculated as Length x Width2/2 until humane end point.
METHODS DETAILS
Mouse treatments and tumor monitorization
Tumors were measured with a micro-ultrasound system (Vevo 770, Visualsonics) with an ultrasound transducer of 40 MHz (RMV704, Visualsonics). To this end, mice were anesthetized with a continuous flow of 1% to 3% isoflurane in 100% oxygen at a rate of 1.5 liter/min. Hypothermia associated with anesthesia was avoided using a bed-heater. Abdominal hair was removed by depilation cream to prepare the examination area. Tumor size was calculated as Length x Width2/2. Recombination of the Egfrlox and Raf1lox conditional alleles was mediated by activation of the inducible CreERT2 recombinase with TMX. To this end, mice were fed with a TMX-containing diet (Teklad CRD TAM400 diet, Harlan) ad libitum. Control mice carrying the corresponding wild-type alleles were also fed with the same diet.
Histopathology and immunohistochemistry
For routine histological analysis, specimens were fixed in 10% buffered formalin (Sigma) and embedded in paraffin. For histopathological analysis, tissues were serially sectioned (3μm thick) and stained by conventional H&E every ten sections. Antibodies used for immunostaining included those raised against CK19 (CNIO Monoclonal Antibodies Core Unit), cleaved Caspase-3 (Cell Signaling Technology, 9661), CD3 (Santa Cruz Biotechnology, M-20), EGFR (Abcam, ab52894), pERK (Cell Signaling Technology, 9101), F4/80 (ABD Serotec, CI: A3-1), Ki67 (Master Diagnostica, 0003110QD), HABP (Millipore, 385911) and pSTAT3 (Cell Signaling Technology; 9145). Stained slides were scanned using the Mirax scanner (Zeiss). Images were analyzed by Zen2 software and photos were exported using Zen2 software (Zeiss).
Next generation sequencing
Genomic DNA obtained from 11 paired tumor and tail tissue was enriched in protein-coding sequences using the SureSelect Mouse All Exon kit (Agilent Technologies). The resulting target-enriched pool was amplified and subjected to paired-end sequencing (2 × 100 bp) using HiSeq2000 sequencing instruments at the Beijing Genomics Institute (BGI). Sequencing reads were mapped to the reference genome (mm9) using the Burrows–Wheeler Aligner (BWA) (Li and Durbin, 2010) alignment tool version 0.5.9. Sites that differed from the reference genome (variants) were identified and empirical priors were constructed for the distribution of variant frequencies in each sample independently. High-credibility intervals (posterior probability ≥ 1 – 1e-5) were obtained for the observed frequency of the variants using the statistical algorithm for variant identification (SAVI) algorithm (Trifonov et al., 2013). Variants were considered absent if their allele frequency was <2% and present if detected with an allele frequency above 15%, corresponding with the sensitivity threshold of direct Sanger sequencing. Variant total depth was also required to be >10x and <300x. Variants were excluded if present in mouse dbSNP database, detected in any of the normal samples, or observed in only one strand. Finally, candidate protein altering somatic variants (nonsense, missense, and small insertions and deletions) were identified when variants were absent in the normal and present in the tumor with at least 1% change in frequency from normal with high posterior probability (≥ 1 – 1e-5).
Western blot analysis
Protein extracts (25 μg) obtained from tumor tissue or cell lines were separated on SDS/PAGE gels (ThermoFisher Scientific), transferred to a nitrocellulose membrane and blotted with antibodies raised against EGFR (Abcam, ab52894), c-RAF (BD Biosciences, 610151), pERK1/2 (Cell Signaling, 9101), ERK1 (BD Biosciences 554100), ERK2 (BD Biosciences, 610103), pAKT (Cell Signaling, 4060), AKT (Cell Signaling, 9272), pSTAT3 (Cell Signaling, 9131), STAT3 (Cell Signaling, 9132), pCOFILIN (Santa Cruz, sc-21867-R) and GAPDH (Sigma, G8795). Primary antibodies were detected against mouse or rabbit IgGs (HRP, Dako and Alexa Fluor 680, Invitrogen) and visualized with ECL Western blot detection solution (GE Healthcare) or Odyssey infrared imaging system (LI-COR Biosciences).
X-Gal staining, laser capture microdissection and PCR analysis
X-Gal staining, laser capture microdissection and Egfr PCR analysis have been previously described (Navas et al., 2012). Raf1 wild-type, floxed and null alleles were identified with forward Raf1 1F (5´-CTGATTGCCCAACTGCCATAA-3´), Raf1 3F (5´-GAGTCAGCAAATGCACTGAAATG-3´) and reverse Raf1 1R (5´-ACTGATCTGGAGCACAGCAAT-3´) primers at 94°C for 1 minute, followed by 35 cycles of denaturation at 94°C for 30 seconds, annealing at 60°C for 30 seconds and extension at 72°C for 30s, and finally, followed by a long extension at 72°C for 10 minutes. These primers yielded DNA products of 196 bp, 270 bp and 143 bp for wild-type, floxed and null Raf1 alleles, respectively.
EGFP and tdTomato fluorescence imaging
Tissues were fixed overnight by immersion in 4% paraformaldehyde (PFA) in 0.01 M phosphate-buffered saline (PBS) at 4°C and rinsed in PBS before equilibration in 30% sucrose in PBS for 48 h at 4°C. Samples were thereafter included in O.C.T.™ compound (Sakura) and frozen. Cryosections of the samples were stained with Dapi for nuclei detection (ThermoFisher), mounted with Prolong Gold antifade reagent (ThermoFisher) and visualized with a TCS-SP5 laser scanning confocal microscope (Leica) equipped with AOBS and both 10X/0.4NA and 20X/0.7NA dry objectives. A z-stack was acquired and the maximum projection is shown.
Apoptosis Assay
After 96 hr of infection with AdCre particles cells were harvested by trypsinization and fixed with 70% (v/v) ethanol at 4°C overnight. Fixed cells were incubated in phosphate-buffered saline (PBS) containing 100 μg/ml RNase A for 30 minutes at 37°C, followed by staining with 0.003% of Propidium Iodide for 30 minutes on ice. Thereafter, cells were collected on a nylon mesh filter (pore size, 40 mm), and cell cycle was assayed by flow cytometry (FACSCalibur) at excitation of 488 nm and at emission of 585 nm, and analyzed using a FACSDiva Version 6.1.2 (BD Bioscience).
RNAseq and GSEA analysis
RNA from PDAC cell explants was extracted with Qiagen RNeasy Mini Kit. 1 μg of total RNA was used for further analysis. PolyA+ fraction was purified and randomly fragmented, converted to double stranded cDNA and processed through subsequent enzymatic treatments of end-repair, dA-tailing, and ligation to adapters as in Illumina's "TruSeq Stranded mRNA LT Sample Prep Kit". The adapter-ligated library was completed by PCR with Illumina PE primers. The resulting purified cDNA library was applied to an Illumina flow cell for cluster generation and sequenced on an Illumina NovaSeq 6000 instrument by following manufacturer's guidelines. 101 bp single-end reads were analyzed with the Nextpresso pipeline (Grana et al., 2017) as follows: sequencing quality was verified with FastQC v0.11.0 (http://www.bioinformatics.babraham.ac.uk/projects/fastqc/). Reads were aligned to the mouse genome (NCBI37/mm9) with TopHat-2.0.10 (Trapnell et al., 2012) using Bowtie 1.0.0 (Langmead et al., 2009) and SAMtools 0.1.19 (Li et al., 2009), allowing 2 mismatches and 20 multihits. Differential expression was tested with DESeq2 (Love et al., 2014) using the Mus musculus NCBI37/mm9 transcript annotations from https://ccb.jhu.edu/software/tophat/igenomes.shtml. GSEAPreranked (Subramanian et al., 2005) was used to perform a gene set enrichment analysis of the described gene signatures on a pre-ranked gene list, setting 1000 gene set permutations. Gene Set Variation Analysis (GSVA) (Hänzelmann et al., 2013), was used to estimate the variation of pathway activity over the samples in an unsupervised manner. Heatmaps presented in this study were built with GENE-E software package (https://software.broadinstitute.org/GENE-E/index.html).
IC50 Determinations
PDX cell lines were plated at 5,000 cells per well in triplicates in 96-well plates and grown for 24 hours. Cells were treated with a dilution series of Gefitinib (Cymit Química SL), Erlotinib (LC laboratories). Control cells were incubated with media containing DMSO. Cell viability was assessed with CellTiter Glo Luminescent Cell Viability Assay after 72 hours of treatment. Luminescence counts were read in a Victor Instrument (Perkin Elmer) with the recommended settings. To calculate the IC50, values were plotted against the inhibitor concentrations and fit to a sigmoid dose–response curve using GraphPad Software.
Gefitinib and Erlotinib treatment of PDX-derived cells
For pharmacologic studies PDX-derived cells were seeded in 96-well plates at 1,500 and 3,000 cells/well in triplicates, and incubated for 24 hours in DMEM media supplemented with 10% FBS, 2 mM L-glutamine, 50 U/ml penicillin and 50 μg/ml streptomycin (GIBCO-Invitrogen) before adding the IC50 of the corresponding IC50 concentration of inhibitor in DMSO. The same concentration of DMSO was used as a control. Cells were exposed to the corresponding inhibitor for 12 days, in the presence or absence of a c-RAF shRNA (R1) changing medium and drug every two days. Cell viability was assessed with CellTiter Glo Luminescent Cell Viability.
DATA AND SOFTWARE AVAILABILITY
Next generation sequencing data have been deposited in the Gene Expression Omnibus (GEO) database under the accession number GSE112434 as well as in the NCBI’s Sequence Read Archive (SRA) under a BioProject with the accession number PRJNA462276.
QUANTIFICATION AND STATISTICAL ANALYSIS
Data are represented as mean ± SD. Significance was calculated with the unpaired Student´s t test using GraphPad Prism software. A p value that was less than 0.05 was considered to be statistically significant for all data sets. Significant differences between experimental groups were: *p< 0.05, **p< 0.01 or *** p< 0.001.
Supplementary Material
Table S2. Differentially expressed genes between RC and NRC cells. Related to Figure 6.
ACKNOWLEDGEMENTS
We thank B. Jiménez, M. San Roman, R. Villar and S. Jiménez for excellent technical assistance; I. Aragón, A. López, F. Díaz and I. Blanco (Animal Facility) for mouse work; G. Visdomine, C. Peñalba and G. Garaulet (Molecular Imaging Unit) for ultrasound studies; P. Vargiu (Transgenic Unit) for help in generating the TetO-FlpO strain; N. Cabrera, A. de Martino (Histopathology Unit) and M. Morente (Tumor Bank) for histopathological analysis, and C. Blanco and A. Cebriá (Experimental Therapeutics) for determining the IC50s of Gefinitib and Erlotinib. Special thanks to J. de la Peña and E. Ortiz (Servicio de Anatomía Patológica HCUVA) and T. Escamez and V. Navarro (Biobanco-IMIM) for their help with the PDX tumor models, and to R. Nieto, J.M. Ligós and M. Montoya (Cytometry Unit, CNIC) for FACS analysis of apoptotic cells. This work was supported by grants from the European Research Council (Advanced Grants ERC-AG/250297-RAS AHEAD and ERC-AG/695566-THERACAN), from the Spanish Ministry of Economy and Competitiveness (SAF2014-59864-R) to M. Barbacid. Additional support was also obtained from grants from the Asociación Española contra el Cáncer (GC16173694BARB) to M. Barbacid and B. Sainz Jr., from La Ligue Contre le Cancer to J.Iovanna., from the European Research Council (Advanced Grants ERC-2014-ADG) to M. Hidalgo and from the National Institutes of Health (U54CA193313 and U54CA209997) to R. Rabadán. M.T. Blasco was supported by an FPU fellowship from the Spanish Ministry of Education. C. Navas was supported by a Juan de la Cierva Award. M. Djurec was partially supported by a pre-doctoral fellowship from La Caixa. J. Perales-Patón was supported by a Severo Ochoa FPI fellowship from the Spanish Ministry of Economy and Competitiveness. M. Barbacid is the recipient of an Endowed Chair from the AXA Research Fund.
Footnotes
DECLARATION OF INTERESTS
M.B. reports a research contract from Pfizer and Eli Lilly and paid consultancy from Amcure.
J.I. reports paid consultancy from Dynasio S.A. and Oncomedics, both in France.
M.H. reports research contracts and/or paid consultancy with Roche and Astra-Zeneca.
None of these relationships are related to the work reported in this manuscript.
We declare a patent application related to this work: EP18382555 Barbacid, M., Guerra C., Blasco, M.T., Navas, C. (2018). COMBINED THERAPY AGAINST CANCER.
REFERENCES
- Aguirre AJ, Nowak JA, Camarda ND, Moffitt RA, Ghazani AA, Hazar-Rethinam M, Raghavan S, Kim J, Brais LK, Ragon D, et al. (2018). Real-time genomic characterization of advanced pancreatic cancer to enable precision medicine. Cancer Discov. CD-18-0275 [DOI] [PMC free article] [PubMed] [Google Scholar]
- Ardito CM, Grüner BM, Takeuchi KK, Lubeseder-Martellato C, Teichmann N, Mazur PK, DelGiorno KE, Carpenter ES, Halbrook CJ, Hall JC, et al. (2012). EGF Receptor Is Required for KRAS-Induced Pancreatic Tumorigenesis. Cancer Cell 22, 304–317. [DOI] [PMC free article] [PubMed] [Google Scholar]
- Bailey P, Chang DK, Nones K, Johns AL, Patch A-M, Gingras M-C, Miller DK, Christ AN, Bruxner TJC, Quinn MC, et al. (2016). Genomic analyses identify molecular subtypes of pancreatic cancer. Nature 531, 47–52. [DOI] [PubMed] [Google Scholar]
- Biankin AV, Waddell N, Kassahn KS, Gingras M-C, Muthuswamy LB, Johns AL, Miller DK, Wilson PJ, Patch A-M, Wu J, et al. (2012). Pancreatic cancer genomes reveal aberrations in axon guidance pathway genes. Nature 491, 399–405. [DOI] [PMC free article] [PubMed] [Google Scholar]
- Blasco RB, Francoz S, Santamaría D, Cañamero M, Dubus P, Charron J, Baccarini M, and Barbacid M (2011). C-Raf, but Not B-Raf, Is Essential for Development of K-Ras Oncogene-Driven Non-Small Cell Lung Carcinoma. Cancer Cell 19, 652–663. [DOI] [PMC free article] [PubMed] [Google Scholar]
- Burris HA III, Moore MJ, Andersen J, Green MR, Rothenberg ML, Modiano MR, Cripps MC, Portenoy RK, Storniolo AM, Tarassoff P, et al. (1997). Improvements in Survival and Clinical Benefit With Gemcitabine as First-Line Therapy for Patients With Advanced Pancreas Cancer : A Randomized Trial. 15, 2403–2413. [DOI] [PubMed] [Google Scholar]
- Chio IIC, Jafarnejad SM, Ponz-Sarvise M, Park Y, Rivera K, Palm W, Wilson J, Sangar V, Hao Y, Öhlund D, et al. (2016). NRF2 Promotes Tumor Maintenance by Modulating mRNA Translation in Pancreatic Cancer. Cell 166, 963–976. [DOI] [PMC free article] [PubMed] [Google Scholar]
- Chung W-J, Daemen A, Cheng JH, Long JE, Cooper JE, Wang B-E, Tran C, Singh M, Gnad F, Modrusan Z, et al. (2017). Krasmutant genetically engineered mouse models of human cancers are genomically heterogeneous. Proc. Natl. Acad. Sci. U. S. A 114, E10947–E10955. [DOI] [PMC free article] [PubMed] [Google Scholar]
- Collins MA, Bednar F, Zhang Y, Brisset J, Galbán S, Galbán CJ, Rakshit S, Flannagan KS, Adsay NV, Pasca di Magliano M, et al. (2012). Oncogenic Kras is required for both the initiation and maintenance of pancreatic cancer in mice. J. Clin. Invest 122, 639–653. [DOI] [PMC free article] [PubMed] [Google Scholar]
- Collisson EA, Sadanandam A, Olson P, Gibb WJ, Truitt M, Gu S, Cooc J, Weinkle J, Kim GE, Jakkula L, et al. (2011). Subtypes of pancreatic ductal adenocarcinoma and their differing responses to therapy. Nat. Med 17, 500–503. [DOI] [PMC free article] [PubMed] [Google Scholar]
- Drosten M, Guerra C, and Barbacid M (2017). Genetically Engineered Mouse Models of K-Ras-Driven Lung and Pancreatic Tumors: Validation of Therapeutic Targets. Cold Spring Harb. Perspect. Med a031542. [DOI] [PMC free article] [PubMed] [Google Scholar]
- Franzke C-W, Cobzaru C, Triantafyllopoulou A, Löffek S, Horiuchi K, Threadgill DW, Kurz T, van Rooijen N, Bruckner-Tuderman L, and Blobel CP (2012). Epidermal ADAM17 maintains the skin barrier by regulating EGFR ligand–dependent terminal keratinocyte differentiation. J. Exp. Med 209, 1105–1119. [DOI] [PMC free article] [PubMed] [Google Scholar]
- Garrido-Laguna I, and Hidalgo M (2015). Pancreatic cancer: from state-of-the-art treatments to promising novel therapies. Nat. Rev. Clin. Oncol 12, 319–334. [DOI] [PubMed] [Google Scholar]
- Gewirtz DA, Bristol ML, and Yalowich JC (2010). Toxicity issues in cancer drug development. Curr Opin Investig Drugs 11, 612–614. [PubMed] [Google Scholar]
- Grana O, Rubio-Camarillo M, Fdez-Riverola F, Pisano DG, and Glez-Pena D (2017). Nextpresso: Next Generation Sequencing Expression Analysis Pipeline. Curr. Bioinform 12. [Google Scholar]
- Guerra C, Mijimolle N, Dhawahir A, Dubus P, Barradas M, Serrano M, Campuzano V, and Barbacid M (2003). Tumor induction by an endogenous K-ras oncogene is highly dependent on cellular context. Cancer Cell 4, 111–120. [DOI] [PubMed] [Google Scholar]
- Guerra C, Schuhmacher AJ, Cañamero M, Grippo PJ, Verdaguer L, Pérez-Gallego L, Dubus P, Sandgren EP, and Barbacid M (2007). Chronic Pancreatitis Is Essential for Induction of Pancreatic Ductal Adenocarcinoma by K-Ras Oncogenes in Adult Mice. Cancer Cell 11, 291–302. [DOI] [PubMed] [Google Scholar]
- Guerra C, Collado M, Navas C, Schuhmacher AJ, Hernández-Porras I, Cañamero M, Rodriguez-Justo M, Serrano M, and Barbacid M (2011). Pancreatitis-induced inflammation contributes to pancreatic cancer by inhibiting oncogene-induced senescence. Cancer Cell 19, 728–739. [DOI] [PMC free article] [PubMed] [Google Scholar]
- Hänzelmann S, Castelo R, and Guinney J (2013). GSVA: Gene set variation analysis for microarray and RNA-Seq data. BMC Bioinformatics 14, 1–20. [DOI] [PMC free article] [PubMed] [Google Scholar]
- Hidalgo M (2010). Pancreatic Cancer. N. Engl. J. Med 362, 1605–1617. [DOI] [PubMed] [Google Scholar]
- Hingorani SR, Petricoin EF, Maitra A, Rajapakse V, King C, Jacobetz MA, Ross S, Conrads TP, Veenstra TD, Hitt BA, et al. (2003). Preinvasive and invasive ductal pancreatic cancer and its early detection in the mouse. Cancer Cell 4, 437–450. [DOI] [PubMed] [Google Scholar]
- Hingorani SR, Wang L, Multani AS, Combs C, Deramaudt TB, Hruban RH, Rustgi AK, Chang S, and Tuveson DA (2005). Trp53R172H and KrasG12D cooperate to promote chromosomal instability and widely metastatic pancreatic ductal adenocarcinoma in mice. Cancer Cell 7, 469–483. [DOI] [PubMed] [Google Scholar]
- Von Hoff DD, Ervin T, Arena FP, Chiorean EG, Infante J, Moore M, Seay T, Tjulandin SA, Ma WW, Saleh MN, et al. (2013). Increased survival in pancreatic cancer with nab-paclitaxel plus gemcitabine. N. Engl. J. Med 369, 1691–1703. [DOI] [PMC free article] [PubMed] [Google Scholar]
- Hwang TJ, Carpenter D, Lauffenburger JC, Wang B, Franklin JM, and Kesselheim AS (2016). Failure of investigational drugs in late-stage clinical development and publication of trial results. JAMA Intern. Med 176, 1826–1833. [DOI] [PubMed] [Google Scholar]
- Jesenberger V, Procyk KJ, Rüth J, Schreiber M, Theussl HC, Wagner EF, and Baccarini M (2001). Protective role of Raf-1 in Salmonella-induced macrophage apoptosis. J. Exp. Med 193, 353–364. [DOI] [PMC free article] [PubMed] [Google Scholar]
- Jones S, Zhang X, Parsons DW, Lin JC-H, Leary RJ, Angenendt P, Mankoo P, Carter H, Kamiyama H, Jimeno A, et al. (2008). Core Signaling Pathways in Human Pancreatic Cancers Revealed by Global Genomic Analyses. Science (80-. ) 321, 1801–1806. [DOI] [PMC free article] [PubMed] [Google Scholar]
- Jonkers J, Meuwissen R, van der Gulden H, Peterse H, van der Valk M, and Berns A (2001). Synergistic tumor suppressor activity of BRCA2 and p53 in a conditional mouse model for breast cancer. Nat. Genet 29, 418–425. [DOI] [PubMed] [Google Scholar]
- Kamerkar S, LeBleu VS, Sugimoto H, Yang S, Ruivo CF, Melo SA, Lee JJ, and Kalluri R (2017). Exosomes facilitate therapeutic targeting of oncogenic KRAS in pancreatic cancer. Nature 546, 498. [DOI] [PMC free article] [PubMed] [Google Scholar]
- Langmead B, Trapnell C, Pop M, and Salzberg S (2009). Ultrafast and memory-efficient alignment of short DNA sequences to the human genome. Genome Biol. 10, R25. [DOI] [PMC free article] [PubMed] [Google Scholar]
- Lee C-L, Moding EJ, Huang X, Li Y, Woodlief LZ, Rodrigues RC, Ma Y, and Kirsch DG (2012). Generation of primary tumors with Flp recombinase in FRT-flanked p53 mice. Dis. Model. Mech 5, 397–402. [DOI] [PMC free article] [PubMed] [Google Scholar]
- Li H, and Durbin R (2010). Fast and accurate long-read alignment with Burrows-Wheeler transform. Bioinformatics 26, 589–595. [DOI] [PMC free article] [PubMed] [Google Scholar]
- Li H, Handsaker B, Wysoker A, Fennell T, Ruan J, Homer N, Marth G, Abecasis G, Durbin R, and 1000 Genome Project Data Processing Subgroup, 1000 Genome Project Data Processing (2009). The Sequence Alignment/Map format and SAMtools. Bioinformatics 25, 2078–2079. [DOI] [PMC free article] [PubMed] [Google Scholar]
- Liberzon A, Birger C, Thorvaldsdóttir H, Ghandi M, Mesirov JP, and Tamayo P (2015). The Molecular Signatures Database Hallmark Gene Set Collection. Cell Syst. 1, 417–425. [DOI] [PMC free article] [PubMed] [Google Scholar]
- Love MI, Huber W, and Anders S (2014). Moderated estimation of fold change and dispersion for RNA-seq data with DESeq2. Genome Biol. 15. [DOI] [PMC free article] [PubMed] [Google Scholar]
- Maitra A, and Hruban RH (2008). Pancreatic cancer. Annu. Rev. Pathol 3, 157–188. [DOI] [PMC free article] [PubMed] [Google Scholar]
- Moffitt RA, Marayati R, Flate EL, Volmar KE, Loeza SGH, Hoadley KA, Rashid NU, Williams LA, Eaton SC, Chung AH, et al. (2015). Virtual microdissection identifies distinct tumor- and stroma-specific subtypes of pancreatic ductal adenocarcinoma. Nat. Genet 47, 1168–1178. [DOI] [PMC free article] [PubMed] [Google Scholar]
- Moore MJ, Goldstein D, Hamm J, Figer A, Hecht JR, Gallinger S, Au HJ, Murawa P, Walde D, Wolff R. a., et al. (2007). Erlotinib plus gemcitabine compared with gemcitabine alone in patients with advanced pancreatic cancer: A phase III trial of the National Cancer Institute of Canada Clinical Trials Group. J. Clin. Oncol 25, 1960–1966. [DOI] [PubMed] [Google Scholar]
- Mueller S, Engleitner T, Maresch R, Zukowska M, Lange S, Kaltenbacher T, Konukiewitz B, Öllinger R, Zwiebel M, Strong A, et al. (2018). Evolutionary routes and KRAS dosage define pancreatic cancer phenotypes. Nature 554, 62–68. [DOI] [PMC free article] [PubMed] [Google Scholar]
- Natarajan A, Wagner B, and Sibilia M (2007). The EGF receptor is required for efficient liver regeneration. Proc. Natl. Acad. Sci. U. S. A 104, 17081–17086. [DOI] [PMC free article] [PubMed] [Google Scholar]
- Navas C, Hernández-Porras I, Schuhmacher AJ, Sibilia M, Guerra C, and Barbacid M (2012). EGF receptor signaling is essential for k-ras oncogene-driven pancreatic ductal adenocarcinoma. Cancer Cell 22, 318–330. [DOI] [PMC free article] [PubMed] [Google Scholar]
- Nicolle R, Blum Y, Marisa L, Loncle C, Gayet O, Moutardier V, Turrini O, Giovannini M, Bian B, Bigonnet M, et al. (2017). Pancreatic Adenocarcinoma Therapeutic Targets Revealed by Tumor-Stroma Cross-Talk Analyses in Patient-Derived Xenografts. Cell Rep. 21, 2458–2470. [DOI] [PMC free article] [PubMed] [Google Scholar]
- Nieto P, Ambrogio C, Esteban-Burgos L, Gómez-López G, Blasco MT, Yao Z, Marais R, Rosen N, Chiarle R, Pisano DG, et al. (2017). A Braf kinase-inactive mutant induces lung adenocarcinoma. Nature 548, 239–243. [DOI] [PMC free article] [PubMed] [Google Scholar]
- Owczarczyk-Saczonek A, Witmanowski H, and Placek W (2013). Acneiform rash during lung cancer therapy with erlotinib (Tarceva). Postep. Dermatologii i Alergol 30, 195–198. [DOI] [PMC free article] [PubMed] [Google Scholar]
- Pease S, and Saunders TL (2011). Advanced protocols for animal transgenesis : an ISTT manual (Springer; ). [Google Scholar]
- Pérez-Mancera PA, Guerra C, Barbacid M, and Tuveson DA (2012). What we have learned about pancreatic cancer from mouse models. Gastroenterology 142, 1079–1092. [DOI] [PubMed] [Google Scholar]
- Plummer NW, Evsyukova IY, Robertson SD, de Marchena J, Tucker CJ, and Jensen P (2015). Expanding the power of recombinase-based labeling to uncover cellular diversity. Development. [DOI] [PMC free article] [PubMed] [Google Scholar]
- Puyol M, Martín A, Dubus P, Mulero F, Pizcueta P, Khan G, Guerra C, Santamaria D, and Barbacid M (2010). A Synthetic Lethal Interaction between K-Ras Oncogenes and Cdk4 Unveils a Therapeutic Strategy for Non-small Cell Lung Carcinoma. Cancer Cell 18, 63–73. [DOI] [PubMed] [Google Scholar]
- Rahib L, Smith BD, Aizenberg R, Rosenzweig AB, Fleshman JM, and Matrisian LM (2014). Projecting cancer incidence and deaths to 2030: The unexpected burden of thyroid, liver, and pancreas cancers in the united states. Cancer Res. 74, 2913–2921. [DOI] [PubMed] [Google Scholar]
- Raphael BJ, Hruban RH, Aguirre AJ, Moffitt RA, Yeh JJ, Stewart C, Robertson AG, Cherniack AD, Gupta M, Getz G, et al. (2017). Integrated Genomic Characterization of Pancreatic Ductal Adenocarcinoma. Cancer Cell 32, 185–203.e13. [DOI] [PMC free article] [PubMed] [Google Scholar]
- Ruzankina Y, Pinzon-Guzman C, Asare A, Ong T, Pontano L, Cotsarelis G, Zediak VP, Velez M, Bhandoola A, and Brown EJ (2007). Deletion of the developmentally essential gene ATR in adult mice leads to age-related phenotypes and stem cell loss. Cell Stem Cell 1, 113–126. [DOI] [PMC free article] [PubMed] [Google Scholar]
- Sanclemente M, Francoz S, Esteban-Burgos L, Bousquet-Mur E, Djurec M, Lopez-Casas PP, Hidalgo M, Guerra C, Drosten M, Musteanu M, et al. (2018). c-RAF Ablation Induces Regression of Advanced Kras/Trp 53 Mutant Lung Adenocarcinomas by a Mechanism Independent of MAPK Signaling. Cancer Cell 1–12. [DOI] [PubMed] [Google Scholar]
- Schnütgen F, Doerflinger N, Calléja C, Wendling O, Chambon P, and Ghyselinck NB (2003). A directional strategy for monitoring Cre-mediated recombination at the cellular level in the mouse. Nat. Biotechnol 21, 562–565. [DOI] [PubMed] [Google Scholar]
- Subramanian A, Tamayo P, Mootha VK, Mukherjee S, Ebert BL, Gillette MA, Paulovich A, Pomeroy SL, Golub TR, Lander ES, et al. (2005). Gene set enrichment analysis: A knowledge-based approach for interpreting genome-wide expression profiles. Proc. Natl. Acad. Sci 102, 15545–15550. [DOI] [PMC free article] [PubMed] [Google Scholar]
- Tiriac H, Belleau P, Engle DD, Plenker D, Deschênes A, Somerville T, Froeling FEM, Burkhart RA, Denroche RE, Jang G-H, et al. (2018). Organoid profiling identifies common responders to chemotherapy in pancreatic cancer. Cancer Discov. CD-18-0349 [DOI] [PMC free article] [PubMed] [Google Scholar]
- Todoric J, Antonucci L, Di Caro G, Li N, Wu X, Lytle NK, Dhar D, Banerjee S, Fagman JB, Browne CD, et al. (2017). Stress-Activated NRF2-MDM2 Cascade Controls Neoplastic Progression in Pancreas. Cancer Cell 32, 824–839.e8. [DOI] [PMC free article] [PubMed] [Google Scholar]
- Torres C, and Grippo PJ (2018). Pancreatic cancer subtypes: a roadmap for precision medicine. Ann. Med 1–11. [DOI] [PMC free article] [PubMed] [Google Scholar]
- Trapnell C, Roberts A, Goff L, Pertea G, Kim D, Kelley DR, Pimentel H, Salzberg SL, Rinn JL, and Pachter L (2012). Differential gene and transcript expression analysis of RNA-seq experiments with TopHat and Cufflinks. Nat. Protoc 7, 562–578. [DOI] [PMC free article] [PubMed] [Google Scholar]
- Trifonov V, Pasqualucci L, Tiacci E, Falini B, and Rabadan R (2013). SAVI: a statistical algorithm for variant frequency identification. BMC Syst. Biol 7, S2. [DOI] [PMC free article] [PubMed] [Google Scholar]
- Waddell N, Pajic M, Patch A, Chang DK, Kassahn KS, Bailey P, Johns AL, Miller D, Nones K, Quek K, et al. (2015). Whole genomes redefine the mutational landscape of pancreatic cancer. Nature 518, 495–501. [DOI] [PMC free article] [PubMed] [Google Scholar]
- Witkiewicz AK, McMillan E. a., Balaji U, Baek G, Lin W-C, Mansour J, Mollaee M, Wagner K-U, Koduru P, Yopp A, et al. (2015). Whole-exome sequencing of pancreatic cancer defines genetic diversity and therapeutic targets. Nat. Commun 6, 6744. [DOI] [PMC free article] [PubMed] [Google Scholar]
- Ying H, Kimmelman AC, Lyssiotis CA, Hua S, Chu GC, Fletcher-Sananikone E, Locasale JW, Son J, Zhang H, Coloff JL, et al. (2012). Oncogenic kras maintains pancreatic tumors through regulation of anabolic glucose metabolism. Cell 149, 656–670. [DOI] [PMC free article] [PubMed] [Google Scholar]
Associated Data
This section collects any data citations, data availability statements, or supplementary materials included in this article.
Supplementary Materials
Table S2. Differentially expressed genes between RC and NRC cells. Related to Figure 6.
Data Availability Statement
Next generation sequencing data have been deposited in the Gene Expression Omnibus (GEO) database under the accession number GSE112434 as well as in the NCBI’s Sequence Read Archive (SRA) under a BioProject with the accession number PRJNA462276.