

Abstract
In vitro models of osteogenesis are essential for investigating bone biology and the effects of pharmaceutical, chemical, and physical cues on bone formation. Osteogenesis takes place in a complex three-dimensional (3D) environment with cells from both mesenchymal and hematopoietic origins. Existing in vitro models of osteogenesis include two-dimensional (2D) single type cell monolayers and 3D cultures. However, an in vitro scaffold-free multicellular 3D model of osteogenesis is missing. We hypothesized that the self-inductive ossification capacity of bone marrow tissue can be harnessed in vitro and employed as a scaffold-free multicellular 3D model of osteogenesis. Therefore, rat bone marrow tissue was cultured for 28 days in three settings: 2D monolayer, 3D homogenized pellet, and 3D organotypic explant. The ossification potential of marrow in each condition was quantified by micro-computed tomography. The 3D organotypic marrow explant culture resulted in the greatest level of ossification with plate-like bone formations (up to 5 mm in diameter and 0.24 mm in thickness). To evaluate the mimicry of the organotypic marrow explants to newly forming native bone tissue, detailed compositional and morphological analyses were performed, including characterization of the ossified matrix by histochemistry, immunohistochemistry, Raman microspectroscopy, energy dispersive X-ray spectroscopy, backscattered electron microscopy, and micromechanical tests. The results indicated that the 3D organotypic marrow explant culture model mimics newly forming native bone tissue in terms of the characteristics studied. Therefore, this platform holds significant potential to be used as a model of osteogenesis, offering an alternative to in vitro monolayer cultures and in vivo animal models.
Keywords: Scaffold-free, In vitro model, Marrow explant culture, Osteogenesis, Bone tissue engineering
Bone formation takes place in a complex microenvironment under the regulation of chemical [1–3] and physical [4–6] cues, necessitating the involvement and interaction of multiple cell types [7–16]. Various models have been developed and utilized to investigate bone formation. These models comprise either in vitro monolayer culture systems that employ single cell types (e.g., calvarial osteoblastic cells, mesenchymal stem cells) [17–21], explant cultures of bone tissue fragments (e.g., mouse metatarsals and calvaria) [22, 23], or in vivo animal models (e.g., murine fracture healing models) [24–29]. It has been shown that cells cultured in two-dimensional (2D) monolayer conditions display significant perturbations in gene expression compared to cells in native tissues and cells cultured in three-dimensional (3D) culture conditions [30]. On the other hand, bone fragments/explants are formed readily on an existing mineralized tissue platform; therefore, they are not particularly useful for studying the full scale of bone formation, which encompasses both proliferation and differentiation of stem cells. In vivo models are complex, and the responses observed in these models are generally the result of multiple systems in the organism. In addition, with in vivo animal models it is harder to target specific proteins (i.e., transgenic mouse models) compared to in vitro systems, which allow protein targeting methods such as silencing RNA (siRNA) [23]. Therefore, there is a need for novel 3D in vitro models which embody the multicellular and physiological characteristics of native tissues [15, 30–35]. The 3D culture platforms are conveniently situated between the basic 2D culture systems and the complex in vivo models and can be an alternative to the currently used animals [30, 33, 34]. Therefore, we propose a scaffold-free, multicellular, 3D in vitro model based on the inherent ossification potential of bone marrow explants as an effective tool to study osteogenesis.
Earlier studies on the ossification potential of bone marrow tissue have shown that ectopic implantation of marrow induces ossification and forms a tissue that is composed of both bone and marrow components [36]. In addition, it was previously demonstrated that bone marrow tissue inherently ossifies in vitro [37]. We have recently shown that explant cultures of rat marrow tissue result in ossified structures in the absence of osteoinductive agents and without any serum supplementation [3]. However, it is unknown whether the extracellular matrix and micromechanical characteristics of the ossified formations resulting from marrow explants are similar to newly forming native bone tissue. Moreover, the effect of different culture conditions (i.e., 2D vs. 3D culture) on the inherent in vitro ossification potential of marrow tissue is unknown. In the current study, rat bone marrow explants were cultured for 28 days in three different conditions: 2D monolayer, 3D homogenized pellet, and 3D organotypic explant culture. Next, the morphological and compositional properties of the resulting ossified formations were investigated and characterized by delineating: (1) the ossification level and structural organization of the ossified matrix with micro-computed tomography (μCT); (2) the compositional and cellular organization of the ossified marrow explants by high-magnification back-scattered electron microscopy (BSEM), histology, immunohistochemistry, and flow cytometry; (3) the mineral to matrix ratio of the ossified marrow explants with Raman microspectroscopy; (4) the elemental analysis of the ossified matrix with energy dispersive X-ray spectroscopy (EDS); and (5) the micromechanical properties of the ossified matrix with microindentation.
Methods
In Vitro Culture Conditions
Whole bone marrow tissue was isolated from the femora and tibiae of male Long-Evans rats 80–90 days old (approved by the Institutional Animal Care and Use Committee). We previously described comprehensively the bone marrow extraction and explant culture procedure [3]. Briefly, diaphyseal bone marrow was extracted with a centrifugation-based technique that minimizes the transfer of bony fragments from the donor bone tissue into the culture environment. Marrow tissue was cultured on inserts with porous PET membranes (Transwell, 0.4 μm pore size; Corning, Corning, NY) at a 7 μL (7 mm3) volume (Fig. 1). The marrow growth medium was osteogenic; however, it did not contain any osteoinductive factors (such as dexamethasone or BMP-2) and was composed of (modified from Luria et al. [37]) α-MEM (Sigma, St. Louis, MO), 10% MSC-qualified-FBS (Invitrogen, Carlsbad, CA), 60 U/mL Pen-Strep (Invitrogen), 2.5 μg/mL fungizone (Sigma), 50 μg/mL ascorbic acid (Sigma), 5 mM Na-β-glycerophosphate (MP Biomedical, Solon, OH), and 3.5 mg/mL glucose (Sigma). The culture medium was changed every 2 days, and all marrow cultures were maintained at 37°C, 5% CO2, 95–99% relative humidity (to prevent dehydration of the explants) throughout the experiment (28 days). In order to investigate the effect of different culture conditions on the in vitro inherent ossification potential of marrow tissue, three different settings were utilized with the same volume of marrow tissue and the same culture medium: (1) 2D culture with marrow immersed in the culture medium and adherent cells forming a monolayer, (2) pellet culture in which suspended marrow cells were centrifuged and cultured as a micromass on a membrane at the interface of air and medium, and (3) explant culture in which the marrow was cultured “as is” on a membrane at the interface of air and medium.
Fig. 1.
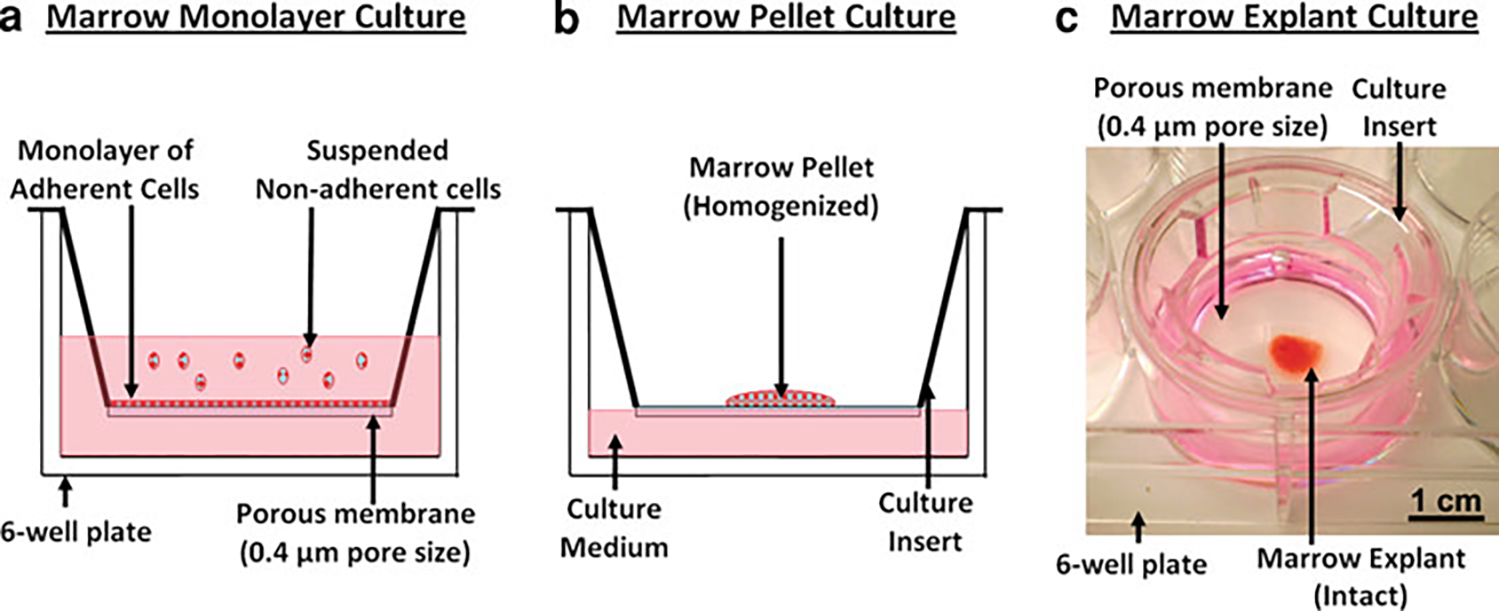
Overview of marrow culture conditions tested in this study at day 0. The same volume (7 μL) of marrow tissue was utilized with the same culture medium in three different culture conditions, with a culture duration of 28 days. In each case, the culture setup was composed of a culture insert with a PET porous membrane (0.4 μm pore size, Transwell; Corning) placed in a six-well culture plate. a Monolayer culture system in which marrow tissue was dispersed and suspended in medium. The typical monolayer marrow culture allowed adherent marrow cells to attach on the porous membrane and suspended nonadherent marrow cells, which were washed away during the first medium change. b The air–medium interface marrow pellet culture system in which marrow tissue was suspended and homogenized in culture medium, followed by centrifugation to obtain a pellet, which is transferred onto porous membrane. c The air–medium interface marrow explant culture system used for culturing bone marrow explants in their intact form. In pellet (b) and explant (c) culture conditions, the inside of the insert (i.e., above the porous membrane) was not filled with medium, to prevent the immersion and dispersion of marrow pellet/explant and to maintain the compositional integrity during medium changes. Otherwise, transport of medium to the explants occurred by diffusion and wicking of the medium through the membrane
Marrow Monolayer (2D) Culture (Fig. 1a)
This culture condition was employed to segregate adherent and nonadherent cells. Essentially, this condition is similar to the 2D monolayer culture systems of marrow-derived cells commonly used in the literature [18, 38, 39]. Marrow tissue (7 μL) was dispersed and homogenized in the culture medium, filtered through a 70-μm cell strainer, and transferred into the culture inserts (n = 6), allowing adherent cells to attach on the porous membrane and keeping nonadherent cells suspended (Fig. 1a). Nonadherent cells were aspirated off during medium changes, and the adherent cell population was cultured for 28 days.
Marrow Homogenized Pellet Culture (Fig. 1b)
This culture condition kept the adherent and nonadherent cells together; however, their spatial association was nullified by homogenization. Marrow tissue was dispersed and homogenized in the culture medium, followed by filtering through a cell strainer with 70 μm pore size. Then, the suspended marrow tissue was centrifuged at 1,000 rpm for 5 min to obtain a homogenized pellet of all marrow cells (both adherent and nonadherent). The supernatant was discarded, and 7 μL of the pellet was pipetted and transferred onto culture inserts (n = 6) (Fig. 1b). The insert carrying the pellet was placed in culture wells, which were filled with medium to a level to contact the insert membrane. The medium was consistently in contact with the membrane over the entire culture period. The membrane had 0.4 μm porosity, which allowed fluid diffusion. Therefore, the presence of medium above the membrane occurred by diffusion through the membrane, and this configuration preserved the cellular composition of pellets, preserving both the adherent and nonadherent marrow cells. Furthermore, the insert containing the pellet was removed and placed on the side during medium changes; therefore, the cellular composition was maintained throughout this air–medium interface culture model for both marrow-derived pellet culture and the following marrow explant culture conditions.
Explant Culture of Marrow (Fig. 1c)
Immediately after extraction from the donor animals, marrow tissue was pipetted and transferred onto the culture inserts (7 μL each, n = 10) with minimal manipulation. Similar to the pellet culture conditions, the lower side of the porous membrane was in contact with a sufficient amount of medium (in a six-well plate) (Fig. 1c). The upper portion of the porous inserts was not filled with medium, to preserve the structural and cellular integrity of the marrow explant “as is”.
μCT Analysis
Mineralization and ossified volume of cultured marrow samples (n = 10) were analyzed and measured by μCT scans performed at day 28. Samples were fixed in 10% formalin and kept in the fixative before and during the scans (μCT 40; Scanco Medical, Brüttisellen, Switzerland), which were performed with a 16 μm voxel resolution (I = 145 μA, E = 55 kVp, integration time = 200 ms). Scanned images were reconstructed and analyzed with commercial software (Scanco Medical) using the standard segmentation parameters for bone tissue [40–42]. An ossified marrow explant was stained with 2% silver nitrate (von Kossa staining [18]) to visualize the mineralized matrix and compare with the detected ossified volume by μCT.
Histological Analysis
At the end of the culture period (28 days), 10% formalin was used to fix the ossified marrow samples, followed by decalcification in formic acid solution (1:1 solution of 50% aqueous formic acid and 20% sodium citrate) for 12 h. Decalcified explants were then washed in tap water for 30–45 min, embedded in paraffin, sectioned, and dried overnight in a 37°C oven. Sections were deparaffinized and hydrated in a graded series of alcohol solutions (100, 95, 70, and water). Slides were then stained with Masson’s trichrome to visualize the collagen-rich ossifying regions. In addition, safranin O fast green staining was performed to check for cartilaginous formation via the presence of proteoglycans. Light microscopic images were taken with an Olympus (Tokyo, Japan) Vanox microscope equipped with the Qimaging Micropublisher 5.0 RTV 5 megapixel CCD camera.
Immunohistochemical Analysis for Extracellular Matrix Typification
The protocol followed for immunohistochemistry of the ossified marrow explants was modified from previously published reports [43, 44]. Sections of decalcified, ossified marrow explants were deparaffinized and treated with 10 mM sodium citrate solution (pH 6.0) for 10 min at 95°C for epitope recovery. Sections were then cooled for 15 min, washed in deionized water, and treated with 3% H2O2 for 10 min to quench endogenous peroxidase activity. Following this step, sections were rinsed with Tris-buffered saline (TBS) and immersed in a protein block solution (Dako, Carpinteria, CA) for 30 min to prevent nonspecific binding. The blocking solution was then drained, and the sections were incubated with the primary antibody for 1 h at room temperature. Anti-rat primary antibodies included anti-collagen type I rabbit polyclonal IgG antibody (1:10 dilution; AbD Serotec, Raleigh, NC) and anti-collagen type III rabbit polyclonal IgG antibody (1:300 dilution, AbD Serotec) to characterize matrix composition. After incubation with the primary antibody, sections were washed with TBS and sequentially incubated with a prediluted biotinylated secondary antibody (30 min), a peroxidase-labeled streptavidin (30 min), and a 3,3′-diaminobenzidine chromogen solution (5 min), using the Universal Dako LSAB + kit (Dako) and following the manufacturer’s instructions. Sections were then washed with DI water, counterstained with hematoxylin, and coverslipped. Sections stained in a similar manner but without the primary antibody served as the negative control.
Immunohistochemical Analysis for Presence of Osteocyte-Like Cells
The presence of osteocyte-like cells in the ossified marrow explants was analyzed through immunohistochemical staining for the commonly accepted osteocyte markers CD44 [44] and sclerostin [45, 46]. The anti-rat primary antibody anti-CD44 (OX-49) mouse monoclonal IgG was used to detect the presence of osteocytes [44] (1:100 dilution; Biolegend, San Diego, CA) according to the staining protocol described in the previous section. Sclerostin expression on paraffin-embedded sections of cultured bone marrow explants and rat tibiae was detected as previously described [45, 46]. Briefly, sections were deparaffinized, treated with 3% H2O2 to inhibit endogenous peroxidase activity, blocked with rabbit serum, and then incubated with 1:100 dilution of goat polyclonal anti-mouse sclerostin antibody (R&D Systems, Minneapolis, MN). Sections were then incubated with rabbit anti-goat horseradish peroxidase-conjugated secondary antibody (Santa Cruz Biotechnologies, Santa Cruz, CA), followed by avidin-conjugated peroxidase (Vectastain Elite ABC Kit; Vector Laboratories, Burlingame, CA). Color was developed with a diaminobenzidine substrate chromogen system (Dako). Nonimmune IgG was used as a negative control.
High-Magnification Imaging of Lacunocanalicular Formations with BSEM
Ossified marrow explants were fixed in 70% ethanol, followed by serial dehydration (ethanol 80, 90, 100% × 2). Dehydrated samples were embedded in (poly)methyl-methacrylate (PMMA) for undemineralized assessment of the ossified matrix. PMMA embedding involved infiltration of the samples with 80% methyl methacrylate (Sigma) and 20% dibutyl phthalate (Sigma, M1) for 1 day, followed by infiltration with M1 supplemented with 1 g/L benzoyl peroxide (Sigma) for 1 day. After infiltration, samples were embedded with M1 supplemented with 3.5 g/L benzoyl peroxide for 2 days, followed by 2-day curing in a 45°C oven. PMMA-embedded samples were sectioned transversely with a low-speed diamond saw, exposing the cross section of the ossified marrow explants. The exposed surfaces were polished with increasingly fine sandpaper, up to 2,000 grit, and final polishing was conducted with a polishing cloth using 0.05-μ alumina particles. Polished samples were visually checked with a light microscope. BSEM imaging was performed on the polished surface with a gaseous analytical detector (GAD) at an accelerator voltage of 10 kV, with a 4.4 mm working distance and at 10,000× magnification (NanoSEM; FEI, Hillsboro, OR).
Assessment of Cellular Residency by Flow Cytometry
Cells were harvested by pooling at least 10 marrow explants per time point (days 0, 14, and 28) and by incubating them in 1 mg/mL collagenase (Sigma) in 0.25% trypsin-EDTA solution (Invitrogen) for 15 min at 37°C with gentle mixing at intervals. After enzymatic treatment, the cell suspension harvested was filtered through a 70-μ cell strainer and centrifuged. Following centrifugation, red blood cells (RBCs) were lysed by suspending the cells in 1 × RBC lysis buffer (150 mM ammonium chloride, 10 mM sodium bicarbonate, and 1 mM EDTA) for 5 min at room temperature. Prior to incubation with the specific antibodies, cells were suspended in 5% mouse serum (Santa Cruz Biotechnology, Santa Cruz, CA) for 20 min at 4°C to prevent nonspecific binding of the antibodies. Cells were then stained with FITC-labeled CD45 antibody (Biolegend) to identify hematopoietic cells [47]. STRO-1 antibody has been commonly used to label marrow mesenchymal progenitors [12, 48–52], and therefore, PE-labeled STRO-1 antibody (Santa Cruz Biotechnology) was used to identify rat MSCs based on the literature [12]. Labeled cell populations were analyzed by a flow cytometer (Cell Lab Quanta MPL; Beckman Coulter, Fullerton, CA), and the data were evaluated by performing a dot plot analysis using WinList 6.0 software (Verity Software House, Topsham, ME).
Quantification of Mineral to Matrix Ratio by Raman Microspectroscopy
After 28 days in culture, formalin-fixed, ossified marrow explants were transferred onto glass slides and the Raman spectra were obtained with a 660 nm laser (LabRam HR800; Horiba Jobin Yvon, Edison, NJ). A wavenumber range of 250–1800 cm−1 was selected to visualize the characteristic peaks of bone tissue. As a control, the diaphyseal portion of the tibia of a rat used in this study was fixed and analyzed the same way. The ratio of the intensities of 959 cm−1 peak (apatitic mineral, symmetric stretch for ) and 1,450 cm−1 peak (N–H bending, methyl deformation, CH2 wagging) was quantified [53–56] in ossified marrow explants (n = 10) and rat tibiae (n = 3) to compare the mineral/matrix ratio.
Analysis of Calcium (Ca) to Phosphorus (P) Ratio with EDS
Elemental analysis of ossified marrow explants was conducted with EDS using the FEI Quanta 3D FEG Dual-beam SEM equipped with an Oxford INCAPentaFET-×3 large area crystal Energy Dispersive X-Ray detector in low vacuum mode. Diaphyseal sections of rat tibiae were included as positive controls and similarly analyzed with EDS. Elemental analysis on rat tibia was conducted on the periosteal surface (newly forming bone) and on the intracortical regions (older bone) separately, due to different maturity levels of bone tissue at these locations [57, 58]. In this study, the Ca/P weight ratio of the ossified marrow samples and the native bone tissue were compared with relative values. Therefore, EDS quantification was performed on the samples under the same measurement settings and conditions. The Ca/P weight ratio was measured for ossified marrow (OM) explants (n = 21), periosteal rat tibiae (PRT, n = 5), and intracortical rat tibiae (IRT, n = 6) and used to compare the crystalline level of the samples [59]. The Ca/P weight ratio for human bone (HB, ages 15–55, n = 80) was obtained from a previous study [60] for comparison.
Micromechanical Analysis
Microindentation of OM explants was performed, and microhardness values were compared with those of native rat tibiae. Native rat tibiae were fixed with 70% ethanol, dehydrated, PMMA-embedded, sectioned, and polished as described above. Embedded tibiae were sectioned transversely to expose the cross section of the mid-diaphyses. Microindentation on the rat tibial diaphysis was performed on the PRT and IRT regions separately due to the difference in the micromechanical properties, which is associated with the different maturity of the bone tissue at these locations [57]. Microindentation was performed on polished, PMMA-embedded samples using a Vickers (Malden, MA) diamond microindenter with a microhardness tester (Leco LM247AT). The indentation load was selected to be 200 gf with a dwell time of 15 s [61, 62]. Vickers hardness (HV) was calculated using the manufacturer’s software (Leco Amh43) by averaging the measurements obtained from 10–26 individual indentations for each sample group.
Statistical Methods
The ossification level in different marrow culture conditions, the Ca/P weight ratio, and the HV values of the samples were analyzed statistically with Kruskal-Wallis one-way analysis of variance, followed by the Mann-Whitney U-test and a post hoc test with Bonferroni correction for multiple comparisons. The measured ratio of the Raman peak intensities at 959 cm−1 (apatitic mineral, symmetric stretch for ) and 1,450 cm−1 peak (N-H bending, methyl deformation, CH2 wagging) in the samples was statistically analyzed by the Mann-Whitney U-test. Statistical significance was set at P < 0.05, and the P value obtained for each test was adjusted based on the number of comparisons according to Bonferroni correction (P value obtained from the test multiplied by number of comparisons). Error bars in the figures indicate standard deviation (SD).
Results
Effect of Culture Condition on In Vitro Ossification Potential of Marrow Tissue
Rat bone marrow explants underwent ossification without the addition of any osteoinductive factors in both the pellet culture and explant culture conditions (Fig. 2). However, the monolayer culture condition did not result in a detectable level of inherent ossification in marrow samples (Fig. 2); therefore, it was not included in the statistical analysis. Culturing marrow explants “as is” at the air–medium interface resulted in a significantly greater level of inherent ossification (0.728 ± 0.407 mm3, n = 10) compared to the pellet culture (0.019 ± 0.010 mm3, n = 6) (P < 0.05).
Fig. 2.
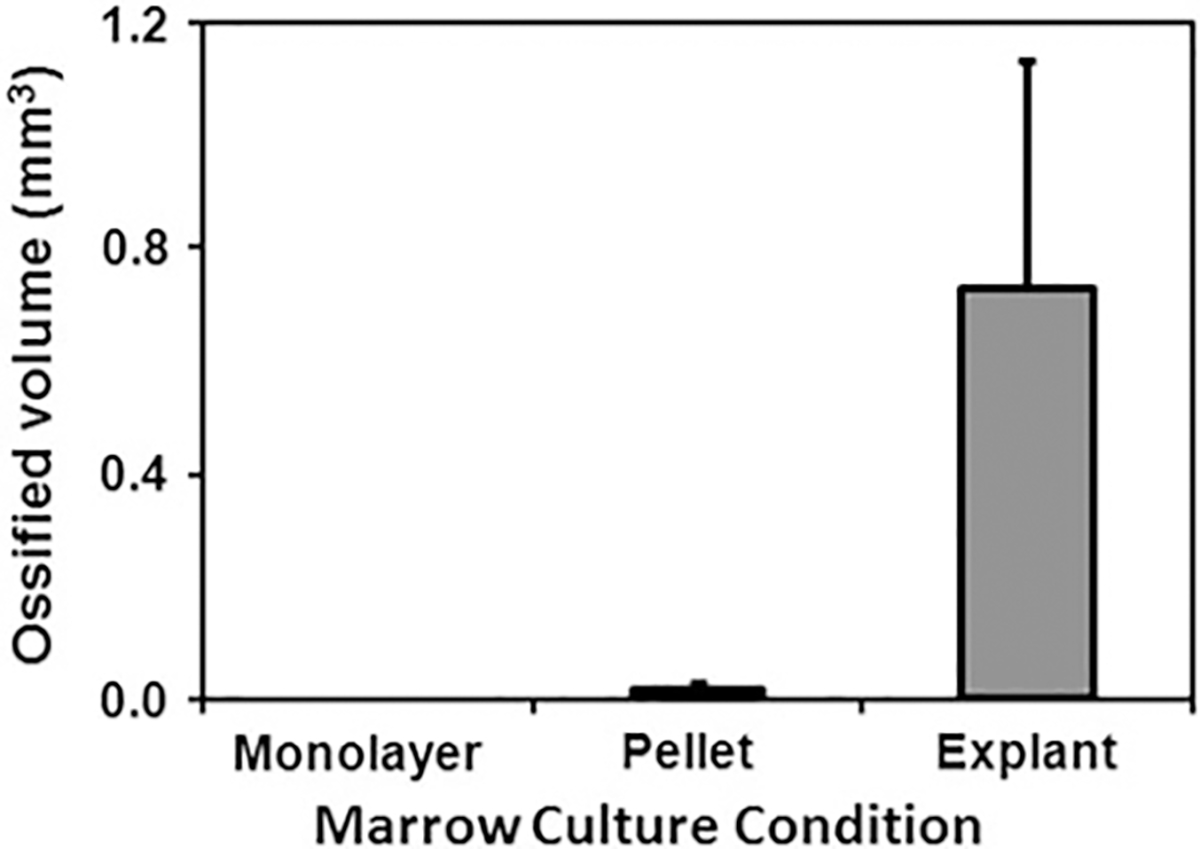
The effect of culture condition on inherent in vitro ossification potential of marrow tissue as measured by μCT. Traditional 2D monolayer culture (n = 6), which disrupts the marrow tissue and removes the nonadherent cells of the marrow, results in undetectable ossification. Homogenization and pellet culture of marrow tissue (n = 6) result in a low-level inherent in vitro ossification (0.019 ± 0.010 mm3). On the other hand, the air–medium interface marrow explant culture (n = 10) described in this study results in the greatest level of inherent in vitro ossification (0.728 ± 0.407 mm3). All groups displayed in the figure are significantly different from each other (P < 0.05)
Appearance and Structural Organization of OM Explants
Marrow explants ossified to generate a plate-shaped, bone-like tissue by day 28 with a diameter up to 5 mm (3.2 ± 1.2 mm, n = 10) (Fig. 3a) and a thickness up to 0.24 mm (160 ± 55 μm, n = 8) (Fig. 4). OM explants were visible to the naked eye (Fig. 3a). The presence of calcified tissue was verified by von Kossa staining (Fig. 3a), and μCT scans further confirmed the presence of mineralized tissue (Fig. 3b). The mineralized volume quantified by μCT was about 10% (0.73 ± 0.41 mm3) of the initial bone marrow volume (7 μL, which is equivalent to 7 mm3).
Fig. 3.
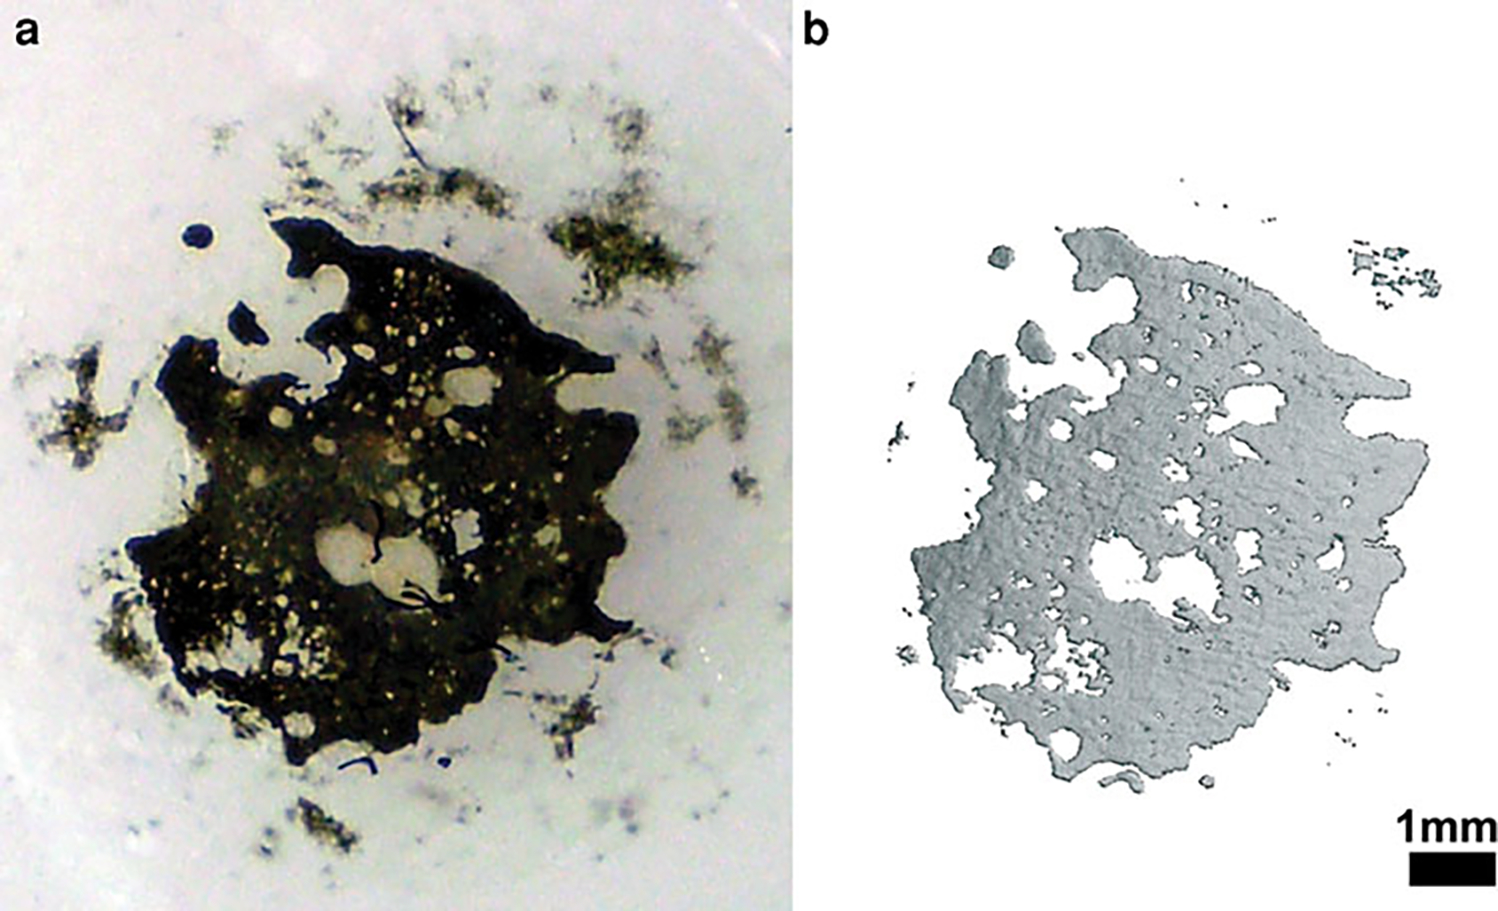
General overview of ossifying marrow explants. a von Kossa-stained marrow explant at day 28 confirms the presence of calcification. b 3D μCT reconstructed appearance of an ossified explant that displays a plate-like ossified structure at day 28
Fig. 4.
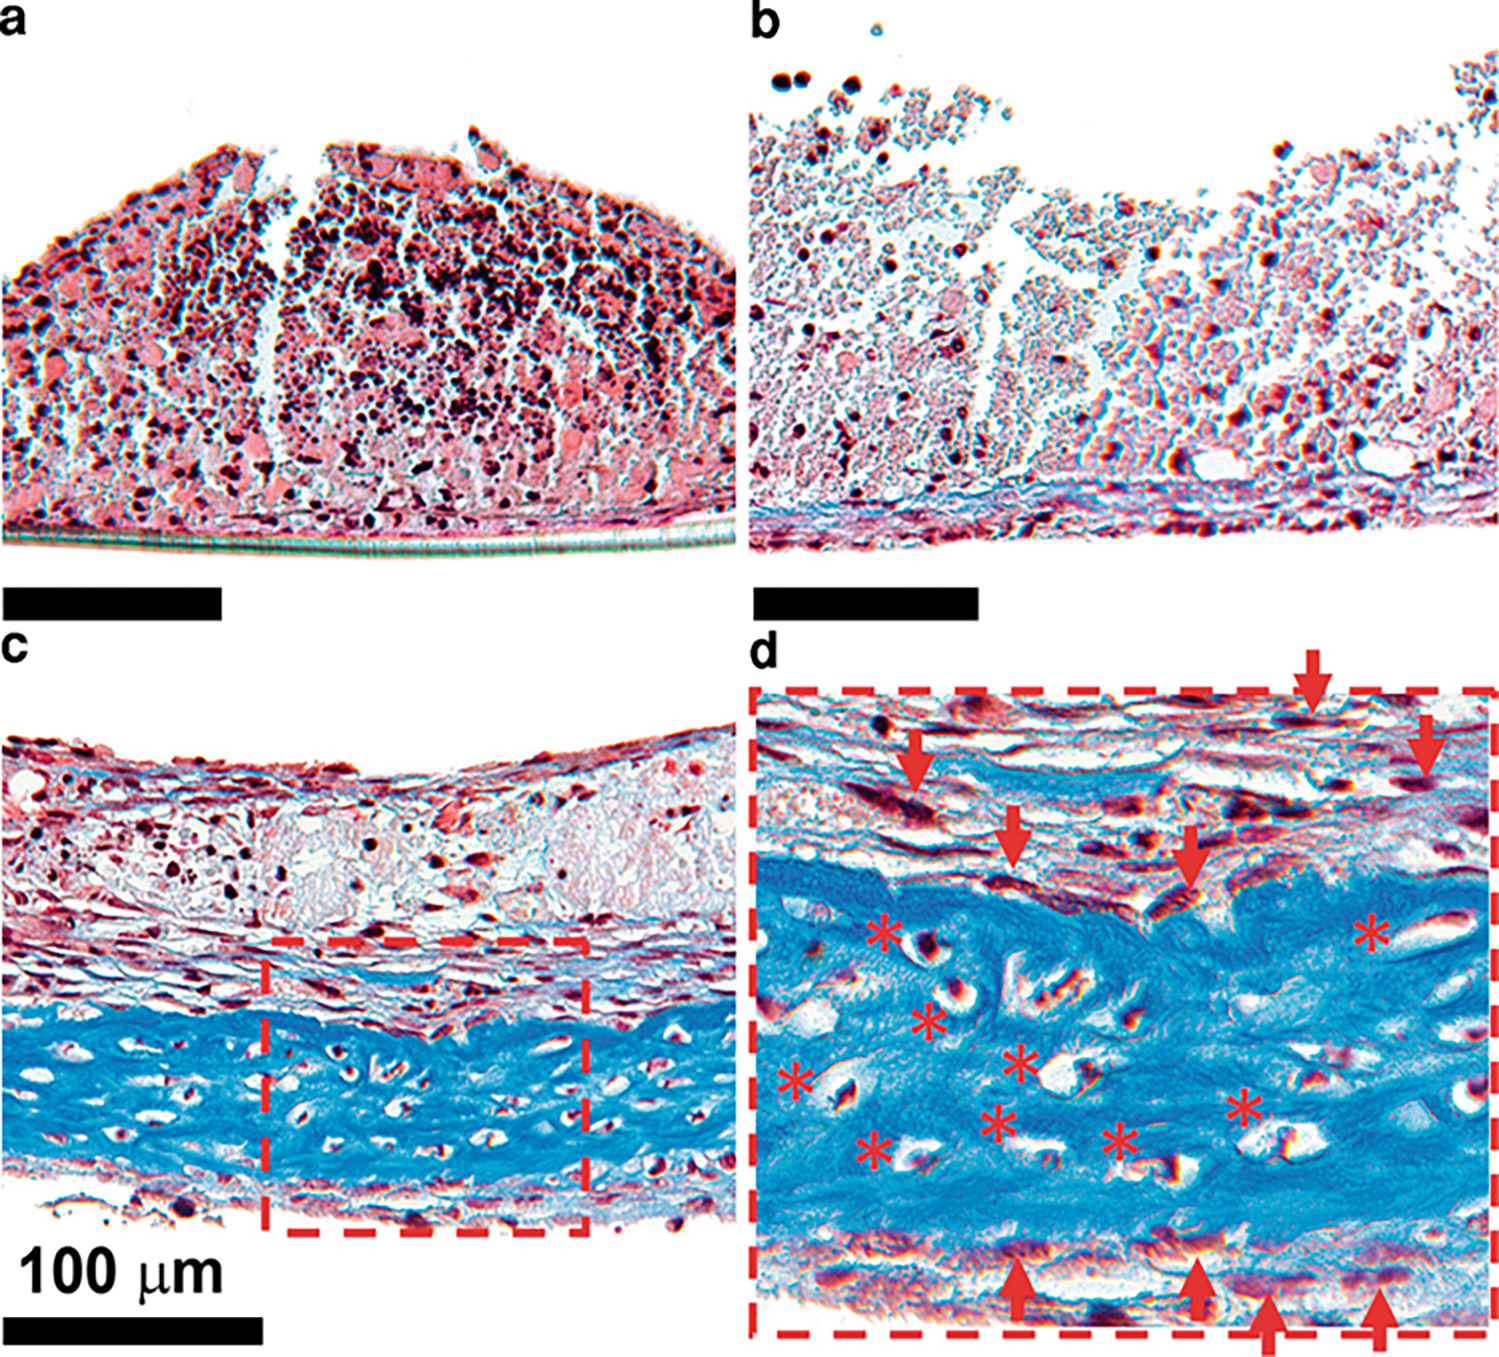
Evolution of in vitro inherently ossifying marrow explants stained with Masson’s trichrome over time. a Day 7. b Day 14. c Day 28. d Close-up view of day 28 section. Darker blue color represents collagen-rich sections of the explants. At day 7 it was possible to see a multicellular composition of bone marrow tissue without any traces of ossification (a). At day 14 the collagen-rich matrix originated at the bottom of the explant adjacent to the porous membrane (b). At day 28 the collagen-rich matrix deposition increased compared to day 14 (c). Osteocyte-like cells were observed to be embedded in the collagen-rich matrix (d)
Cellular and Compositional Organization of OM Explants
Masson’s trichrome staining showed the presence of high-density collagen regions (blue color) beginning around day 14 (Fig. 4b). Such matrix formation occurred at regions of explants interfacing with the porous membrane. The collagen-dense zone increased in thickness and covered a large portion of the sample by day 28 (Figs. 4c, 5a). Viable osteoblast-like cells (arrowheads in Fig. 4e) were observed around the collagen-rich regions (Fig. 4d). In addition, viable osteocyte-like cells (* in Figs. 4d, 6i) were embedded in the collagen-rich sections. Safranin O fast green staining did not indicate the presence of proteoglycans (orange color absent in Fig. 5b), implying absence of cartilaginous tissue. The collagen matrix synthesized during the ossification of marrow explants was predominantly collagen type I (Fig. 5c) and weakly positive for collagen type III (Fig. 5d).
Fig. 5.
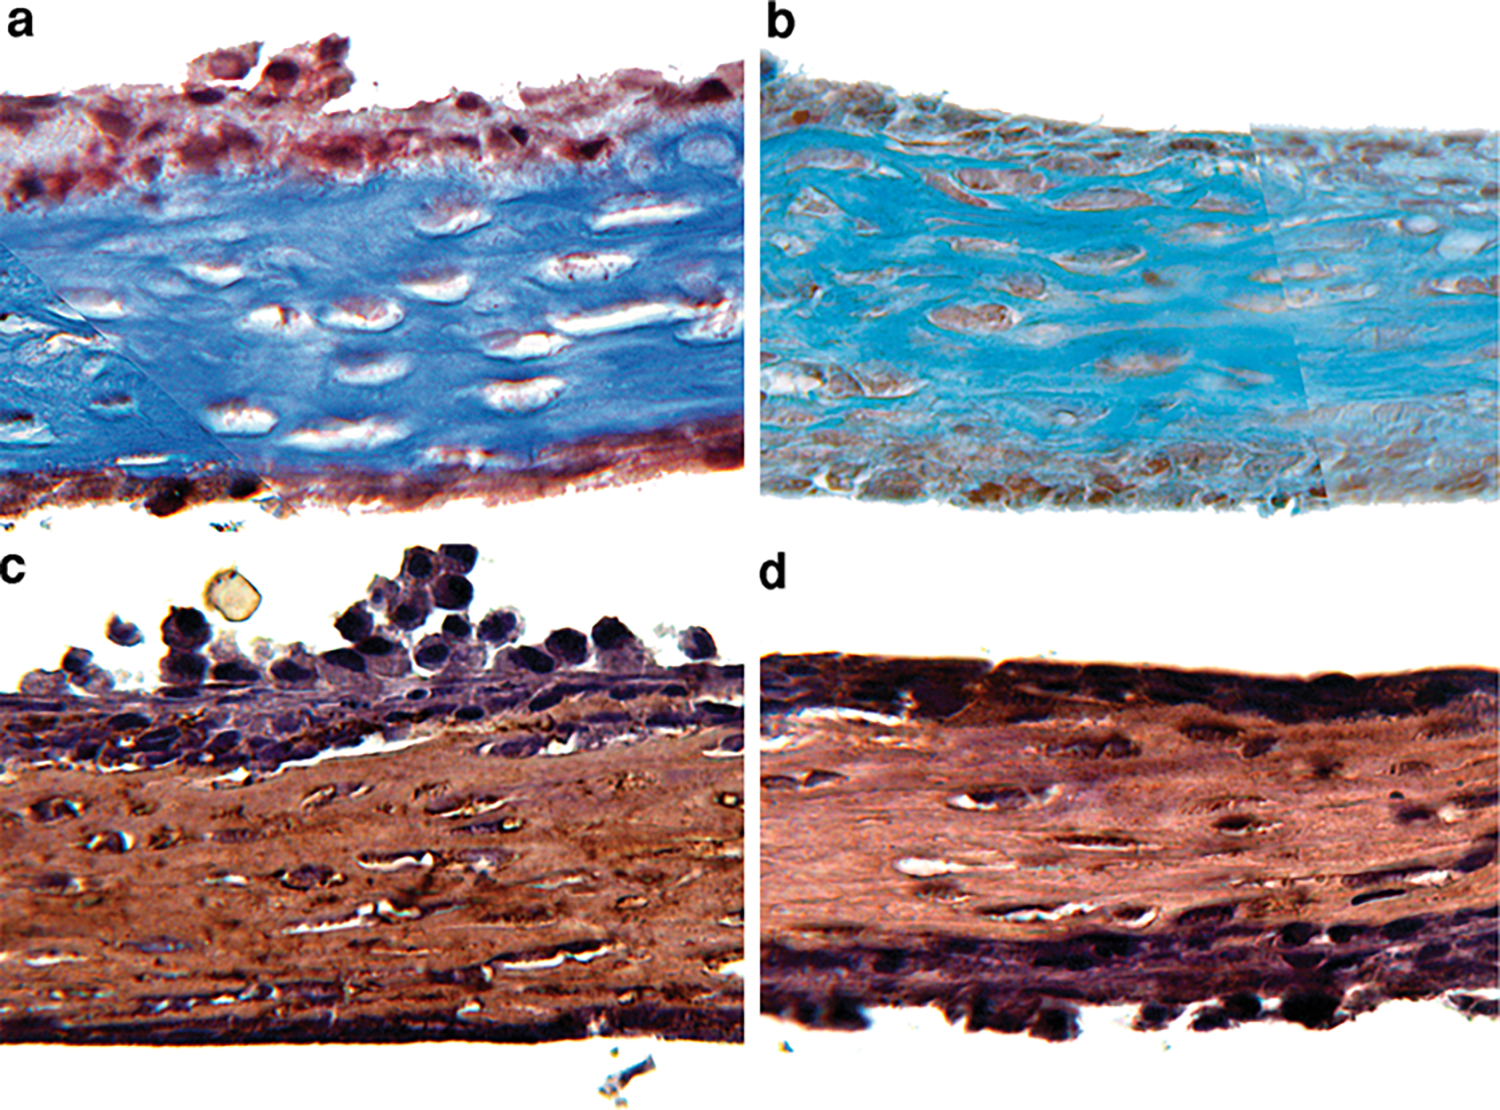
Histochemical and immunohistochemical analyses of the extracellular matrix of ossified marrow explants. a Masson trichrome staining showed the presence of a collagen-rich matrix. b Safranin O fast green staining did not indicate the presence of proteoglycans. c, d Immunohistochemical images for collagen type I and type III. The collagen-rich matrix was predominantly collagen type I (c) and weakly positive for type III (d)
Fig. 6.
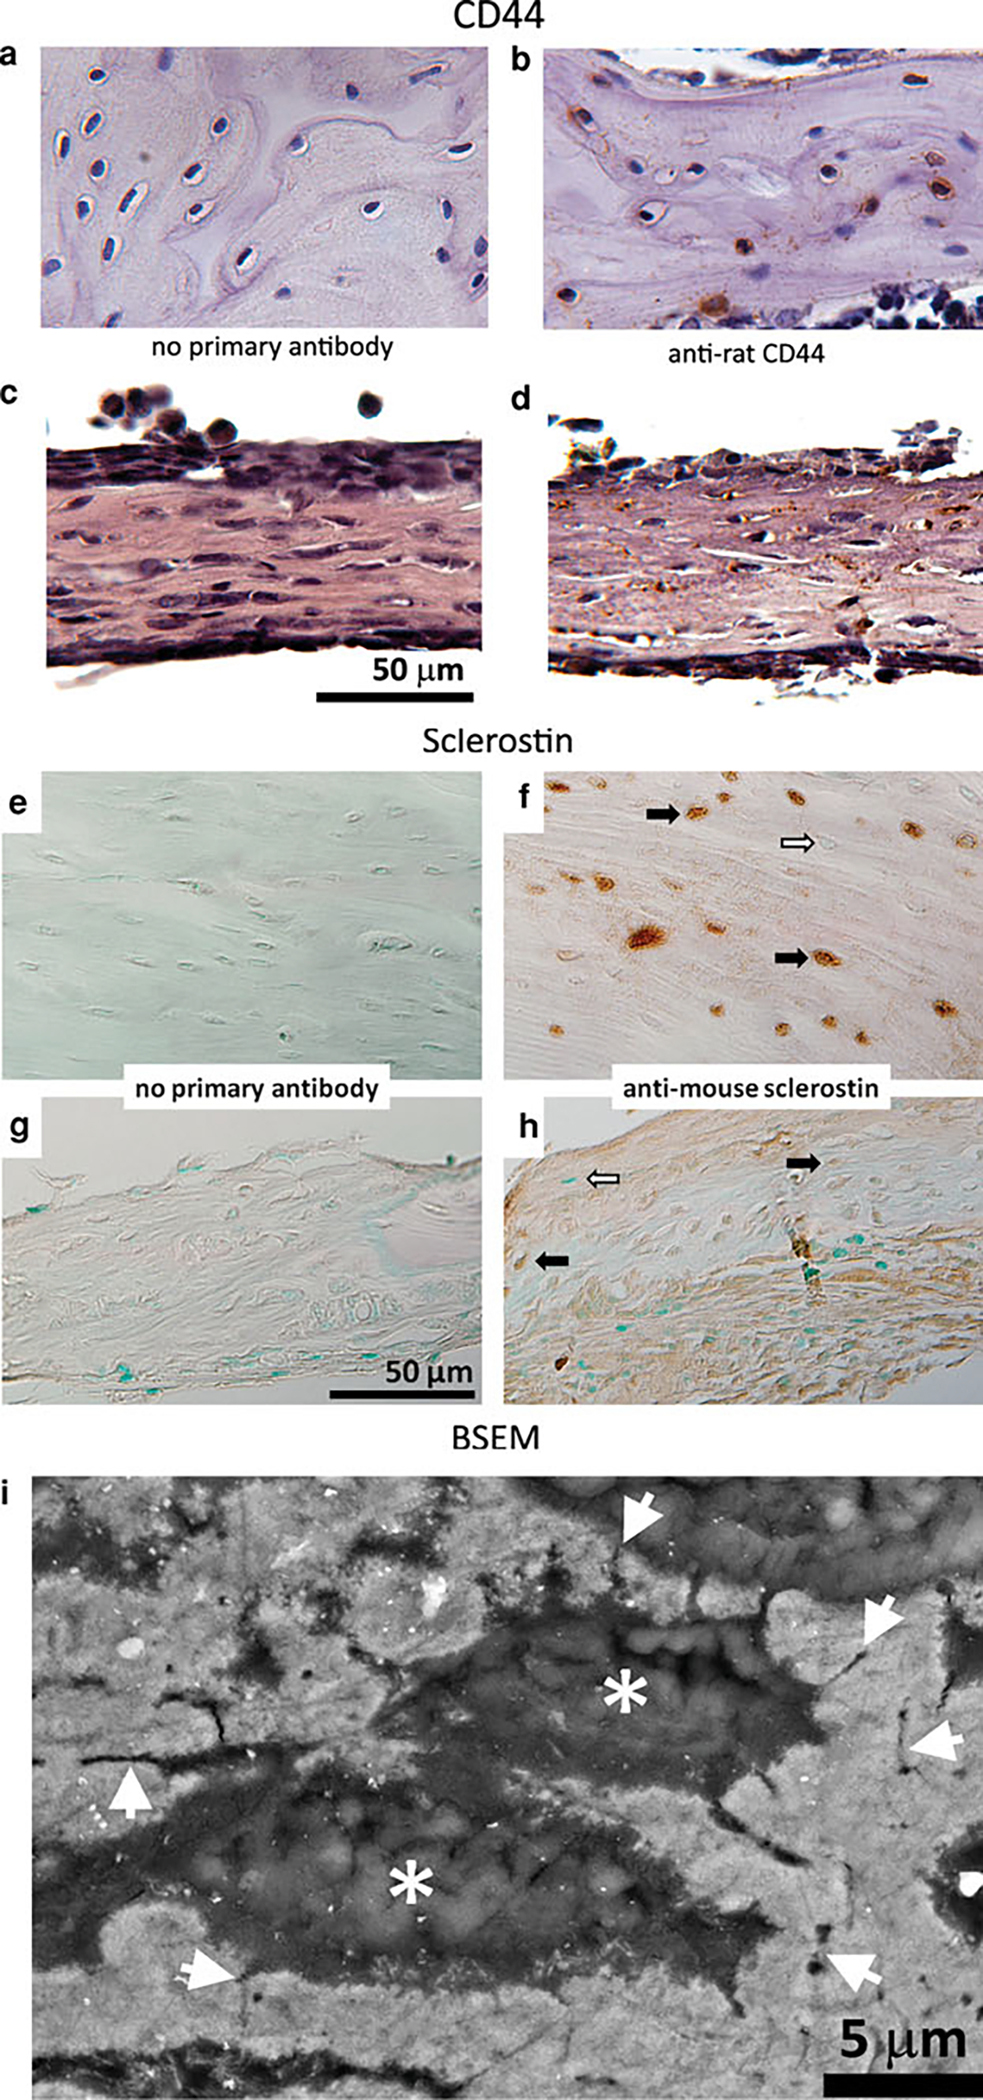
Analysis of osteocyte-like cell presence in ossified marrow explants with immunohistochemistry (CD44 and sclerostin) and high-resolution BSEM imaging. a, c, e, g Nonimmune IgG. b, d Anti-CD44 antibody. f, h Anti-sclerostin antibody. CD44 staining was observed on the surface of osteocyte-like cells embedded within the collagen-rich matrix in rat tibial tissue (b) and in ossified marrow explants (d). Sections stained without the primary antibody served as the negative control for immunohistochemical analysis of CD44 (a, c). Sclerostin expression in ossified marrow explants was detected by immunohistochemistry using an anti-murine sclerostin antibody that also recognizes the rat protein. e, f Rat tibia used as positive control. g, h Ossified bone marrow explants (demineralized) cultured for 28 days. Black and white arrows indicate sclerostin-positive and sclerostin-negative osteocytes, respectively. i BSEM image of an ossified marrow explant embedded and polished in a PMMA resin. Gray regions correspond to mineralized/ossified sections of the explants, with * indicating the location of lacunae where the osteocytes reside. Arrowheads indicate sections of canalicular extensions, which is a typical characteristic of the osteocyte cell network
CD44 staining was observed on the surface of some of the osteocyte-like cells present within the collagen matrix of native rat bone tissue (Fig. 6b) as well as in the OM explants (Fig. 6d). A negative control without the primary antibody was included to negate any nonspecific/background staining (Fig. 6a, c). The presence of osteocyte-like cells was further assessed through sclerostin staining, which showed a weak positive staining in OM explants (Fig. 6h) compared to native rat bone tissue, which displayed high reactivity with sclerostin (Fig. 6f). Negative controls without primary antibody were included for both native bone tissue (Fig. 6e) and ossified bone marrow explants (Fig. 6g). High-magnification BSEM imaging revealed the ossified regions of the marrow explants embedded in PMMA resin (light gray areas in Fig. 6i). Osteocyte lacunae were present in the ossified matrix (* in Fig. 6i) with the connecting canalicular extensions (arrowheads in Fig. 6i), which are the typical characteristics of bone tissue observed with BSEM.
Temporal Residence of STRO-1+ (MSCs) and CD45+ (Hematopoietic) Cells During Ossification
The CD45+ hematopoietic cell fraction within the marrow explants declined with the duration of the culture from >95% at day 0 to 22% by day 28. The STRO-1+ stromal cell fraction was 3% on day 0, increased to 6% at day 14, and declined to below 1% by day 28. The CD45−STRO-1− fraction was observed to progressively increase with the duration of the culture from below 2% at day 0 to >75% by day 28 (Fig. 7).
Fig. 7.
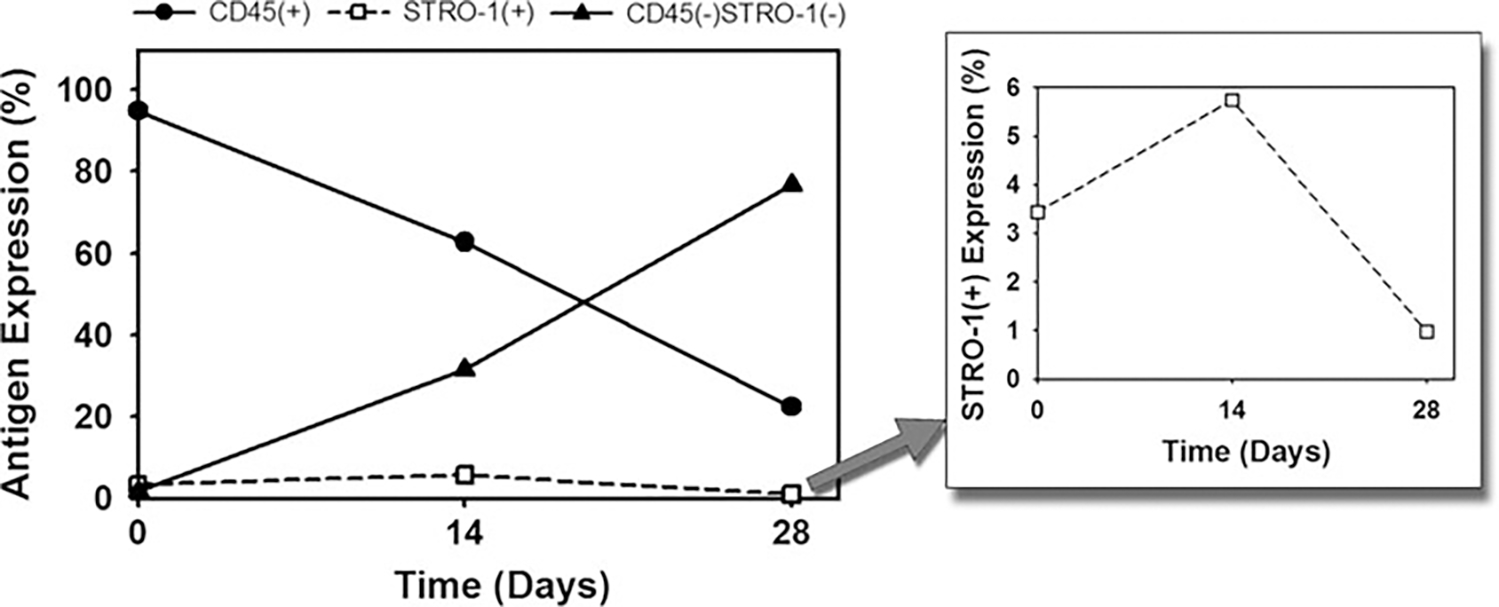
Change in the cellular residence of ossifying bone marrow explants with time by flow cytometry. The CD45+ hematopoietic fraction decreased with time. The CD45−STRO-1− fraction progressively increased with the duration of culture. The STRO-1+ mesenchymal stem cell progenitor fraction was maintained throughout the culture period, with a peak at day 14 (inset)
Mineral to Matrix Ratio of OM Explants
Raman microspectroscopic analysis indicated that OM explants displayed all of the key vibrational modes characteristic to newly forming native bone tissue (Fig. 8a) [53]. Specifically, phosphate vibrations (symmetric bending, asymmetric bending, and symmetric stretch at about 450, 650, and 959 cm−1, respectively) and type B carbonate substitution vibrations (at about 1,070 cm−1) were present. It was also observed that the apatitic mineral (symmetric stretch for 959 cm−1) to N-H bend (methyl deformation, CH2 wagging 1,450 cm−1) ratio [53] was significantly lower in OM explants relative to native bone tissue (Fig. 8b).
Fig. 8.
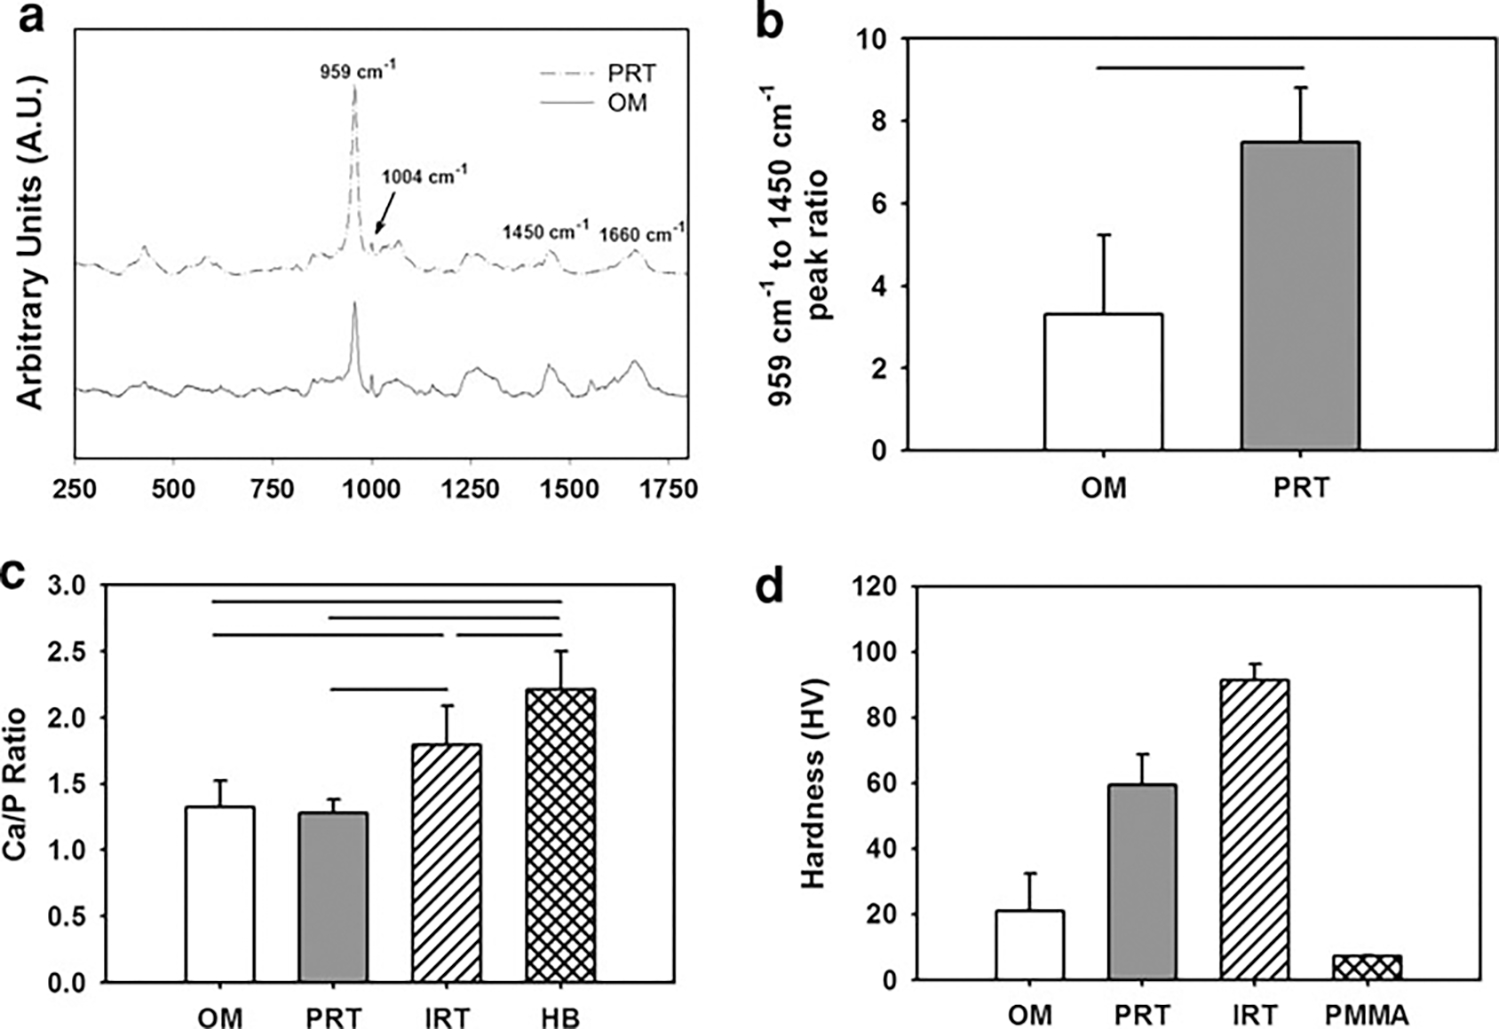
Compositional and micromechanical characterization of ossified marrow (OM) in comparison to intracortical rat tibia (IRT) and periosteal rat tibia (PRT). a Raman microspectroscopic analysis of OM in comparison to PRT indicated that OM displays all the characteristic peaks of PRT (450, 650, 959, 1,070, 1,450, and 1,660 cm−1) with a lower-intensity apatitic mineral peak (959 cm−1), which is an indicator of newly mineralizing bone matrix. b Apatitic mineral (959 cm−1) to N–H bend (1,450 cm−1) ratio indicated the crystallinity of OM (n = 10) to be lower (P < 0.05) than that of PRT (n = 3). c Comparison of the Ca/P weight ratio of OM with PRT, IRT, and human bone (HB). The Ca/P weight ratio of HB (n = 80) was significantly greater than that of IRT (n = 6), PRT (n = 5), and OM (n = 21). IRT displayed a greater Ca/P ratio than OM, whereas that of PRT was not statistically different from that of OM. Lines connecting individual groups indicate statistical significance (P < 0.05). (Ca/P weight ratio of HB was based on literature [63].) d HV values for OM in comparison to PRT and IRT measured by microindentation tests. IRT displayed a significantly higher HV compared to PRT as well as OM. The HV value of the embedding resin (PMMA) was included for comparison purposes. All groups displayed in the figure are significantly different from each other (P < 0.05)
Ca/P Weight Ratio Analysis of OM Explants
Ca/P weight ratio analysis was conducted by EDS on the OM, native PRT, and native IRT (Fig. 8c). OM displayed both Ca and P peaks and had a Ca/P weight value of 1.32 (SD = 0.20, n = 21), which was significantly less than IRT (1.79, SD = 0.30, n = 6) and comparable to PRT (1.28, SD = 0.10, n = 5) (Fig. 8c). Human bone has been reported to have a Ca/P weight ratio of 2.21 (SD = 0.29, n = 80, ages 15–55) [60], which was significantly greater than that of native rat tibia and OM.
Microhardness of OM Explants in Comparison to Periosteal and Intracortical Bone Tissue
A microindentation test indicated that IRT (n = 10) had a significantly greater HV value than PRT (n = 10) and OM (n = 26) (Fig. 8d). The hardness of the embedding resin (PMMA, n = 10) was also measured for comparison purposes and was observed to be significantly less than all the groups (Fig. 8d).
Discussion
The results of this study showed that (1) rat marrow tissue ossified inherently in vitro without the addition of excipient osteoinductive factors in both pellet culture and explant culture conditions, (2) 3D organotypic explant culture resulted in the greatest level of inherent in vitro ossification of marrow tissue, (3) OM explants formed a visible 3D plate-like bone tissue with viable osteoblast-like cells layering the mineralized matrix and viable osteocyte-like cells (CD44+ and sclerostin+) embedded within the ossified matrix, (4) the marrow explant ossification process supported the residence of STRO-1+ MSCs and CD45+ hematopoietic cells throughout the culture period, (5) the Ca/P weight ratio was comparable between OM tissue and newly forming native bone tissue (periosteal tibia), (6) OM tissue displayed all of the characteristic Raman peaks of bone tissue with a lower mineral to matrix ratio, and (7) the microhardness of OM tissue was less than that of native bone tissue.
Bone formation involves the differentiation of MSCs or osteoblast progenitors into osteoblasts, which are responsible for producing the mineralized bone matrix [63, 64]. The in vitro monolayer models (2D) of bone formation that are aimed at studying the differentiation into osteoblastic phenotype generally employ various purification steps to isolate the progenitors from sources such as bone marrow [65]. These purification steps include isolation of the adherent multipotent MSCs by eliminating the nonadherent hematopoietic stem cells (HSCs) and the osteopoietic accessory cells (OACs) [12]. In addition, recent evidence indicates that the nonadherent cellular population of marrow tissue includes complementary MSCs, which also display differentiation potential to multiple phenotypes [66]. In order for the purified adherent population of cells to display osteogenic potential, a variety of osteoinductive factors (e.g., dexamethasone and BMPs) are added in a range of concentrations [18, 67]. It has been suggested that the presence of other cell types (i.e., HSCs, OACs) plays a role in the differentiation of MSCs to osteoprogenitors and osteoblasts and that these cell types regulate each other’s functions [7–16]. These cell types are housed cumulatively in bone marrow tissue, making it a critical component in bone regeneration [68–70]. Previous studies have demonstrated that bone marrow explants inherently undergo ossification in vivo [36, 71] or in vitro without the addition of excipient osteoinductive factors [3, 37, 72]. In fact, we have shown that when the cellular integrity of intact bone marrow tissue is disrupted and the cells are cultured according to the traditional monolayer culture methods (i.e., eliminating the nonadherent cells with medium change), the inherent ossification potential of bone marrow tissue is lost (Fig. 2) [3]. Similarly, when the structural integrity of marrow tissue explants was compromised through dispersion and homogenization, in vitro inherent ossification potential of marrow tissue decreased significantly as observed in pellet culture conditions (Fig. 2). Therefore, the in vitro marrow explant culture system described here demonstrates a high potential of inherent ossification of marrow tissue by preserving both the cellular and structural integrity, therefore allowing it to be used as a model to study osteogenesis and to develop therapeutic strategies for skeletal reconstruction.
Histological assessment of the Masson’s trichrome-stained ossifying explant sections revealed collagen-rich regions (blue color) starting at day 14 (Fig. 4b), which was observed to correspond to the ossified volume of the explants as detected by μCT conducted at day 28 (Fig. 3b). These collagen-rich sections (Figs. 4c, 5a) were verified to be mostly type I collagen (Fig. 5c), which is the most abundant type in bone tissue. In addition to type I collagen, type III collagen was observed at a lower extent in the ossified marrow tissue (Fig. 5d). Collagen type III is known to be expressed by early-stage osteoblasts during the synthesis of woven bone tissue, which is then replaced by the osteoid (rich in collagen type I) during the remodeling phase, reducing the presence of collagen type III dramatically [73]. Therefore, the low-level presence of type III collagen in ossified marrow explant is an indicator that the type of bone present is woven bone.
The ossified matrix was observed to be surrounded by or in contact with unmineralized tissue (Fig. 4c, d). In Fig. 4c, the nonossified layer presents a weakly cellular tissue structure, which is evidenced by a low number of stained nuclei. This nonossified layer does not display a collagenous matrix per Masson’s trichrome staining (Figs. 4c, 5a) and displays absence of collagen I (Fig. 5c). Therefore, it may be suggested that the nonossified layer in marrow explants is rich in cells of nonmesenchymal origin, which are possibly hematopoietic cells such as platelets. Flow-cytometric analysis further indicated that the number of hematopoietic cells decreased en masse over time (Fig. 7), which can be explained by the increasing volume of ossified tissue over time that replaces the nonossified marrow. Further analysis is needed to clarify the identity of the cells residing in the nonossified sections of the marrow explants.
Viable osteoblast-like and fibroblast-like cells were apparent surrounding the ossification site in both the lower and upper sections (Fig. 4d). Therefore, it can be postulated that the ossified marrow emerges in two sheets of unmineralized layers, which support the presence of osteoblast-like cells. The osteoblast-like cells that are present in these layers were observed to be in the process of laying the mineralized matrix and getting trapped within the matrix to become osteocytes. Therefore, self-inductive ossification of marrow tissue may be dependent on the presence of surrounding nonmineralized compartments that potentially support the process of osteogenesis. The interaction and the dependence between the nonmineralized and mineralized components of marrow ossification warrant further investigation.
Viable CD44+ osteocyte-like cells were observed to be present in the collagen-rich ossified matrix (Fig. 6d) with typical lacunae and primitive canalicular extensions (Fig. 6i). In addition to CD44 immunohistochemical analysis, weakly positive sclerostin reactivity was observed in the osteocyte-like cells embedded in ossified marrow explants, which is an indicator of a newly forming bone tissue with early-stage osteocytes (Fig. 6h). Cumulatively, these results indicate that marrow explants form a 3D plate-like ossified matrix (Fig. 3), which houses the basic cellular elements (osteoblasts and osteocytes) of bone tissue.
There are two types of bone formation: endochondral ossification and intramembranous ossification. It is known that a fracture site that is not well stabilized (prone to motion) tends to heal through endochondral ossification [74, 75], in which ossification is preceded by the formation of cartilaginous matrix. On the other hand, a well-stabilized fracture site undergoes healing through intramembranous ossification, in which mesenchymal stem cells directly differentiate into osteoblasts and form an ossified matrix [28, 29]. Intramembranous ossification is critical in skeletal development and regeneration and takes place in the periosteum, in the regeneration of the endosteum, and in parts of the cranium, scapula, and clavicles [76–80]. It was recently shown that healing through intramembranous ossification results in a stiffer and faster-healed bone compared to endochondral ossification in mice [28]. Histological analysis of the in vitro ossified marrow explants with safranin O/fast green staining did not display (Fig. 5b) the presence of proteoglycans at all time points, which can be found abundantly in cartilaginous matrix. This finding is expected considering the fact that the in vitro ossifying marrow tissue in this study did not experience any mechanical stimulation and, as described above, intramembranous ossification is generally observed in well-stabilized fracture sites with minimal deformation of the fracture callus [28, 29]. Therefore, it would be reasonable to expect endochondral ossification if mechanical deformations at the level that is observed at nonstabilized fracture sites are applied during in vitro ossification of marrow tissue. It should be noted that intramembranous ossification commonly takes place in various locations in the skeletal system [76–80] and produces a stronger and accelerated healing of the fracture than endochondral ossification [28]. Even though there is a limited number of in vivo animal models of intramembranous ossification [28, 29], there seems to be a lack of in vitro models that effectively represent the complex natural environment of this process. Therefore, understanding the biology of intramembranous healing via such in vitro models would allow development of biological therapies for improving fracture healing.
Earlier in vivo studies of ectopically implanted explants demonstrated that the cells of hematopoietic origin left the marrow explants [71, 81]. Our study supports this observation, which is evident by the decrease in the CD45+ hematopoietic cell fraction throughout the culture period (Fig. 7). The STRO-1+ MSC fraction was maintained throughout the culture period, indicating the perennial presence of a stem cell progenitor population in our culture system that gave rise to the differentiated cells. By the end of the culture, a large fraction (>75%) of the cells were negative for both CD45 and STRO-1, suggesting the presence of committed/differentiated cells of mesenchymal origin, including osteoblasts and osteocytes (Fig. 7).
In this study, the Ca/P weight ratio of ossified marrow was compared with human bone tissue (value obtained from literature [60]) and rat bone tissue in terms of crystalline level [59]. It was previously shown that the Ca/P weight ratio increases in osteoblast cultures (30 days long) with time, suggesting maturation of crystal growth, which was supported by X-ray and infrared spectroscopic analyses [59]. Our results indicated that the Ca/P weight ratio, and hence the maturity, of the ossified marrow tissue was comparable to that of the newly forming bone tissue (i.e., rat tibial diaphysis periosteal surface [58]) (Fig. 8c). In attestation, Raman microspectroscopy showed that the crystals making up the mineralized component of the marrow explants were carbonated apatite that displayed all the key vibrational modes typical of those observed in natural bone tissue (rat tibial periosteal diaphysis) (Fig. 8a). The phosphate symmetric stretch vibrations from marrow explant crystals appeared at the same wavelength as that of periosteal bone (959 cm−1), indicating that the maturity of crystals in explants was comparable to that of early-stage bone. However, it was also observed (Raman microspectroscopy) that the 959 cm−1 (apatitic mineral, symmetric stretch for ) to 1,450 cm−1 (N-H bending, methyl deformation, CH2 wagging) ratio was lower in ossified marrow explants relative to native bone tissue (Fig. 8b), which is an indicator of lower mineralization and, hence, newly ossifying bone tissue [53]. In addition, since the spectra were collected under similar data-integration times, the lower phosphate band intensities in the case of ossified marrow explants at ×50 high magnification objective indicates that the amount of mineral in marrow explants was smaller than that of bone.
Microscopic hardness of normal bone tissue has been suggested to be a direct indicator of its degree of mineralization, and an increase in microhardness has been associated with maturation of the ossified tissue [61]. Therefore, the HV value of the ossified marrow explants was used to estimate the maturity and compare with PRT (newly formed periosteal bone) and IRT (relatively more mature intracortical bone). The results based on the hardness measurements indicated that IRT and PRT were stiffer (hence more mineralized) than ossified marrow (Fig. 8d), which is expected considering that the culture duration of the marrow explants (28 days) was significantly less than the age of the donor rats (80–90 days) of the tested native bone samples [57]. It should also be noted that the ossified marrow explants display a woven bone structure, whereas the IRT and PRT are lamellar bone. Therefore, the maturity, and hence the microhardness, of the ossified marrow explants is expected to increase with longer culture durations, which warrants further investigation.
The outcomes of this study showed that rat bone marrow tissue inherently ossified in vitro under explant culture conditions with the typical characteristics of newly forming native bone tissue. These features included similar histological, morphological, and compositional properties including distinctive Raman peaks and a typical Ca/P weight ratio. It was also observed that viable osteocyte-like and osteoblast-like cells were present in the ossified marrow matrix. Therefore, the inherent in vitro ossification of bone marrow explants can be useful as a scaffold-free, multicellular, and 3D model to study osteogenesis in terms of morphological and compositional differentiation, cellular composition, mechanoresponsiveness, and gene and protein expression. This platform may also be useful for developing in vitro high-throughput drug-screening models of osteogenesis for pharmaceutical research programs [34, 82].
Acknowledgements
This study was funded by a grant from the Musculoskeletal Transplant Foundation. We thank David VanSickle, PhD, DVM, and Paul Snyder, PhD, DVM, for their insights on the histological results. We also thank Purdue Life Science Microscopy Facility director Debby Sherman for her support and help with the EDS and BSEM systems.
Footnotes
The authors have stated that they have no conflict of interest.
Contributor Information
Umut A. Gurkan, Center for Biomedical Engineering at Brigham and Women’s Hospital, Harvard Medical School, Harvard-MIT Division of Health Sciences and Technology, Boston, MA, USA
Vipuil Kishore, Weldon School of Biomedical Engineering, Purdue University, West Lafayette, IN, USA.
Keith W. Condon, Department of Anatomy and Cell Biology, Indiana University School of Medicine, Indianapolis, IN, USA
Teresita M. Bellido, Department of Anatomy and Cell Biology, Indiana University School of Medicine, Indianapolis, IN, USA
Ozan Akkus, Weldon School of Biomedical Engineering, Purdue University, West Lafayette, IN, USA.
References
- 1.Gerstenfeld LC, Cullinane DM, Barnes GL, Graves DT, Einhorn TA (2003) Fracture healing as a post-natal developmental process: molecular, spatial, and temporal aspects of its regulation. J Cell Biochem 88:873–884 [DOI] [PubMed] [Google Scholar]
- 2.Barnes GL, Kostenuik PJ, Gerstenfeld LC, Einhorn TA (1999) Growth factor regulation of fracture repair. J Bone Miner Res 14:1805–1815 [DOI] [PubMed] [Google Scholar]
- 3.Gurkan UA, Gargac J, Akkus O (2010) The sequential production profiles of growth factors and their relations to bone volume in ossifying bone marrow explants. Tissue Eng A 16:2295–2306 [DOI] [PubMed] [Google Scholar]
- 4.Palomares KTS, Gleason RE, Mason ZD, Cullinane DM, Einhorn TA, Gerstenfeld LC, Morgan EF (2009) Mechanical stimulation alters tissue differentiation and molecular expression during bone healing. J Orthop Res 27:1123–1132 [DOI] [PMC free article] [PubMed] [Google Scholar]
- 5.Gurkan UA, Akkus O (2008) The mechanical environment of bone marrow: a review. Ann Biomed Eng 36:1978–1991 [DOI] [PubMed] [Google Scholar]
- 6.Gurkan UA, Krueger A, Akkus O (2010) Ossifying bone marrow explant culture as a three-dimensional mechanoresponsive in vitro model of osteogenesis. Tissue Eng A 17(3–4):417–428 [DOI] [PubMed] [Google Scholar]
- 7.Jung YG, Song JH, Shiozawa Y, Wang JC, Wang Z, Williams B, Havens A, Schneider A, Ge CX, Franceschi RT, McCauley LK, Krebsbach PH, Taichman RS (2008) Hematopoietic stem cells regulate mesenchymal stromal cell induction into osteoblasts thereby participating in the formation of the stem cell niche. Stem Cells 26:2042–2051 [DOI] [PMC free article] [PubMed] [Google Scholar]
- 8.Moioli EK, Clark PA, Chen M, Dennis JE, Erickson HP, Gerson SL, Mao JJ (2008) Synergistic actions of hematopoietic and mesenchymal stem/progenitor cells in vascularizing bioengineered tissues. Plos One 3:e3922. [DOI] [PMC free article] [PubMed] [Google Scholar]
- 9.Wu JY, Scadden DT, Kronenberg HM (2009) Role of the osteoblast lineage in the bone marrow hematopoietic niches. J Bone Miner Res 24:759–764 [DOI] [PMC free article] [PubMed] [Google Scholar]
- 10.Porter RL, Calvi LM (2008) Communications between bone cells and hematopoietic stem cells. Arch Biochem Biophys 473:193–200 [DOI] [PMC free article] [PubMed] [Google Scholar]
- 11.Eipers PG, Kale S, Taichman RS, Pipia GG, Swords NA, Mann KG, Long MW (2000) Bone marrow accessory cells regulate human bone precursor cell development. Exp Hematol 28:815–825 [DOI] [PubMed] [Google Scholar]
- 12.van den Dolder J, Jansen JA (2007) Enrichment of osteogenic cell populations from rat bone marrow stroma. Biomaterials 28:249–255 [DOI] [PubMed] [Google Scholar]
- 13.Taichman RS, Reilly MJ, Emerson SG (1996) Human osteoblasts support human hematopoietic progenitor cells in in vitro bone marrow cultures. Blood 87:518–524 [PubMed] [Google Scholar]
- 14.Taichman RS, Reilly MJ, Verma RS, Ehrenman K, Emerson SG (2001) Hepatocyte growth factor is secreted by osteoblasts and cooperatively permits the survival of haematopoietic progenitors. Br J Haematol 112:438–448 [DOI] [PubMed] [Google Scholar]
- 15.de Barros APDN, Takiya CM, Garzoni LR, Leal-Ferreira ML, Dutra HS, Chiarini LB, Meirelles MN, Borojevic R, Rossi MID (2010) Osteoblasts and bone marrow mesenchymal stromal cells control hematopoietic stem cell migration and proliferation in 3D in vitro model. Plos One 5:e9093. [DOI] [PMC free article] [PubMed] [Google Scholar]
- 16.Chitteti BR, Cheng Y-H, Poteat B, Rodriguez-Rodriguez S, Goebel WS, Carlesso N, Kacena MA, Srour EF (2010) Impact of interactions of cellular components of the bone marrow microenvironment on hematopoietic stem and progenitor cell function. Blood 115:3239–3248 [DOI] [PMC free article] [PubMed] [Google Scholar]
- 17.Yamamoto N, Furuya K, Hanada K (2002) Progressive development of the osteoblast phenotype during differentiation of osteoprogenitor cells derived from fetal rat calvaria: model for in vitro bone formation. Biol Pharm Bull 25:509–515 [DOI] [PubMed] [Google Scholar]
- 18.Huang ZN, Nelson ER, Smith RL, Goodman SB (2007) The sequential expression profiles of growth factors from osteroprogenitors to osteoblasts in vitro. Tissue Eng 13:2311–2320 [DOI] [PubMed] [Google Scholar]
- 19.Beresford JN, Graves SE, Smoothy CA (1993) Formation of mineralized nodules by bone derived cells in vitro—a model of bone formation. Am J Med Genet 45:163–178 [DOI] [PubMed] [Google Scholar]
- 20.Malaval L, Modrowski D, Gupta AK, Aubin JE (1994) Cellular expression of bone-related proteins during in-vitro osteogenesis in rat bone-marrow stromal cell cultures. J Cell Physiol 158:555–572 [DOI] [PubMed] [Google Scholar]
- 21.Bodine PVN, Komm BS (2002) Tissue culture models for studies of hormone and vitamin action in bone cells. Vitam Horm 64:101–151 [DOI] [PubMed] [Google Scholar]
- 22.Tao H, Minkin C (1994) The effects of 1,25-dihydroxyvitamin D3 on osteoclast formation in fetal mouse metatarsal organ cultures. Bone 15:217–223 [DOI] [PubMed] [Google Scholar]
- 23.Gupta AK, Eshraghi Y, Gliniak C, Gosain AK (2010) Nonviral transfection of mouse calvarial organ in vitro using accell-modified siRNA. Plast Reconstr Surg 125:494–501 [DOI] [PubMed] [Google Scholar]
- 24.Cho TJ, Gerstenfeld LC, Einhorn TA (2002) Differential temporal expression of members of the transforming growth factor beta superfamily during murine fracture healing. J Bone Miner Res 17:513–520 [DOI] [PubMed] [Google Scholar]
- 25.Le AX, Miclau T, Hu D, Helms JA (2001) Molecular aspects of healing in stabilized and non-stabilized fractures. J Orthop Res 19:78–84 [DOI] [PubMed] [Google Scholar]
- 26.Tatsuyama K, Maezawa Y, Baba H, Imamura Y, Fukuda M (2000) Expression of various growth factors for cell proliferation and cytodifferentiation during fracture repair of bone. Eur J Histochem 44:269–278 [PubMed] [Google Scholar]
- 27.Muraglia A, Martin I, Cancedda R, Quarto R (1998) A nude mouse model for human bone formation in unloaded conditions. Bone 22:131s–134s [DOI] [PubMed] [Google Scholar]
- 28.Histing T, Garcia P, Matthys R, Leidinger M, Holstein JH, Kristen A, Pohlemann T, Menger MD (2010) An internal locking plate to study intramembranous bone healing in a mouse femur fracture model. J Orthop Res 28:397–402 [DOI] [PubMed] [Google Scholar]
- 29.Thompson Z, Miclau T, Hu D, Helms JA (2002) A model for intramembranous ossification during fracture healing. J Orthop Res 20:1091–1098 [DOI] [PubMed] [Google Scholar]
- 30.Birgersdotter A, Sandberg R, Ernberg I (2005) Gene expression perturbation in vitro—a growing case for three-dimensional (3D) culture systems. Semin Cancer Biol 15:405–412 [DOI] [PubMed] [Google Scholar]
- 31.Yamada KM, Cukierman E (2007) Modeling tissue morphogenesis and cancer in 3D. Cell 130:601–610 [DOI] [PubMed] [Google Scholar]
- 32.Tibbitt MW, Anseth KS (2009) Hydrogels as extracellular matrix mimics for 3D cell culture. Biotechnol Bioeng 103:655–663 [DOI] [PMC free article] [PubMed] [Google Scholar]
- 33.Mazzoleni G, Di Lorenzo D, Steimberg N (2009) Modelling tissues in 3D: the next future of pharmaco-toxicology and food research? Genes Nutr 4:13–22 [DOI] [PMC free article] [PubMed] [Google Scholar]
- 34.Kunz-Schughart LA, Freyer JP, Hofstaedter F, Ebner R (2004) The use of 3-D cultures for high-throughput screening: the multicellular spheroid model. J Biomol Screen 9:273–285 [DOI] [PubMed] [Google Scholar]
- 35.Petersen MC, Lazar J, Jacob HJ, Wakatsuki T (2007) Tissue engineering: a new frontier in physiological genomics. Physiol Genom 32:28–32 [DOI] [PubMed] [Google Scholar]
- 36.Tavassoli M, Crosby WH (1968) Transplantation of marrow to extramedullary sites. Science 161:54–56 [DOI] [PubMed] [Google Scholar]
- 37.Luria EA, Owen ME, Friedenstein AJ, Morris JF, Kuznetsow SA (1987) Bone formation in organ cultures of bone marrow. Cell Tissue Res 248:449–454 [DOI] [PubMed] [Google Scholar]
- 38.Beresford JN, Joyner CJ, Devlin C, Triffitt JT (1994) The effects of dexamethasone and 1,25-dihydroxyvitamin D3 on osteogenic differentiation of human marrow stromal cells in-vitro. Arch Oral Biol 39:941–947 [DOI] [PubMed] [Google Scholar]
- 39.Jaiswal N, Haynesworth SE, Caplan AI, Bruder SP (1997) Osteogenic differentiation of purified, culture-expanded human mesenchymal stem cells in vitro. J Cell Biochem 64:295–312 [PubMed] [Google Scholar]
- 40.Morgan EF, Mason ZD, Chien KB, Pfeiffer AJ, Barnes GL, Einhorn TA, Gerstenfeld LC (2009) Micro-computed tomography assessment of fracture healing: relationships among callus structure, composition, and mechanical function. Bone 44:335–344 [DOI] [PMC free article] [PubMed] [Google Scholar]
- 41.Muller R, Van Campenhout H, Van Damme B, Van Der Perre G, Dequeker J, Hildebrand T, Ruegsegger P (1998) Morphometric analysis of human bone biopsies: a quantitative structural comparison of histological sections and micro-computed tomography. Bone 23:59–66 [DOI] [PubMed] [Google Scholar]
- 42.Oest ME, Dupont KM, Kong HJ, Mooney DJ, Guldberg RE (2007) Quantitative assessment of scaffold and growth factor-mediated repair of critically sized bone defects. J Orthop Res 25:941–950 [DOI] [PubMed] [Google Scholar]
- 43.Majewski M, Ochsner PE, Liu F, Fluckiger R, Evans CH (2009) Accelerated healing of the rat Achilles tendon in response to autologous conditioned serum. Am J Sports Med 37:2117–2125 [DOI] [PubMed] [Google Scholar]
- 44.Noonan KJ, Stevens JW, Tammi R, Tammi M, Hernandez JA, Midura RJ (1996) Spatial distribution of CD44 and hyaluronan in the proximal tibia of the growing rat. J Orthop Res 14:573–581 [DOI] [PubMed] [Google Scholar]
- 45.Bellido T, Ali AA, Gubrij I, Plotkin LI, Fu Q, O’Brien CA, Manolagas SC, Jilka RL (2005) Chronic elevation of parathyroid hormone in mice reduces expression of sclerostin by osteocytes: a novel mechanism for hormonal control of osteoblastogenesis. Endocrinology 146:4577–4583 [DOI] [PubMed] [Google Scholar]
- 46.O’Brien CA, Plotkin LI, Galli C, Goellner JJ, Gortazar AR, Allen MR, Robling AG, Bouxsein M, Schipani E, Turner CH, Jilka RL, Weinstein RS, Manolagas SC, Bellido T (2008) Control of bone mass and remodeling by PTH receptor signaling in osteocytes. Plos One 3:e2942. [DOI] [PMC free article] [PubMed] [Google Scholar]
- 47.Ralph SJ, Thomas ML, Morton CC, Trowbridge IS (1987) Structural variants of human T200 glycoprotein (leukocyte-common antigen). EMBO J 6:1251–1257 [DOI] [PMC free article] [PubMed] [Google Scholar]
- 48.De Ugarte DA, Alfonso Z, Zuk PA, Elbarbary A, Zhu M, Ashjian P, Benhaim P, Hedrick MH, Fraser JK (2003) Differential expression of stem cell mobilization-associated molecules on multi-lineage cells from adipose tissue and bone marrow. Immunol Lett 89:267–270 [DOI] [PubMed] [Google Scholar]
- 49.Dennis JE, Carbillet JP, Caplan AI, Charbord P (2002) The STRO-1+ marrow cell population is multipotential. Cells Tissues Organs 170:73–82 [DOI] [PubMed] [Google Scholar]
- 50.Gronthos S, Graves SE, Ohta S, Simmons PJ (1994) The Stro-1+ fraction of adult human bone-marrow contains the osteogenic precursors. Blood 84:4164–4173 [PubMed] [Google Scholar]
- 51.Simmons PJ, Torokstorb B (1991) Identification of stromal cell precursors in human bone-marrow by a novel monoclonal-antibody, Stro-1. Blood 78:55–62 [PubMed] [Google Scholar]
- 52.Byers RJ, Brown J, Brandwood C, Wood P, Staley W, Hainey L, Freemont AJ, Hoyland JA (1999) Osteoblastic differentiation and mRNA analysis of STRO-1-positive human bone marrow stromal cells using primary in vitro culture and poly (A) PCR. J Pathol 187:374–381 [DOI] [PubMed] [Google Scholar]
- 53.Wang CY, Wang Y, Huffman NT, Cui CY, Yao XM, Midura S, Midura RJ, Gorski JP (2009) Confocal laser Raman microspectroscopy of biomineralization foci in UMR 106 osteoblastic cultures reveals temporally synchronized protein changes preceding and accompanying mineral crystal deposition. J Biol Chem 284:7100–7113 [DOI] [PMC free article] [PubMed] [Google Scholar]
- 54.Nandagawali ST, Yerramshetty JS, Akkus O (2007) Raman imaging for quantification of the volume fraction of biodegradable polymers in histological preparations. J Biomed Mater Res A 82:611–617 [DOI] [PubMed] [Google Scholar]
- 55.Yerramshetty JS, Akkus O (2008) The associations between mineral crystallinity and the mechanical properties of human cortical bone. Bone 42:476–482 [DOI] [PubMed] [Google Scholar]
- 56.Yerramshetty JS, Lind C, Akkus O (2006) The compositional and physicochemical homogeneity of male femoral cortex increases after the sixth decade. Bone 39:1236–1243 [DOI] [PubMed] [Google Scholar]
- 57.Donnelly E, Boskey AL, Baker SP, van der Meulen MCH (2010) Effects of tissue age on bone tissue material composition and nanomechanical properties in the rat cortex. J Biomed Mater Res A 92A:1048–1056 [DOI] [PMC free article] [PubMed] [Google Scholar]
- 58.Frost HM, Jee WSS (1992) On the rat model of human osteopenias and osteoporosis. Bone Miner 18:227–236 [DOI] [PubMed] [Google Scholar]
- 59.Rohde M, Mayer H (2007) Exocytotic process as a novel model for mineralization by osteoblasts in vitro and in vivo determined by electron microscopic analysis. Calcif Tissue Int 80:323–336 [DOI] [PubMed] [Google Scholar]
- 60.Tzaphlidou M, Zaichick V (2004) Sex and age related Ca/P ratio in cortical bone of iliac crest of healthy humans. J Radioanal Nuclear Chem 259:347–349 [Google Scholar]
- 61.Weaver JK (1966) Microscopic hardness of bone. J Bone Joint Surg Am 48:273–288 [PubMed] [Google Scholar]
- 62.Dall’Ara E, Ohman C, Baleani M, Viceconti M (2007) The effect of tissue condition and applied load on Vickers hardness of human trabecular bone. J Biomech 40:3267–3270 [DOI] [PubMed] [Google Scholar]
- 63.Bruder SP, Fink DJ, Caplan AI (1994) Mesenchymal stem cells in bone development, bone repair, and skeletal regeneration therapy. J Cell Biochem 56:283–294 [DOI] [PMC free article] [PubMed] [Google Scholar]
- 64.Caplan AI (1991) Mesenchymal stem cells. J Orthop Res 9:641–650 [DOI] [PubMed] [Google Scholar]
- 65.Ohishi M, Schipani E (2010) Bone marrow mesenchymal stem cells. J Cell Biochem 109:277–282 [DOI] [PubMed] [Google Scholar]
- 66.Wan C, He Q, McCaigue M, Marsh D, Li G (2006) Nonadherent cell population of human marrow culture is a complementary source of mesenchymal stem cells (MSCs). J Orthop Res 24:21–28 [DOI] [PubMed] [Google Scholar]
- 67.Satomura K, Nagayama M (1991) Ultrastructure of mineralized nodules formed in rat bone-marrow stromal cell culture in vitro. Acta Anat 142:97–104 [DOI] [PubMed] [Google Scholar]
- 68.Devine MJ, Mierisch CM, Jang E, Anderson PC, Balian G (2002) Transplanted bone marrow cells localize to fracture callus in a mouse model. J Orthop Res 20:1232–1239 [DOI] [PubMed] [Google Scholar]
- 69.Granero-Molto F, Weis JA, Miga MI, Landis B, Myers TJ, O’Rear L, Longobardi L, Jansen ED, Mortlock DP, Spagnoli A (2009) Regenerative effects of transplanted mesenchymal stem cells in fracture healing. Stem Cells 27:1887–1898 [DOI] [PMC free article] [PubMed] [Google Scholar]
- 70.Muschler GF, Nitto H, Boehm CA, Easley KA (2001) Age- and gender-related changes in the cellularity of human bone marrow and the prevalence of osteoblastic progenitors. J Orthop Res 19:117–125 [DOI] [PubMed] [Google Scholar]
- 71.Friedenstein AJ, Petrakov KV, Kuroleso AI, Frolova GP (1968) Heterotopic transplants of bone marrow—analysis of precursor cells for osteogenic and hematopoietic tissues. Transplantation 6:230–247 [PubMed] [Google Scholar]
- 72.Schoeters GER, Desaintgeorges L, Vandenheuvel R, Vanderborght O (1988) Mineralization of adult mouse bone-marrow in vitro. Cell Tissue Kinet 21:363–374 [DOI] [PubMed] [Google Scholar]
- 73.Carter DH, Sloan P, Aaron JE (1991) Immunolocalization of collagen type I and type III, tenascin, and fibronectin in intramembranous bone. J Histochem Cytochem 39:599–606 [DOI] [PubMed] [Google Scholar]
- 74.Probst A, Spiegel HU (1997) Cellular mechanisms of bone repair. J Invest Surg 10:77–86 [DOI] [PubMed] [Google Scholar]
- 75.Ferguson C, Alpern E, Miclau T, Helms JA (1999) Does adult fracture repair recapitulate embryonic skeletal formation? Mech Dev 87:57–66 [DOI] [PubMed] [Google Scholar]
- 76.Opperman LA (2000) Cranial sutures as intramembranous bone growth sites. Dev Dyn 219:472–485 [DOI] [PubMed] [Google Scholar]
- 77.Shorey S, Heersche JNM, Manolson MF (2004) The relative contribution of cysteine proteinases and matrix metalloproteinases to the resorption process in osteoclasts derived from long bone and scapula. Bone 35:909–917 [DOI] [PubMed] [Google Scholar]
- 78.Hall BK (2001) Development of the clavicles in birds and mammals. J Exp Zool 289:153–161 [DOI] [PubMed] [Google Scholar]
- 79.Fujii T, Ueno T, Kagawa T, Sakata Y, Sugahara T (2006) Comparison of bone formation ingrafted periosteum harvested from tibia and calvaria. Microsc Res Tech 69:580–584 [DOI] [PubMed] [Google Scholar]
- 80.Colnot C (2009) Skeletal cell fate decisions within periosteum and bone marrow during bone regeneration. J Bone Miner Res 24:274–282 [DOI] [PMC free article] [PubMed] [Google Scholar]
- 81.Friedenstein AJ, Ivanovsmolenski AA, Chajlakjan RK, Gorskaya UF, Kuralesova AI, Latzinik NW, Gerasimow UW (1978) Origin of bone-marrow stromal mechanocytes in radiochimeras and heterotopic transplants. Exp Hematol 6:440–444 [PubMed] [Google Scholar]
- 82.Giese K, Kaufmann J, Pronk GJ, Klippel A (2002) Unravelling novel intracellular pathways in cell-based assays. Drug Discov Today 7:179–186 [DOI] [PubMed] [Google Scholar]