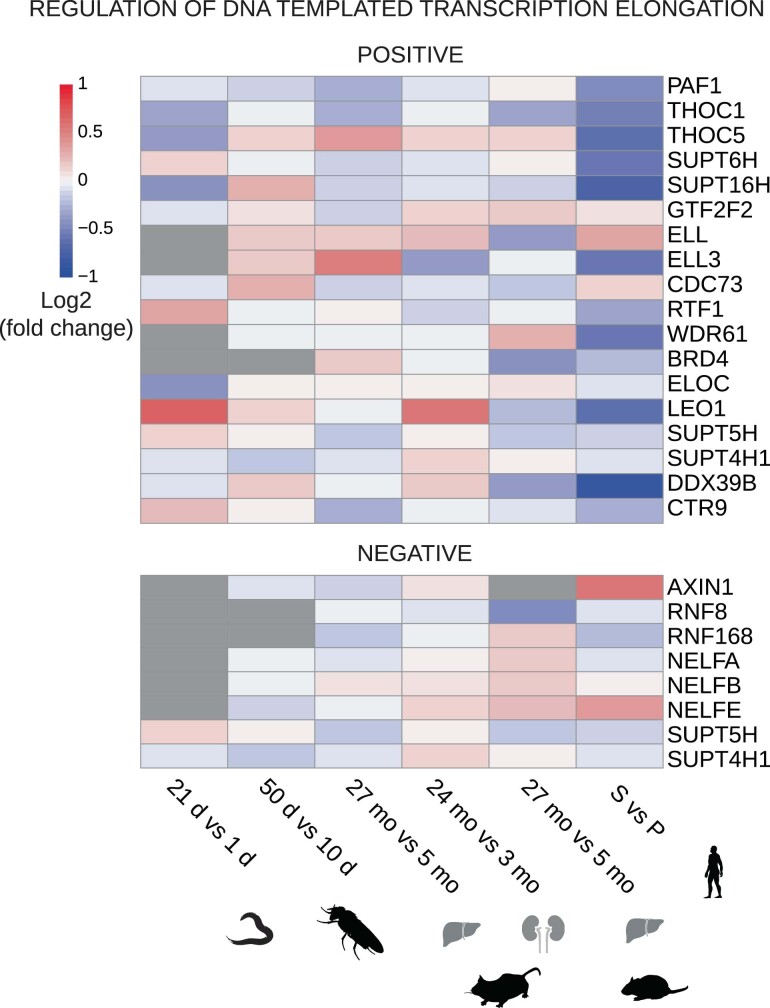
Extended Data Fig. 6. Heatmap of differential expression (log2 fold change) of MSigDB (61) annotated genes for ‘regulation of DNA templated transcriptional elongation’.
Top: activators of transcriptional elongation (POSITIVE); Bottom: repressors of transcriptional elongation (NEGATIVE). Data shown for WT aging time courses: worm (21 d vs 1 d), fly heads (50 d vs 10 d), mouse liver (27 mo vs 5 mo), mouse kidneys (24 mo vs 3 mo) and human fibroblast cell line (IMR90: Senescent vs proliferating). The silhouettes of the organs were created using BioRender (https://biorender.com), and the silhouettes of species are from PhyloPic (https://phylopic.org).

