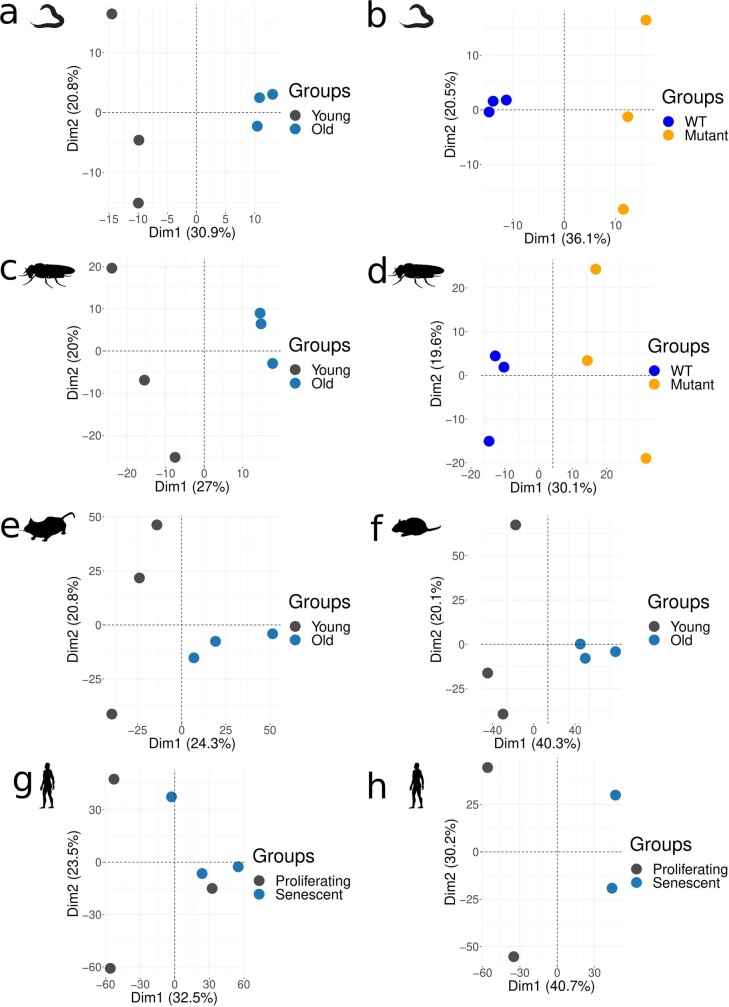
Extended Data Fig. 1. PCAs of slopes of intronic read distribution.
Principal component analysis (PCA) of the slopes of C. elegans ((a) wt 21 d vs 1 d; (b) 14 ama-1(m322) d vs wt 14 d), D. melanogaster ((c) wt heads 50 d vs 10 d, (d) RpII2154 heads 50 d vs wt 50 d), M. musculus ((e) kidney: 24 mo vs 3 mo), R. norvegicus ((f) liver: 24 mo vs 6 mo), H. sapiens ((g) HUVEC and (h) IMR90: Senescent vs Proliferating). In all panels, the silhouettes of species are from PhyloPic (https://phylopic.org).

