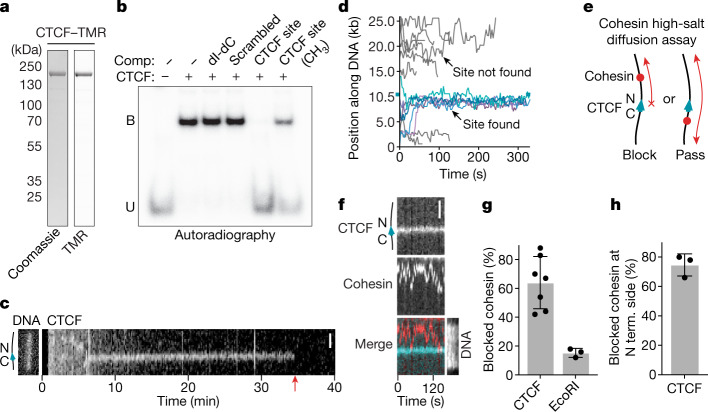
Fig. 1. CTCF is a directional barrier to cohesin diffusion on DNA.
a, Coomassie staining of recombinant CTCF after analysis using SDS–PAGE. Tetramethylrhodamine (TMR) was visualized by epi-green excitation. Gel source data are provided in Supplementary Fig. 1. b, Autoradiograph of EMSA. CTCF was incubated with a 32P-labelled DNA containing a CTCF-binding site. Where indicated, the reactions were supplemented with excess unlabelled competitors (comp.). dI-dC, poly(2′-deoxyinosinic-2′-deoxycytidylic acid); B, bound; U, unbound. Gel source data are provided in Supplementary Fig. 1. c, Example of TMR-labelled CTCF diffusing on DNA. Non-specifically bound CTCF molecules diffuse randomly and dissociate rapidly. At 5.5 min, a CTCF molecule binds to DNA and diffuses until encountering the CTCF-binding site at 6 min. Scale bar, 2 µm. The red arrow indicates the timepoint at which CTCF bleached or dissociated. d, Superposition of individual TMR-labelled CTCF-diffusion events. Events in which CTCF localized to its binding site at position 10452 bp (cyan tick) are shown in blue (n = 6). DNA-binding events in which CTCF did not localize to its binding site are shown in grey. n = 11. e, Illustration of the cohesin diffusion assay. f, Example of cohesin diffusion that is blocked by CTCF. Cohesin and CTCF were labelled with Alexa660 (red) and TMR (blue), respectively. Sytox Green DNA stain was introduced into the flow cell at the end of the experiment. Scale bar, 2 μm. g, The fraction of blocking events in which cohesin encountered CTCF or EcoRI(E111Q). Data are mean ± s.d. from 7 (n = 264) and 3 (n = 106) independent experiments, respectively. h, The fraction of blocked events in which cohesin diffused along the DNA between the tether point and the N-terminal (N term.) side of CTCF. Data are mean ± s.d. from 3 (n = 48) independent experiments. In the remaining 25% of events, cohesin diffused between the tether and the C-terminal side of CTCF. Sample sizes refer to biological replicates.

