

Summary
Chronic sleep loss profoundly impacts metabolic health and shortens lifespan, but studies of the mechanisms involved have focused largely on acute sleep deprivation 1,2. To identify metabolic consequences of chronically reduced sleep, we conducted unbiased metabolomics on heads of three adult Drosophila short-sleeping mutants with very different mechanisms of sleep loss: fumin (fmn), redeye (rye), and sleepless (sss) 3–7. Common features included elevated ornithine and polyamines; and lipid, acyl-carnitine, and TCA cycle changes suggesting mitochondrial dysfunction. Studies of excretion demonstrate inefficient nitrogen elimination in adult sleep mutants, likely contributing to their polyamine accumulation. Increasing levels of polyamines, particularly putrescine, promotes sleep in control flies, but poisons sleep mutants. This parallels broadly enhanced toxicity of high dietary nitrogen load from protein in chronically sleep-restricted Drosophila, including both sleep mutants and flies with hyper-activated wake-promoting neurons. Together, our results implicate nitrogen stress as a novel mechanism linking chronic sleep loss to adverse health outcomes, and perhaps for linking food and sleep homeostasis at the cellular level in healthy organisms.
eTOC Blurb
Bedont et al. show that fruit fly sleep mutants accumulate polyamines, likely driven by inefficient nitrogen excretion. The authors identify putrescine as a novel somnogen, and find that dietary nitrogen is more toxic in chronically sleep deprived flies. This reveals a novel mechanism linking chronic sleep loss to longevity.
Results and Discussion
Sleep mutant, but not acutely sleep deprived, fly heads have remodeled nitrogen metabolism
We conducted metabolomics on ~10-day-old iso31 control and sleep mutant fmn, rye, and sss fly heads. 30 metabolites were commonly regulated across sleep mutants, which we attribute to chronic sleep loss (Figure 1A). 7 (~23%) of these are primarily linked to nitrogen metabolism or polyamine synthesis: ornithine, acetylarginine, α-acetylornithine, δ-acetylornithine, acetylisoputreanine, diacetylspermidine, and pipecolate (Figure 1B). The polyamines putrescine and spermidine were also elevated in rye and sss, and putrescine trended high in fmn (p=0.0535) (Figure S1A). Other commonly regulated metabolites, such as taurine, sarcosine, and guanine, have links to nitrogen metabolism, but also other pathways (Figure S1B) 8,9.
Figure 1. Sleep mutants have profoundly altered nitrogen, mitochondrial, and lipid metabolism.
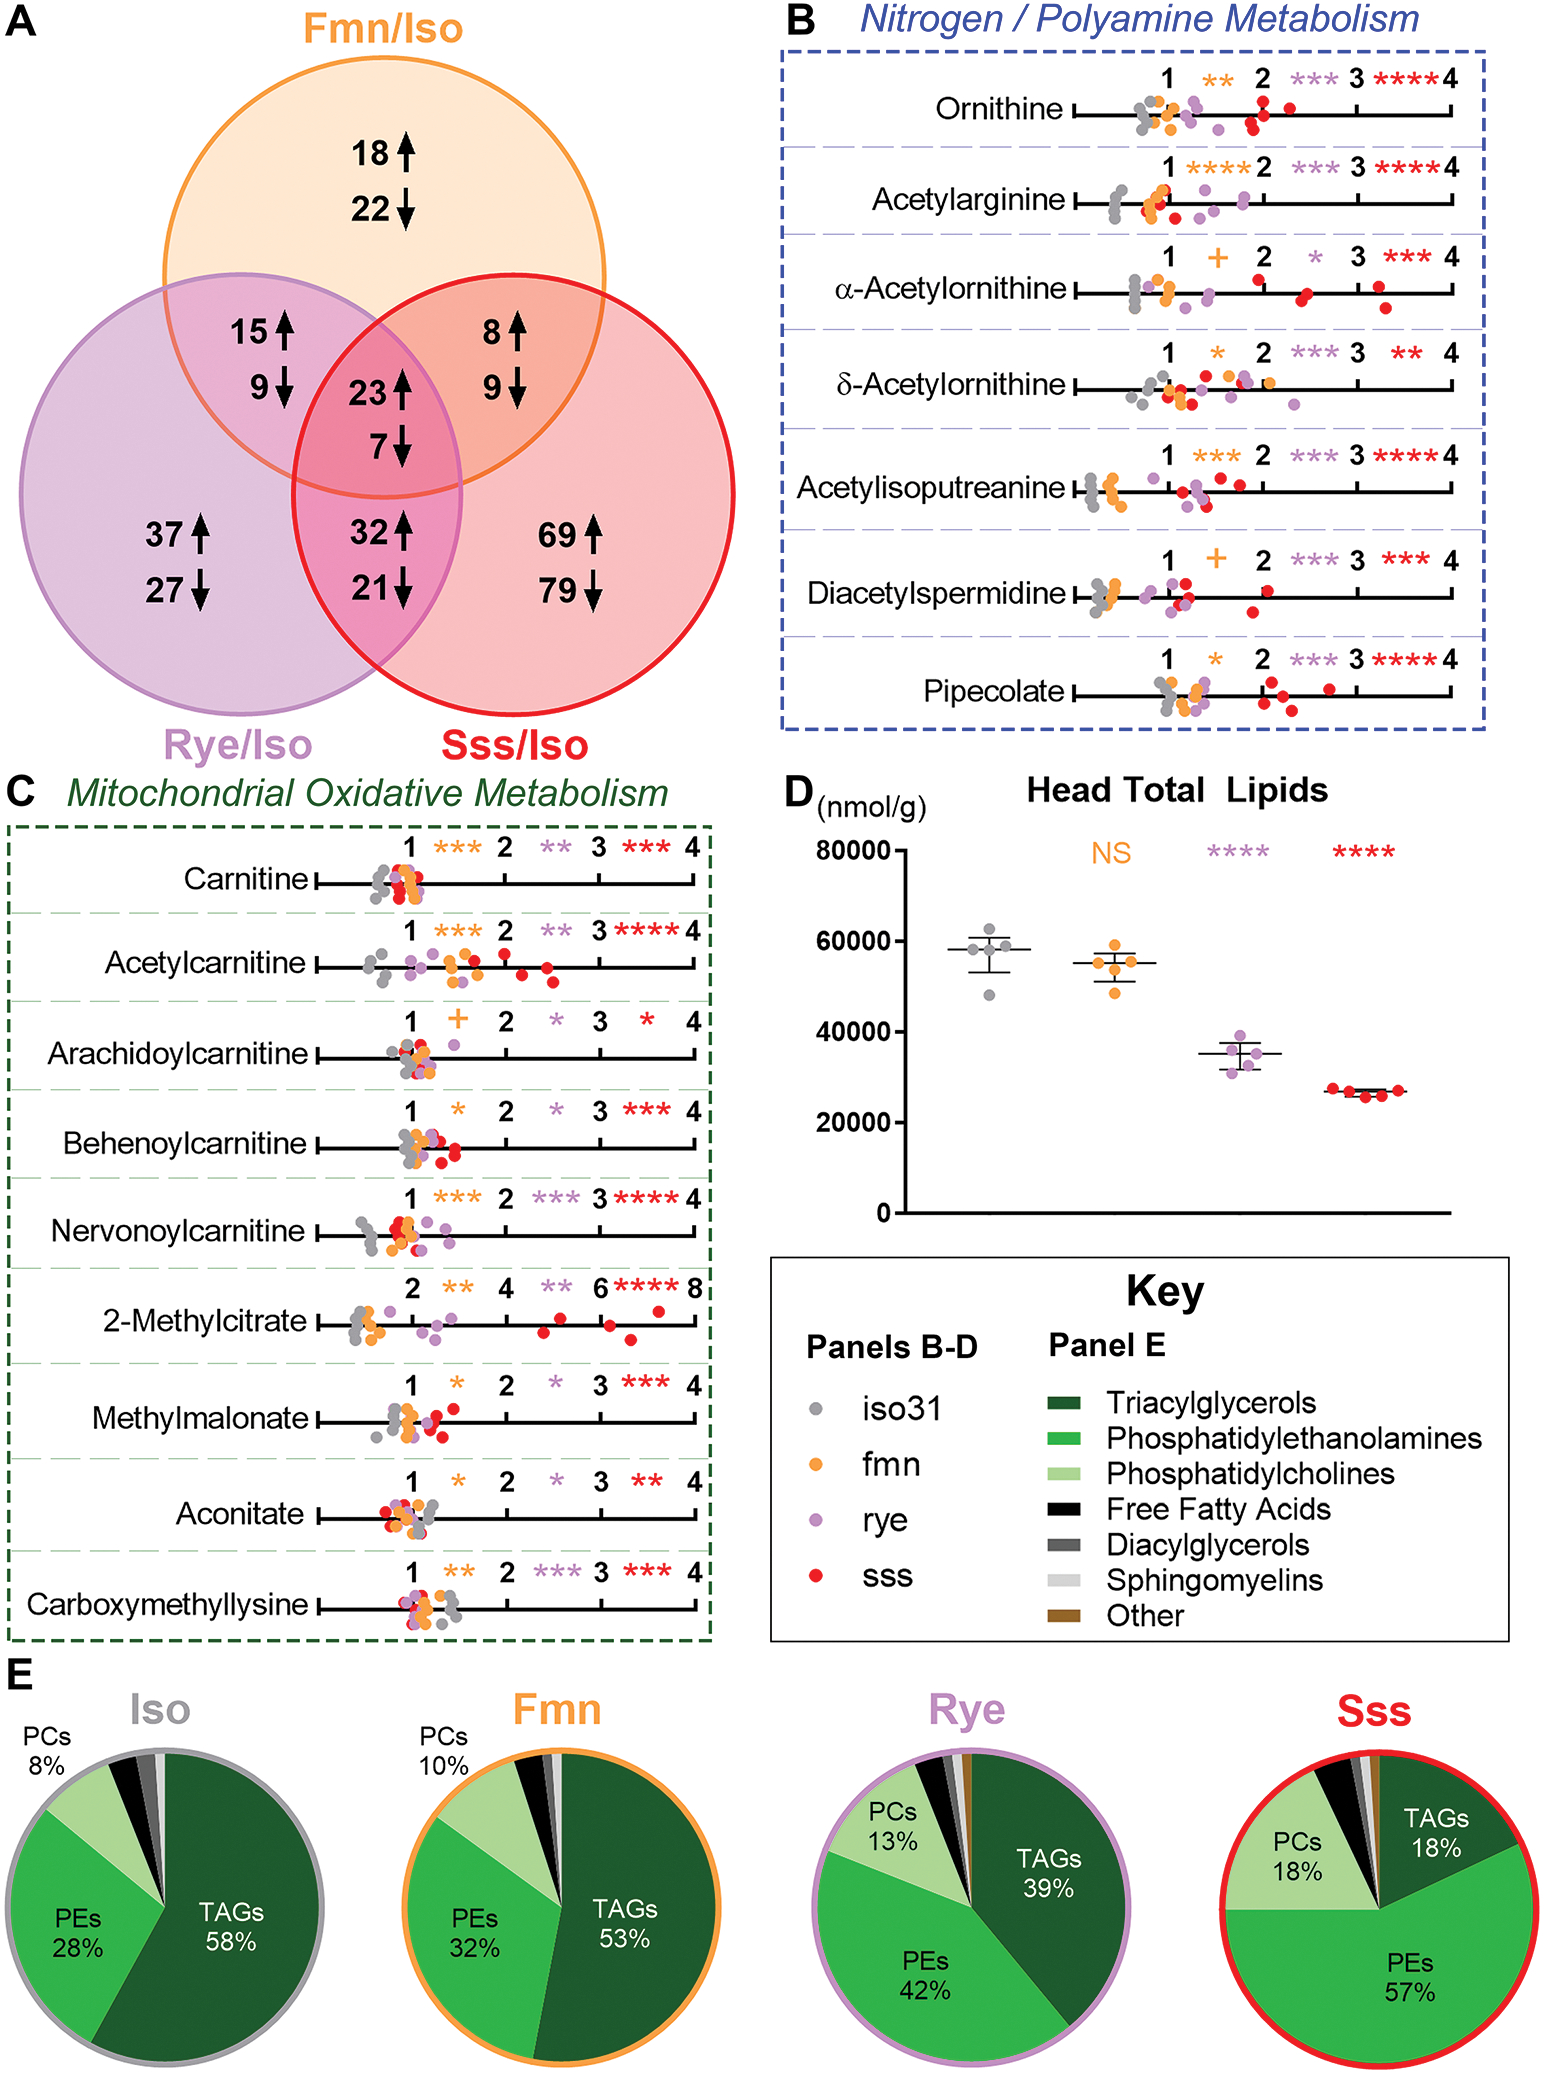
All metabolomic data is from iso31 (gray), fmn (orange), rye (purple), and sss (red) pools of ~10-day-old, mixed-sex, mated fly heads collected at ~ZT6. All statistical comparisons shown are color-matched sleep mutant vs iso31 control.
(A) Venn diagram of the number of metabolites consistently up- or down-regulated in one or more sleep mutants compared to iso31 control.
(B-C) Line graphs of scaled metabolite levels, grouped by involvement in nitrogen metabolism (B) or mitochondrial oxidative metabolism (C). Data shown are individual pools of lysate; n=5; Welch’s t-tests (p-values) with FDR correction for multiple comparisons (q-values); + p<0.05 but q>0.05, * p/q<0.05, ** p/q<0.01, *** p/q<0.001, **** p/q<0.0001.
(D) XY graph of total lipid content. Data shown are individual pools of lysate overlaid with median+/−interquartiles; n=5; Dunnett test; NS = not significant, ****p<0.0001.
(E) Pie graphs showing % of major lipid families in the head lipidome. Changes in sleep mutant lipid composition are largely driven by lost lipids (D), mostly triacylglycerols, especially in rye and sss.
We then asked if acute sleep deprivation similarly alters nitrogen metabolism. Targeted metabolomics in iso31 heads at morning zeitgeber time (ZT)2 (control) compared to evening ZT14, ZT2 after overnight sleep deprivation (ZT2 SD), and ZT2 after overnight SD with morning rebound sleep (ZT2 SR), showed minimal effects on nitrogen metabolism. Ornithine alone trended higher at ZT2 SR (Figure S1C). Thus, nitrogen metabolome remodeling in sleep mutants requires chronic sleep loss.
Mitochondrial, lipid, and other metabolome changes in heads of Drosophila sleep mutants
5 metabolites commonly regulated across sleep mutants were carnitine or acyl-carnitines, suggesting defects in β-oxidation (Figure 1C). Many other acyl-carnitines were elevated idiosyncratically in particular sleep mutants (Data S1). Elevated 2-methylcitrate and methylmalonate, and lower carboxymethyllysine and aconitate, suggest mitochondrial stress across sleep mutants (Figure 1C) 10–13. In rye and sss, mitochondrial defects likely contribute to lipid loss that skews remaining lipid ratios; fmn has similar, weaker trends (Figure 1D–E). Cholesteryl esters are also down in rye and sss, with a similar trend in fmn (Data S1). Other commonly regulated metabolites included smaller clusters of threonine and erythrosine derivatives (Figure S1B).
Chronic, but not acute, sleep restriction reduces efficiency of nitrogen excretion
Polyamine synthesis requires considerable nitrogen 9, implying sleep mutants are nitrogen stressed. To test this, we assayed total protein, urate, urea, and NH4 in ~10-day-old whole flies at dawn and dusk. Urea was unquantifiable, while total protein, NH4, and urate showed either no effect, or idiosyncratic effects in individual sleep mutants (Figure S2A–F). We next assayed hemolymph total protein and NH4 in sleep mutant and control flies at dawn and dusk, to assess circulating nitrogen stress. Both were markedly elevated in rye; total protein was modestly elevated and NH4 trended up (p=0.06) in fmn (Figure S2G–H). While sss lacked these differences (p>0.53), their elevated whole-fly and head urate likely indicates that they accumulate nitrogen stress in a different form (see Figure S2; Data S1; Discussion). These results encouraged us to examine sleep mutant nitrogen excretion.
Because excretion is an active behavior, we assayed NH4 and urate excretion at the beginning and end of the day / waking phase, and late at night in ~10-day-old flies. Both metabolites showed a genotype main effect (p<0.001), driven by consistently decreased excretion in all sleep mutants, albeit with some mutant-specific variation in time(s) of day driving the effect (Figure 2A–B). To determine whether this reflected constipation, we pre-fed FCF brilliant blue laced food for 24 hours and measured dye excretion (Figure 2C). A genotype main effect (p<0.0001) was driven by increased excretion in rye and sss, across all times for sss and mostly in the morning for rye (Figure 2C). fmn excretion volume was similar to control, but this likely reflects depletion of gut contents during the assay; excrement deposition is increased in fmn pre-feeding vials (Figure S2I). Decreased nitrogen metabolites in increased-to-unchanged excrement volume demonstrates inefficient nitrogen excretion in all adult sleep mutants tested.
Figure 2. Adult sleep mutants, but not newly eclosed sleep mutants or acutely mechanical sleep deprived adults, inefficiently excrete nitrogen waste.
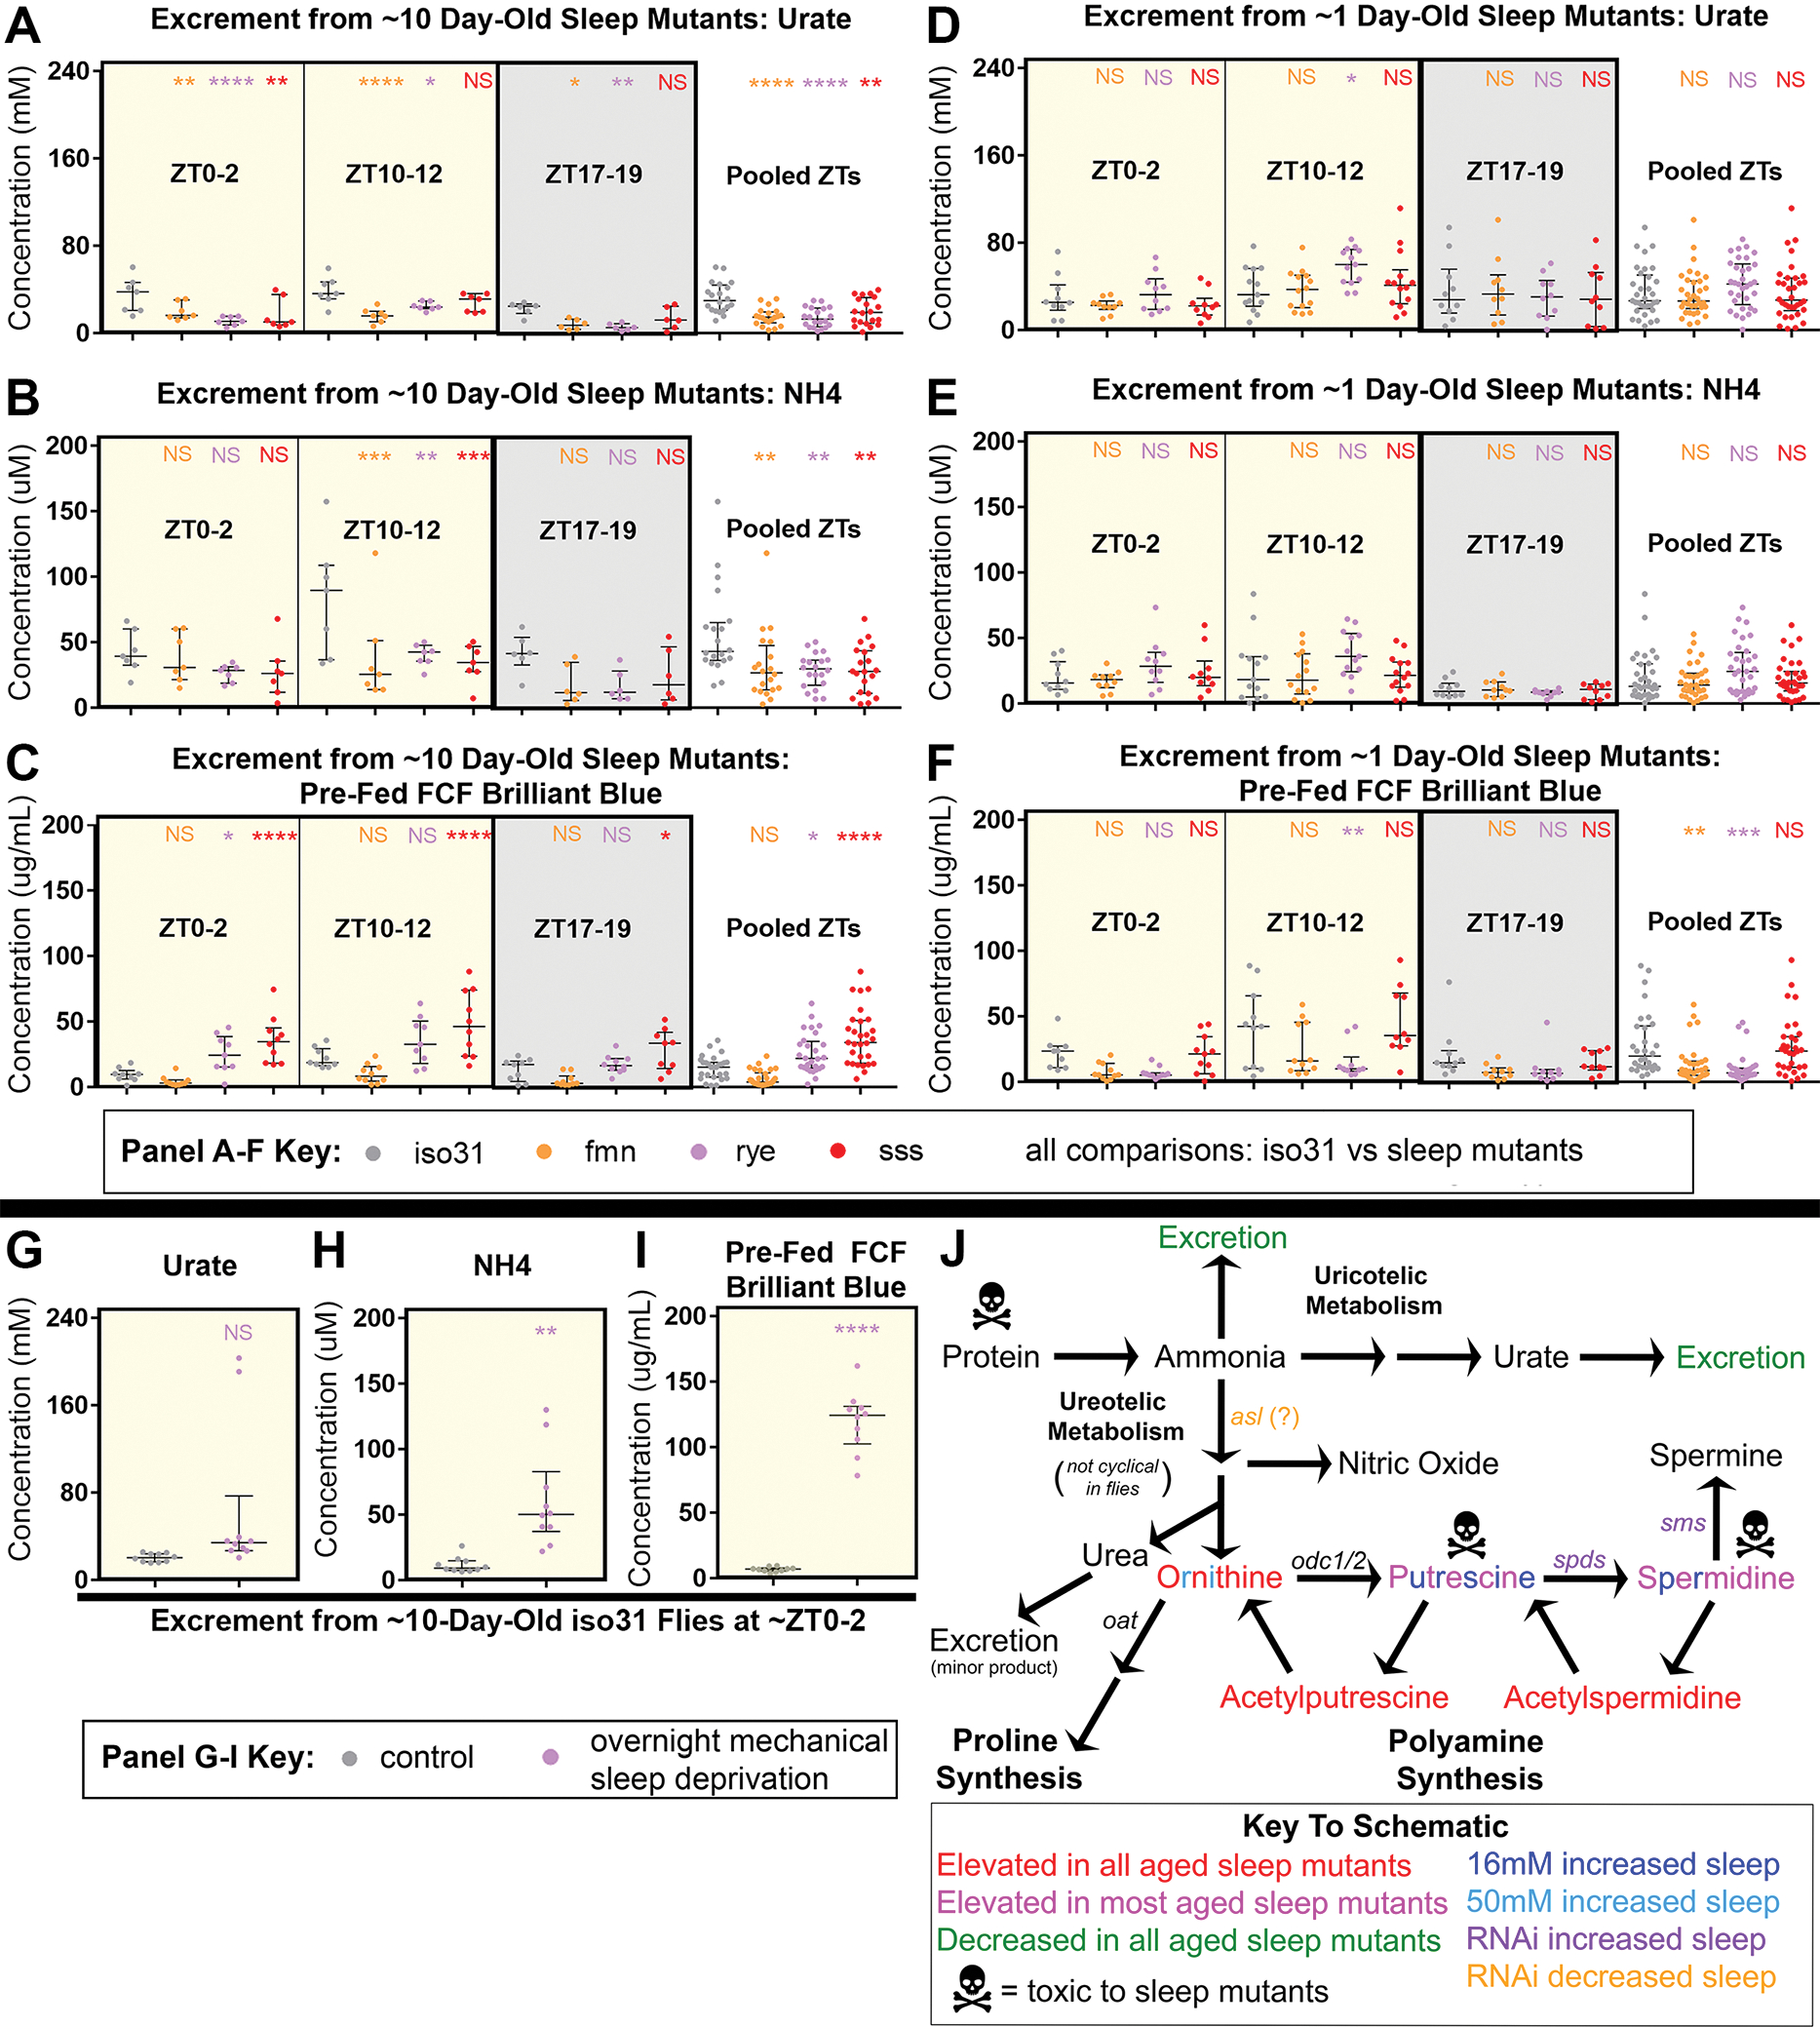
All data are from male flies at the indicated zeitgeber time (ZT). ~10-day-old flies were mated; mating status of ~1-day-old flies was mixed. All statistical comparisons shown are for color-matched sleep mutant or mechanical SD vs control.
(A-F) Excreted urate (A,D), NH4 (B,E), and FCF brilliant blue pre-fed for 1 day before collection (C,F) at ZT0-2, ZT10-12, or ZT17-19 from iso31 (gray), fmn (orange), rye (purple), and sss (red) flies. Flies were ~10 days (A-C) or ~1 day (D-F) old post-eclosion. n=6–7 per group (10-day-old) or n=10–14 per group (1-day-old); two-way ANOVA with within-ZT and pooled post-hoc Dunnett tests.
(G-I) Excreted urate (G), NH4 (H), and FCF brilliant blue pre-fed for 1 day before collection (I) at ZT0-2 from control unshaken (gray) or overnight 12-hour mechanically sleep-deprived (purple) iso31 flies. n=10; Welch tests.
All data shown are from resuspended excretions collected over the indicated 2-hour span from individual pools of flies, overlaid with median+/−interquartiles. NS = not significant, * p<0.05, ** p<0.01, *** p<0.001, **** p<0.0001.
(J) Schematic of ureotelic and uricotelic nitrogen metabolism pathways in Drosophila melanogaster. Metabolite levels in sleep mutants and their excretions are in Figures 1–2. Effects of polyamine manipulations on sleep are in Figure 3. Effects of polyamines and protein on lifespan are in Figure 4.
Related to Figure S2.
We next repeated these studies ~1 day after eclosion, when sleep mutants are short-sleeping, but have experienced less lifetime sleep loss 14. No young sleep mutant had deficient NH4 or urate excretion, while a genotype main effect on dye excretion (p<0.0001) was driven by decreased excretion volume in fmn and rye (Figure 2F). These findings suggest that loss of nitrogen excretion efficiency requires chronic sleep loss.
Lack of an effect on nitrogen excretion might explain the failure of overnight SD to elevate head polyamines, in our study and others (Figure S1) 2. We tested this by measuring NH4, urate, and blue dye excretion in ~10 day-old iso31 flies after 12hr overnight mechanical SD (mechSD) vs unshaken controls. We found increased NH4 and blue dye and up-trending urate (p=0.08) after mechSD (Figure 2G–I). Increased excretion volume suggests that nitrogen excretion efficiency is not necessarily increased by mechSD, but rather that excretion remains largely intact with acute sleep loss.
We next sought to compare excretion after acute and chronic sleep restriction in parallel, independently of sleep-altering mutations. As flies adapt to extended mechanical shaking, we restricted sleep by activating wake-promoting neurons using 60D04-Gal4>TrpA1 (D>Trp) and 11H05-Gal4>TrpA1 (H>Trp) lines. This sleep loss is heat-gated and resists homeostatic rebound, allowing acute and chronic sleep restriction 15,16. Excretion assays after 1-day and 10-day sleep restriction at 29C were inconclusive, with mostly negative results that may reflect no effect of sleep restriction, perhaps due to lack of sleep need buildup 16, or may instead stem from confounding effects of duration at 29C on excretion in genetic controls (Figure S2J–O). Urate excretion in D>Trp --the one case lacking time-at-29C confounds in genetic controls--was elevated at 1-day 29C but not 10-day 29C, driven by decreased urate excretion only in D>Trp (Figure S2K). This supports our overall results suggesting impairment of nitrogen excretion by chronic sleep restriction.
Blocking terminal polyamine synthesis increases sleep in Drosophila melanogaster
Since sleep loss promotes somnogen accumulation, we conducted RNAi screens to test how polyamine metabolism and linked pathways regulate sleep in Drosophila. Drug-inducible geneswitch (GS) drivers allowed adult-specific knockdown. Screening whole fly knockdown with actinGS>dicer yielded hits for argininosuccinate lyase (asl), spermidine synthase (spds), and spermine synthase (sms) (Figures 2J,3A; Data S2). We also screened pan-neuronal knockdown with nsybGS>dicer, but no hits validated (Figure S3A; Data S2). Neither screen recapitulated sleep gain previously reported with constitutive pan-neuronal knockdown of oat (Data S2) 17. Possible explanations include knockdown timing and strain effects.
Figure 3. Sleep is increased by both supplementing putrescine and blocking its conversion to terminal polyamines.
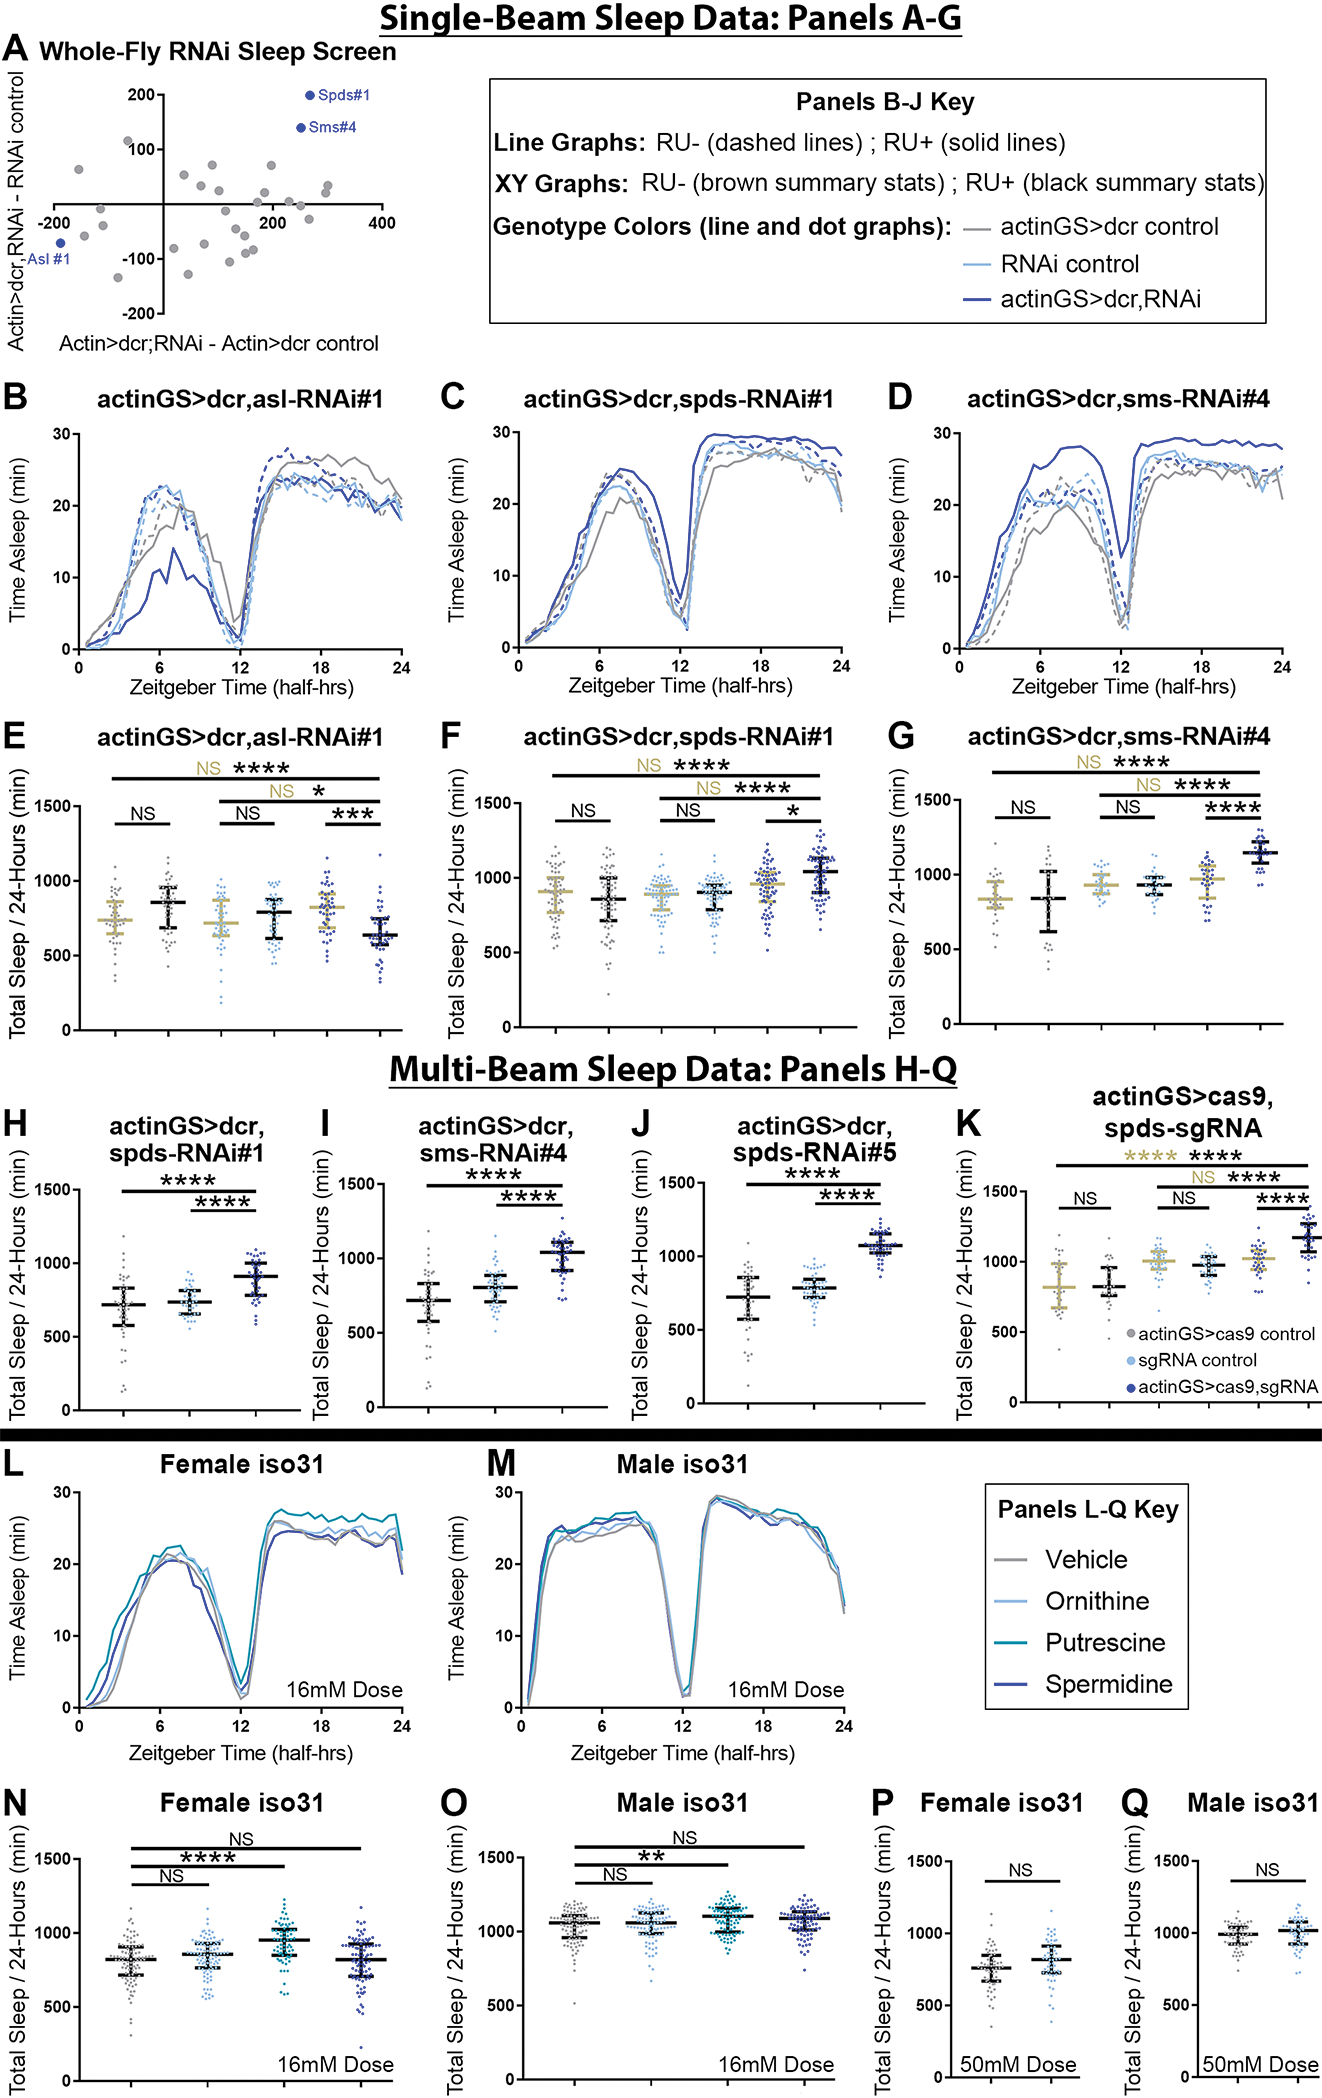
All data was collected from adult mated flies.
(A) Difference in single-beam first-pass population mean sleep on mifepristone-laced (RU+) food for various female actin-geneswitch(GS)>dicer;nitrogen metabolism-RNAi crosses, compared with actinGS>dicer control (x-axis) and RNAi control (y-axis). Blue, labeled dots indicate significant hits that passed all validation steps. RNAi identities and population statistics for the screens are provided in Data S2.
(B-G) Sleep data from single-beam validation experiments of screen hits. Whole-fly knockdown of argininosuccinate lyase (asl,B,E) RU-dependently decreased sleep. Whole-fly knockdown of spermidine synthase (spds,C,F) and spermine synthase (sms,D,G) RU-dependently increased sleep. n=30–71 flies per group; Tukey HSD (G) or Steel-Dwass (E,F) tests; statistics for genotype comparisons are color-coded for vehicle control (RU-, brown) or RU+ (black) food.
(H-J) Multi-beam sleep data was collected on RU+ food, to further validate spds and sms RNAi sleep gain hits with whole-fly knockdown (H-I) and to re-test another spds RNAi that qPCR results suggested should increase sleep (J). All increased sleep. n=38–47; Welch’s t-tests.
(K) Multi-beam sleep data on vehicle control or RU+ food, from actinGS>cas9,spds-sgRNA experimental flies with actinGS>cas9 and spds-sgRNA alone controls. Like RNAi, adult Crispr knockout of spds increased sleep. n=30–35; Tukey HSD.
(L-M) Averaged multi-beam sleep behavior of iso31 females (G) or males (H) plotted over circadian time, on food supplemented with water vehicle (gray), 16mM L-ornithine (light blue), 16mM putrescine (turquoise), or 16mM spermidine (dark blue).
(N-O) Multi-beam total sleep in female (N) and male (O) flies on 16mM or vehicle supplemented food. n=69–93 flies per group; Steel tests (vs Vehicle).
(P-Q) Multi-beam total sleep in female (P) and male (Q) flies on 50mM ornithine (light blue) or vehicle (gray) supplemented food. n=54–58; Welch’s t-tests.
The same datasets were used to compute panels shown here and corresponding auxiliary sleep and activity metrics in Figure S3 and Data S2.
For Panels B-Q, all line graphs show averaged sleep behavior over time, and all dot graphs show individual fly values overlaid with median+/−interquartiles. For all panels, NS = not significant, * p<0.05; ** p<0.01; ***p<0.001; **** p<0.0001.
Our initial experiments used single-beam DAM monitors. Surprisingly, qPCR of actinGS>dicer knockdown of sleep screen hit RNAis (asl#1; spds#1; sms#4) and RNAis lacking sleep screen phenotypes (asl#3; spds#5; sms#5) revealed significant knockdown with all RNAis, with only sleep screen hit sms-RNAi#4 appearing to have superior efficacy (Figure S3B). asl was comparably decreased by both its RNAis, and spds-RNAi#5 appeared more effective than screen hit spds-RNAi#1 (Figure S3B–H).
Since single-beam confounds can mask sleep-gain phenotypes, we re-tested the four spds and sms alleles above, and conducted all subsequent sleep experiments, on multi-beam sleep monitors. Adult whole-fly asl RNAi#1 decreased total and day sleep, and fragmented sleep (Figure 3B,E; Data S2). Adult whole-fly spds RNAi#1 increased total and night sleep, and consolidated sleep, in both sleep assays (Figure 3C,F,H; Data S2). Adult whole-fly sms RNAi#4 increased and consolidated sleep, and decreased latency to sleep at ZT12, in both sleep assays (Figure 3D,G,I; Data S2). Consistent with its more robust knockdown, on multi-beam monitors spds-RNAi#5 reproduced all sleep phenotypes of spds-RNAi#1, increased day sleep, and decreased sleep latency (Figure 3J; Data S2). Consistent with its weaker knockdown, sms-RNAi#5 did not replicate most sleep phenotypes of sms-RNAi#4 on multi-beam monitors (Figure S3I; Data S2).
Finally, we assayed sleep in actinGS>UAS-cas9.P2 CRISPR knockouts using available spds and asl sgRNAs. Adult spds-KO RU-dependently increased sleep, though without consolidation observed with more-efficient RNAi knockdowns (Figures 3K; S3B,K; Data S2). While activity index (AI), activity per waking minute, was low with actinGS>cas9,spds-sgRNA, low AI was RU-independent (Data S2). Comparable AI decrease, but not total sleep gain, was observed with constitutive actinGal4>cas9,spds-sgRNA (Figures 3K,S3M; Data S2). Thus, like RNAi, spds knockout in adulthood increases sleep. While night sleep was RU-dependently fragmented with adult actinGS>cas9,asl-sgRNA, total sleep only weakly trended down (Figure S3J; Data S2). However, asl transcript also appeared less robustly down-regulated than with RNAi tools, leaving asl’s role in sleep unclear (Figure S3B,L). Constitutive actinGal4>cas9,asl-sgRNA also did not decrease sleep (Figure S3N).
In sum, even relatively modest loss of spds in adulthood increases sleep. Loss of sms in adulthood, if near-complete, also increases sleep. And our data are inconclusive on whether asl loss in adulthood decreases sleep. Together, our data show that blocking terminal polyamine synthesis (i.e: putrescine conversion into spermidine or spermine) is sleep promoting (Figure 2J).
Putrescine promotes sleep in control flies, but polyamines are toxic to sleep mutants
We next tested sleep in iso31 flies on food laced with vehicle or 16mM L-ornithine, putrescine, or spermidine. Putrescine increased total sleep, driven primarily by increased and consolidated day sleep, with decreased ZT0 latency to sleep (Figures 3L–O; S3O–R; Data S2). Females may also sleep more at night with shortened ZT12 latency on putrescine, though a small decrease in night AI leaves unclear whether this reflects nocturnal lethargy (Figure S3P; Data S2). Regardless, most female and all male sleep gain came from day sleep, and neither sex has decreased day AI (p>0.8) (Data S2). Together, this indicates putrescine is a novel somnogen.
This view is reinforced by weak, day-sleep promoting effects of spermidine and ornithine, which can convert to putrescine either directly (from ornithine) or via acetylated intermediates (Figure 2J). Spermidine increased day sleep in males and decreased ZT0 sleep latency in both sexes, with no AI changes (Figures 3L–O; S3O–R; Data S2). Surprisingly, 16mM ornithine did not affect sleep in either sex (Figures 3L–O; S3O–R; Data S2) 17. Re-testing at the maximal 50mM dose previously reported, in females we replicated shorter ZT0 sleep latency, but observed only a modest uptrend in total sleep (p=0.0579), driven by increased and consolidated day sleep with no day AI change (Figures 3P–Q; S3S–V; Data S2). Together, we observe much weaker, but directionally consistent, effects of ornithine on mated female sleep than previously reported 17. Position confounds on single-beam monitors may partially explain the weaker phenotype; we observe dose-dependent chemo-repulsion on ornithine, driving increased time spent by females at the tube midpoint at 16mM (Figure S3W–Z). Strain differences may also contribute.
Strong sleep-promoting effects of putrescine; weaker, sexually dimorphic sleep-promoting effects of spermidine and high-dose ornithine; and sleep-promoting effects of adult spds and sms knockdown, all point to putrescine as the primary polyamine somnogen (Figure 2J). This model also accommodates other results, including possible sleep-decrease with adult asl knockdown, and previously reported sleep gain with constitutive neuronal oat knockdown 17.
We next tested whether polyamines could rescue sleep in sleep mutants. However, this proved impossible—sleep mutants were markedly locomotor impaired and rapidly killed by 16mM polyamine food. This prompted us to conduct an acute 6-day survival study of sleep mutant and control flies on single-beam sleep monitors, comparing within-genotype toxicity on our sleep-study metabolites. Spermidine reduced survival (Surv) only in fmn and sss females, and putrescine decreased survival severely in female sleep mutants, but only modestly in iso31 (Figure 4A–D). In males, putrescine reduced survival in all three sleep mutants but not iso31, while spermidine reduced survival only in sss (Figure 4E–H). Ornithine had no effect (Figure 4A–H). Polyamine effects on hazard ratio (HR) mirrored survival.
Figure 4. Dietary nitrogen is disproportionately toxic to chronically sleep-restricted Drosophila.
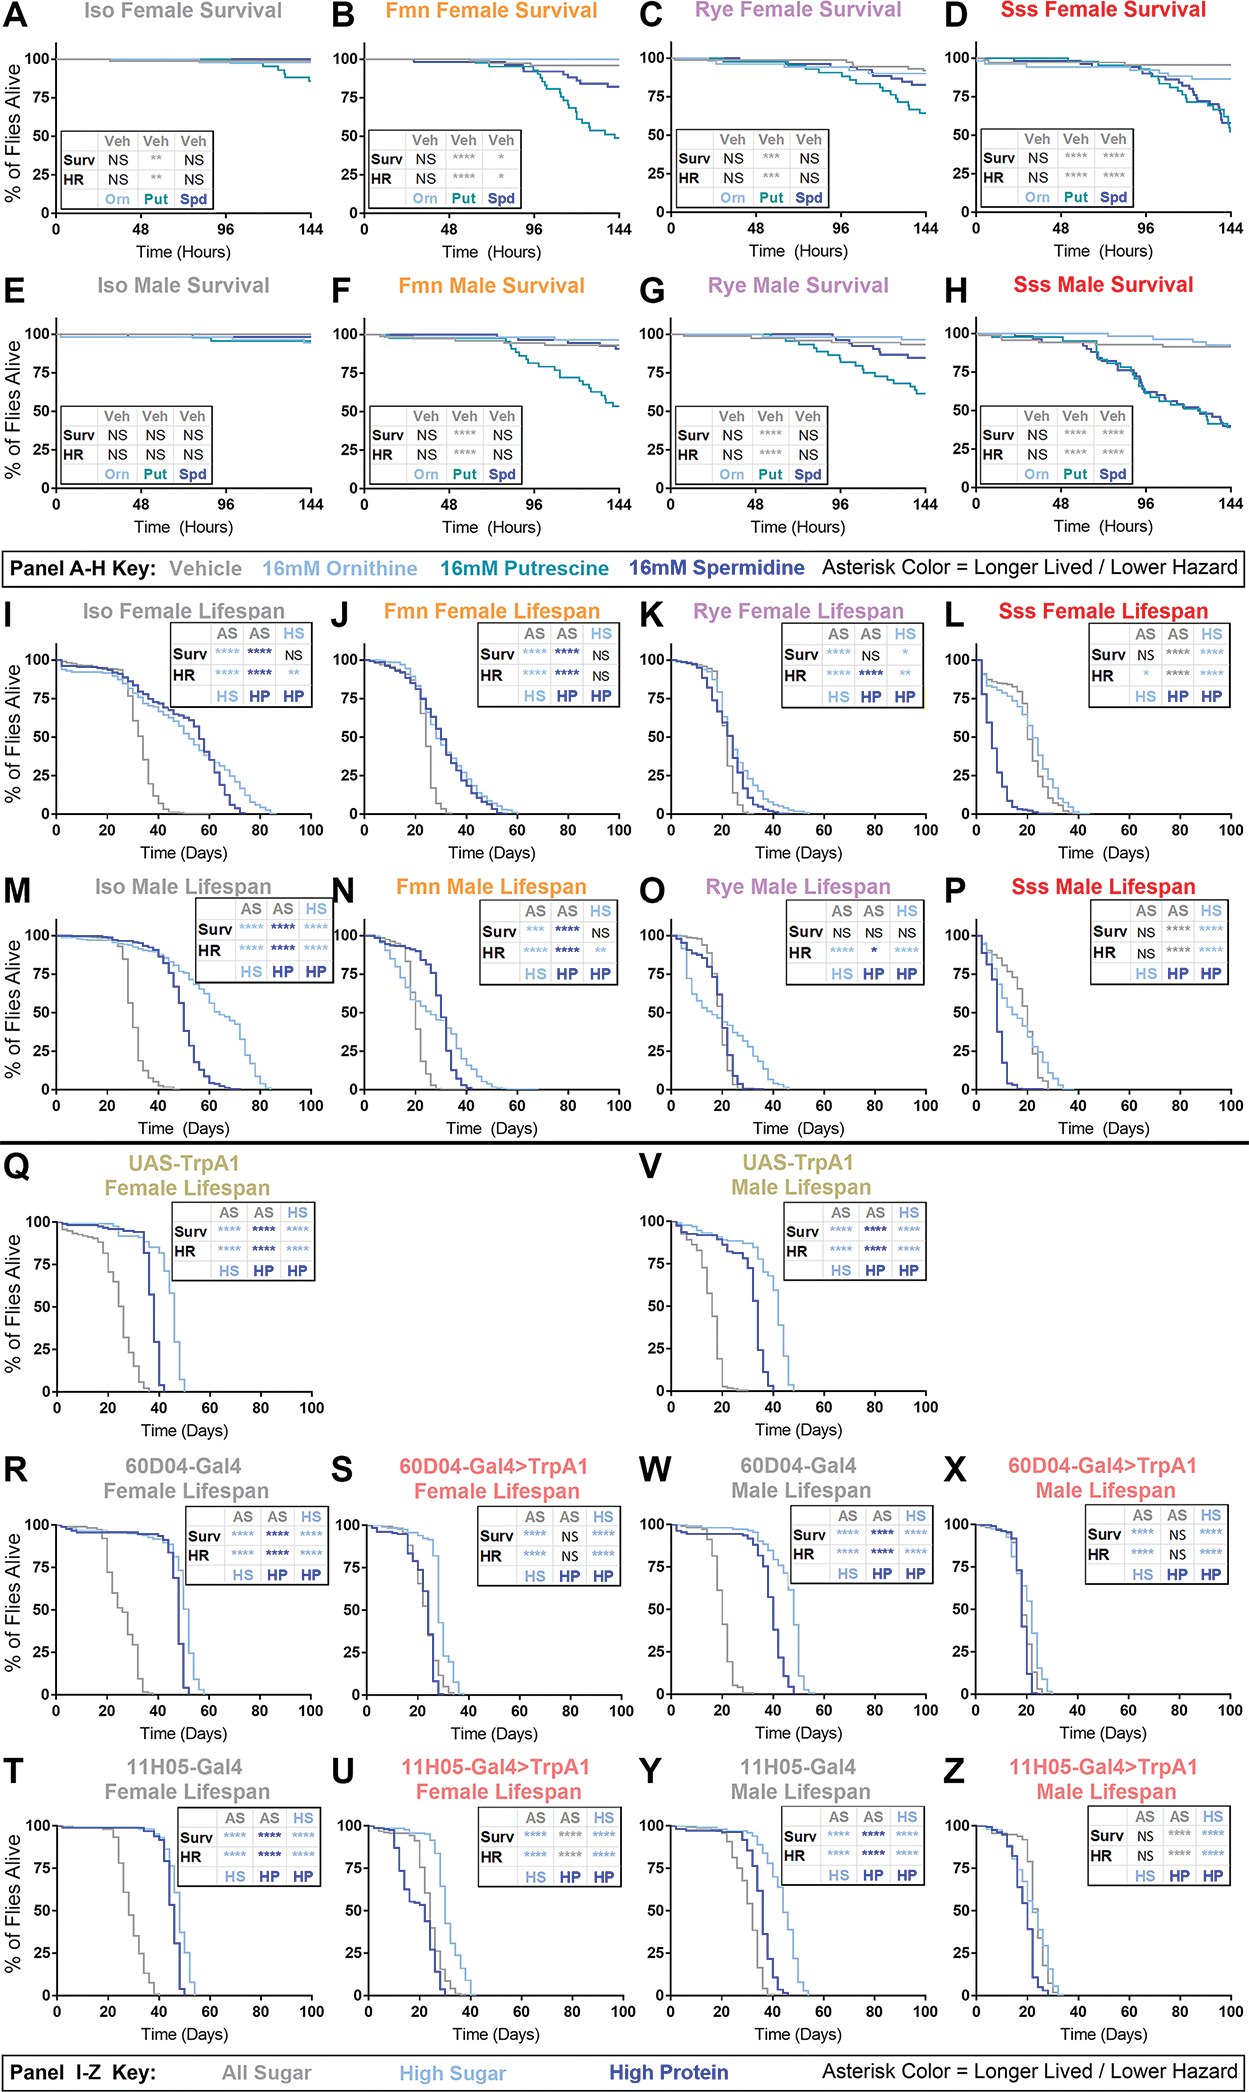
(A-H) Acute survival of female (A-D) and male (E-H) flies during exposure to water vehicle (gray), 16mM ornithine (light blue), 16mM putrescine (turquoise), or 16mM spermidine (dark blue) supplemented sugar-agar in locomotor tubes. Genotypes are iso31 (A,E), fmn (B,F), rye (C,G), and sss (D,H). n=41–72 flies per group; panels show percentage survival over time of whole population, censoring flies surviving >6 days.
(I-P) Lifespan of female (I-L) and male (M-P) flies of iso31 (I,M), fmn (J,N), rye (K,O), and sss (L,P) genotype. Dark blue codes high-protein diet, light blue codes high-sugar diet, and gray codes all-sugar diet. Panels show surviving flies as a percentage of total population: n=206–239 flies per group.
(Q-Z) Lifespan of female (Q-U) and male (V-Z) flies of trpA1 control (Q,V), gal4 control (R,T,W,Y) and chronically sleep restricted gal4>trpA1 (S,U,X,Z) genotypes. Dark blue codes high-protein diet, light blue codes high-sugar diet, and gray codes all-sugar diet. Panels show surviving flies as a percentage of total population: n=93–162 flies per group; For all panels, asterisk color codes which group in each comparison had longer lifespan by Wilcoxon analysis (Surv) or lower hazard by likelihood tests of Cox proportional hazard ratios (HR). Bonferroni-corrected significance threshold for all panels is p=0.0167. *p<0.0167, **p<0.01, ***p<0.001, ****p<0.0001, NS=not significant.
Chronic sleep restriction renders flies sensitive to dietary nitrogen
Polyamine toxicity is consistent with dietary nitrogen sensitivity. Indeed, in previous reports fmn flies had normal lifespan on standard food, but short lifespan on nitrogen-rich, high-calorie diet 4,18. However, sss (and chronic short-sleep generally) are associated with short lifespan 1,6,15. In our hands, all three sleep mutants (including fmn) have short lifespan on standard food (Figure S4A–B) 4. Thus, general ill-health might explain sleep mutant sensitivity to polyamines. To assess specific sensitivity to nitrogen stress, we tested iso31 and sleep mutant lifespan on: (1) high-protein, (2) high-sugar, and (3) all-sugar diets. In wild-type Drosophila, nitrogen rich high-protein and nitrogen starvation all-sugar diets both shorten lifespan, relative to high-sugar diet with low protein 19,20.
While all-sugar narrowed survival differences between sleep mutants and iso31, sleep mutants remained short-lived on all three diets (Figure S4C–H). However, within-genotype diet comparisons suggested nitrogen sensitivity of sleep mutants. In iso31, lifespan and hazard was generally high-sugar > high-protein > all-sugar (Figure 4I,M). Sleep mutants performed better on all-sugar vs high-protein, with (1) a narrowed “penalty” on all-sugar in fmn; (2) no lifespan and blunted hazard differences in rye; and (3) longer lifespan/lower hazard on all-sugar in sss (Figure 4I–P). The lifespan/hazard “penalty” on all-sugar vs high-sugar was also blunted or lost across sleep mutants, especially males (Figure 4I–P). However, high-protein vs high-sugar effects varied (Figure 4I–P).
Differential feeding could impact lifespan directly, and protein both promotes postprandial sleep and reduces sleep depth, which could impact sleep restriction 21–23. To test whether either factor contributes to our complex lifespan results, we simultaneously measured awake time-by-food and sleep on multibeam sleep monitors (Data S3). This approach avoids climbing proficiency and aversive shock confounds inherent to alternative methods, such as Café and FLIC assays 24, though chemotaxis is a potential confound. Sleep mutants spend more awake time near food than iso31 on all diets, suggesting that overfeeding may contribute to their diet-independent, baseline lifespan reduction (Figure S4A–J). Importantly, diet-independent overfeeding is consistent with increased excretion volume from adult sleep mutants (Figures 2C,S2I), corroborating that awake time-by-food grossly tracks feeding behavior in our flies. Sleep mutants are short-sleeping on all diets, and presumptive overfeeding is driven primarily by increased awake time (Data S3).
We next compared within-genotype awake time-by-food on different diets. iso31 dwelled at high-protein > high-sugar > all-sugar. rye and sss also dwelled at high protein > both other diets, while fmn dwelled similarly at all diets (Figure S4I). Thus, rye and sss mutants with less “iso-like” diet effects on lifespan had more “iso-like” diet effects on presumptive feeding time, while fmn had the most “iso-like” effects of diet on lifespan and the least “iso-like” effects of diet on presumptive feeding time (Figures 4I–P;S4I). This misalignment suggests that feeding differences do not account for differential effects of diet on longevity of sleep mutants vs iso31.
iso31 also slept less on high-protein and high-sugar vs all-sugar; fmn slept equivalently on all 3 diets, rye slept more on high-protein vs all-sugar, and sss slept more on high-protein vs both other diets (Data S3). Diet-induced sleep increases generally do not coincide with AI decreases (Data S3). Relative sleep gains in sleep mutants from dietary nitrogen are unlikely to enhance nitrogen toxicity, and may mitigate it, contributing to our sleep mutant longevity results’ complexity.
Genotype-specific metabolic differences in sleep mutants, including uricotelic pathways that couple sugar intake to nitrogen metabolism, may also contribute to this complexity (Figures 1–2,S1–S2; Data S1) 25. To side-step this, we next tested lifespan on the same diets at 29C in chronically sleep-restricted D>Trp and H>Trp flies. In DGal4, HGal4, and TrpA1 genetic controls, lifespan on high-sugar > high-protein > all-sugar, much like iso31 at 25C (Figure 4Q,R,T,V,W,Y). In contrast, D>Trp flies, while longest-lived on high-sugar, had equivalent lifespan and hazard on high-protein and all-sugar (Figure 4S,X). H>Trp flies showed even more robust effects; both sexes lived longer on all-sugar than high-protein, and males had comparable lifespan and hazard on all-sugar vs high-sugar (Figure 4U,Z). All-sugar diet also rescued lifespan and hazard compared to one or both genetic controls in D>Trp males and all H>Trp flies (Figure S4J–U). These results are consistent with enhanced toxicity of dietary nitrogen, and reduced toxicity or outright protective effects of nitrogen starvation, during chronic sleep loss.
These results are also not attributable to feeding or sleep. Gal4 control, D>Trp, and H>Trp groups all spent awake time at high-protein > high-sugar > all-sugar; TrpA1 controls dwelled similarly at all-sugar and high-protein, but TrpA1 lifespan on high-protein was > all-sugar, like Gal4 controls (Figure S4V–W). Like sleep mutants, D>Trp and H>Trp sleep-restricted flies dwelled longer at all diets vs control genotypes, suggesting that fasting does not drive all-sugar rescue of sleep-restricted lifespan and hazard (Figure S4J–W). D>Trp and H>Trp flies were also sleep-restricted at 29C on all diets, with no within-genotype diet effects on total sleep (Data S3).
Discussion
In this study, we sought metabolic changes common across sleep mutants as candidate effectors of chronic sleep loss on health. Lipid and mitochondrial dysregulation likely contribute to sleep mutant ill health, given redox factors that link sleep to lifespan 15,26. But lipid-metabolism is also widely reported to be affected by acute SD across species 2,27–31. High methylcitrate and low aconitate after acute SD have also been reported, as have effects of lipid metabolism on sleep 27,32–34. Thus, we pursued our findings of altered nitrogen metabolism.
Consistent with reports of its elevation during or after acute SD 35,36, ornithine alone trended up during recovery sleep after mechSD (Figure S1) and may be a leading indicator of nitrogen stress during acute sleep loss. To our knowledge, our finding that polyamines accumulate in sleep mutant heads is the first report of this chronic sleep loss effect in the tissues of any organism 2. However, indirect evidence suggests this extends to humans. Sleep apnea patients excrete elevated ornithine and polyamines 37,38; we found no similar reports with acute SD 2. And acute SD increases putrescine in hyperammonemic but not control rat brain dialysate, consistent with accumulated nitrogen stress being required for polyamine elevation 39.
Terrestrial insects generally lack Otc for urea cycling, and excrete mostly uricotelic metabolites and raw NH4, suggesting sleep mutants with inefficient nitrogen excretion should be hyperammonemic 8 (Figure 2J).Consistent with this, hemolymph total protein and NH4 tend to be high in adult fmn and rye, but puzzlingly not sss (Figure S2G–H). This likely reflects a a P-element in the sss mutant that provides the only functional white cassette in our sleep mutant studies; a white homolog regulates urate metabolism in silkworm 40. Accordingly, sss alone among our sleep mutant and iso31 control genotypes has very high urate (Figure S2C,F; Data S1), which causes nitrogen stress in excess 41. Thus, all three sleep mutants build up nitrogen stress in some form. Polyamine accumulation may buffer this, soaking up nitrogen equivalents, which would reduce but not eliminate nitrogen stress. In fact, polyamines switch from protective to themselves driving nitrogen stress in excess, especially putrescine and acetylated polyamines most enriched in sleep mutant heads (Figures 1,S1) 9.
A role of sleep in nitrogen homeostasis may explain the putrescine soporific function demonstrated by our supplementation and RNAi studies (Figures.2J,3,S3). Polyamine levels are fine-tuned in cells due to their myriad critical roles, including in sleep-relevant pathways like redox balance and autophagy 1,9,15,26,42. Homeostasis is achieved by elaborate and well-conserved synthetic, trafficking, and degradation mechanisms 9. Putrescine’s somnogenic role may complement these cellular mechanisms, dialing up sleep to help bring polyamine levels down if systemic putrescine rises too high. Sleep remains low in short-sleeping mutants despite high polyamines because homeostatic effectors are impaired.
Finally, we report a novel interaction between chronic sleep loss and diet that regulates longevity (Figure 4). High-protein and all-sugar toxicity relative to high-sugar is well known for wild-type flies 19,20. We show that sleep-restricted flies live longer on all-sugar than high-protein compared to control flies, suggesting sensitivity to dietary nitrogen (Figures 2J;4). This was particularly prominent with thermogenetic sleep loss in D>Gal4 and H>Gal4 flies, which showed outright protective effects of all-sugar diet (Figure S4). Sleep-restricted males also appeared somewhat more nitrogen-sensitive than females, perhaps because egg-laying offloads nitrogen.
Our findings have several implications for health. Pathologically, redox balance couples sleep loss to lifespan 15,26. Nitrogen stress is oxidizing, with even generally anti-oxidant species like polyamines and urate becoming oxidizing in excess 9,41. Likely, nitrogen stress drives a subset of metabolic onramps converging on systemic oxidation and short lifespan during chronic sleep loss. Nitrogen stress may also be relevant for sleep loss associated disease. Kidney disease is associated with chronic sleep loss in humans 43,44, and elevated putrescine and polyamine degradation products contribute to kidney failure 45. Chronic sleep loss is also associated with Alzheimer’s disease 46; animal models suggest nitrogen stress precedes cognitive decline 47 and drives beta-amyloid pathology via polyamine synthesis 48, while human Alzheimer’s brains compensate by remodeling nitrogen metabolism away from polyamine synthesis 48,49.
Finally, our work has teleological implications for behavior observed in healthy humans, like increasing sugar intake when sleep-restricted 50,51. Going for the cookies instead of protein-rich food when tired may constitute surprisingly adaptive interactions of the food and sleep homeostasis systems, avoiding nitrogen intake during a period of heightened sensitivity.
STAR Methods
RESOURCE AVAILABILITY
Lead Contact
Requests for further information, resources, or reagents should be directed to Prof. Amita Sehgal at amita@pennmedicine.upenn.edu.
Materials Availability
This study entirely used previously published and/or publically available fly lines.
Data and Code Availability
Our HD4 global metabolomics dataset is deposited on Metabolights at https://www.ebi.ac.uk/metabolights/MTBLS3318.
Previously unreported scripts for time-at-position (multibeamPositionAnalysis_minutesPerDay.m) and awake time-at-position analysis (posWhileAwakeToExcel.m) were deposited to the repository on GitHub (https://github.com/cthsu86/damSleepConverter). Other code used has been previously reported 52.
Other data and additional information required to reanalyze data reported in this paper is available from the lead contact upon request.
EXPERIMENTAL MODEL DETAILS: Drosophila melanogaster
Heavily used fly lines in the manuscript include iso31 control; sleep mutants fmn, rye, and sss on an iso31 background (minimum 5X generations); and geneswitch/dicer lines that were well-established in the lab prior to this study 42. RNAi and sgRNA alleles were ordered from Bloomington Drosophila Stock Center in Indiana, Vienna Drosophila Resource Center in Austria, or Kyoto Stock Center in Japan. UAS-Cas9.P2 (II) was ordered from Bloomington and crossed to our existing ActinGS and ActinGal4 (III) alleles. 60D04- and 11H05-gal4 lines were generously gifted by Kyunghee Koh, and crossed to our existing uas-trpA1 (II) line for thermogenetic studies. See Data S2 for details of each RNAi and sgRNA line used in the manuscript. Except where otherwise noted, adult flies were raised in 12:12LD light:dark cycle incubators at ~25C and ~65% humidity. Mated flies were used for all studies, with the exception of Figure 2D–F, many of which were likely virginal given their youth at the time of collection. Sex and age varied by experiment, as specified in our METHOD DETAILS (next) and figure legends.
METHOD DETAILS
Metabolon global metabolomics and lipidomics
Ten total pools of ~200–250 heads from mixed sex flies aged ~1–2 weeks post-eclosion (~10 days on average) were collected for each genotype, split evenly between HD4 global metabolomics and CLP lipidomics assays. Sexes were pooled to mitigate the large numbers required for the study. Collections were done at ~ZT6; mid-day timepoint was chosen to enrich for metabolites dysregulated by chronic, as opposed to acute, sleep loss. Heads were collected by vortexing whole flies snap frozen on dry ice and separating heads from bodies by size on dry ice-cooled grates. Samples were stored at −80C and shipped to Metabolon on dry ice. Sample preparation, control procedures, and analysis were carried out at Metabolon Inc as described elsewhere 53–57. Both HD4 and CLP procedures are briefly outlined below.
HD4 Global Metabolomics
Samples extracted and spiked with recovery standards using a MicroSTAR System (Hamilton Company) and methanol-precipitated under vigorous shaking Genogrinder 2000 (Glen Mills). Samples were fractionated, dried, resuspended in appropriate solvents, and analyzed using four distinct modes on a Waters ACQUITY ultra-performance liquid chromatography (UPLC) and a Thermo Scientific Q-Exactive high resolution/accurate mass spectrometer interfaced with a heated electrospray ionization (HESI-II) source and Orbitrap mass analyzer operated at 35,000 mass resolution. Metabolites were identified by the Laboratory Information Management System, an automated system that identified ion features in our head lysate samples using a reference library of known metabolites defined by retention time, molecular weight (m/z), preferred adducts, in-source fragments, and associated MS spectra. The data was curated by visual quality control using software developed at Metabolon. Raw data for each metabolite was scaled to its internal median, after imputing the smallest non-zero value for that metabolite for any zeroes.
CLP Lipidomics
Lipids were extracted using a modified Bligh-Dyer extraction method with deuterated internal standards. Samples were then subjected to infusion-MS analysis in both positive and negative modes on a Shimadzu LC with nano PEEK tubing and a Sciex SelexIon-5500 QTRAP in MRM mode (>1,100 MRMs). Individual lipids were quantified as signal / internal standard and summed into class and total lipid concentrations.
Acute SD targeted nitrogen metabolomics
Twenty total pools of ~90 mixed sex iso31 flies aged ~1.5 weeks post-eclosion were divided evenly among four conditions: (1) collected at ZT2, (2) collected at ZT14, (3) collected at ZT2 after a 14hr mechanical sleep deprivation, and (4) collected at ZT2 after a 12hr sleep deprivation followed by a 2hr sleep rebound. Heads were collected by vortexing whole flies snap frozen on dry ice and separating heads from bodies by size on dry ice-cooled grates. Samples were stored at −80C until they were processed. Samples were extracted and prepared for LC-MS analysis as previously described 58,59. Briefly, a stainless steel bead and 300 μl of 2:1 Methanol:Chloroform were added to each sample. Samples were homogenized for a total of 4 minutes at 25 Hz in a tissue homogenizer. Next, 100 μl of water and chloroform were added to each sample. Samples were vortexed and then centrifuged for 10 minutes at 13,300 rpm at 4°C. 170 μl of the upper fraction containing polar metabolites was collected from each sample and dried in a speed vacuum for 2.5 hours. Dried fractions were resuspended in 100 μl of acetonitrile:water, vortexed for 20 seconds and centrifuged for 10 minutes at 13,300 rpm at 4°C prior to transferring to MS vials. Samples were analyzed in analytical triplicates and pooled quality control samples were run at the beginning and end of the run as well as after every 6th injection. For each sample, 2 μl were injected onto an Acquity UPLC BEH Amide column (1.7 μm, 2.1 mm × 150 mm) with a 0.2 μm inline precolumn filter using an Acquity H-Class UPLC system (Waters Corporation) coupled to a Xevo TQ-S micro mass spectrometer operating in a positive ion polarity mode. Initial chromatographic conditions consisted of 100% Solvent D (90:10 Acetonitrile:water, 2 mM Ammonium Acetate, 0.2% Formic Acid) ramped to 79.4% Solvent A (95:5 milliQH2O:Acetontrile, 2 mM Ammonium Acetate, 0.2% Formic Acid) in 15 minutes. The column was washed in 100% Solvent A for 5.5 minutes before reequilibrating in 100% D. A total of 18 compounds were measured through targeted MRM methods. Transitions for Urea, Sarcosine, Proline, Trans-4-Hydroxyproline, Ornithine, Spermidine, Acetylornithine, Citrulline, SAM, Spermine, Glutamate, 4-Guanidinobutanoic Acid, Creatine, Acetylputrescine, and GABA were used as described in 59. Additional transitions were added for Argininosuccinate (291.13/70.07 (15/40) [(Cone Voltage/Collision Energy]), Arginine (157.14/60.05 (30/12)), and Putrescine (88.9/54.86 (14/16) and 89.11/72.08 (15/20)). Data was processed using TargetLynx (Waters) to obtain ion counts for further analysis using an in-house R-script. Spermine is excluded from our results because of low signal / high noise that rendered the signal suspect. Urea is excluded from our results because we were unable to corroborate its relevance through biochemical methods.
Lysate collection from whole flies for biochemistry
Whole bodies were used in lieu of heads because of difficulty consistently detecting many target metabolites in heads using biochemical methods. Pools of 5 female or 5 male ~10-day post-eclosion flies were anesthetized with CO2 and quickly sorted into 2mL Safelock Tubes, weighed, then snap frozen on dry ice. Blocks were pre-chilled to 4C, and the tubes were transferred to wet ice, where 200uL of 1X PBS supplemented with 1 cOmplete EDTA-free protease inhibitor tablet / 2.5mLs PBS (PBS-PI) and a stainless steel bead were added. Samples were quickly loaded into chilled blocks and lysed on a TissueLyser II (Qiagen) at 25.0m/sec in two 2-min bursts. Beads were removed and solid detritus was pelleted by spinning at 15,000rpm for 15min at 4C. Supernatant was carefully transferred to a clean tube and diluted 1:4 in PBS-PI before being used for total protein, ammonia, and urate (uric acid) biochemical assays.
Hemolymph collection from female flies for biochemistry
Only female flies were run for these experiments because their typical hemolymph volume is much higher than males. Groups of 25 ~10-day post-eclosion flies were anesthetized with CO2, rapidly pricked in the thorax with tungsten probes (Ted Pella 13570), and loaded into 0.5mL Ependorfs perforated at the base with 22-gauge syringe tips, which were nested inside of 1.5mL Ependorfs containing 45uL of PBS-PI. Nested tubes were then centrifuged at 5000rpm for 5min at 4C. 25uL of hemolymph + PBS-PI was removed for total protein analysis, and the remaining ~20uL was diluted with a further 60uL of PBS-PI for ammonia analysis. Flies were weighed after hemolymph harvest.
Excrement collection from male flies for biochemistry
Only male flies were run for these experiments to eliminate egg-laying as a confound. Groups of 12 flies were anesthetized with CO2 and sorted into 1.5mL Ependorf tubes perforated twice through each cap with an 18-gauge needle. The flies were returned to their home incubators for 2 hours, then anesthetized with CO2 and flipped into fresh 1.5mL Ependorf tubes to be weighed. The excrement in the first set of Ependorfs was resuspended by vortexing into 150uL of PBS-PI, which was used at this concentration to run ammonia and urate (uric acid) biochemical assays. For sleep mutant studies, ~10 day or ~1 day post-eclosion flies were tested at ZT0-2, ZT10-12, or ZT17-19. For acute mechanical SD studies, ~10 day post-eclosion flies were sleep deprived for 12hr overnight and tested at ZT0-2. For thermogenetic SD studies, ~1–4 day post-eclosion flies raised in an 18–20C room were (i) stored at 18C for ~9 days, then moved to 29C for ~1 day of acute sleep restriction before testing, or (ii) stored at 29C for ~10 days of chronic sleep restriction before testing. Thermogenetic flies were entrained to 12:12LD during the ~10 day variable temperature period, and excretion was tested at 29C from ZT10-12 (zeitgeber time chosen for most consistent excretion effects in sleep mutants).
Biochemical Assays: Total Protein, Ammonia, Uric Acid, Urea
Total protein assay was conducted using an Abcam 207003 total protein assay kit according to manufacturer instructions: absorbance measured at 540nm. Ammonia assay was conducted using a Sigma-Aldrich MAK310 kit according to manufacturer instructions: fluorescence measured at excitation 355nm / emission 460nm. Uric acid assay was conducted using a Sigma-Aldrich MAK077 kit according to manufacturer instructions: fluorescence measured at excitation 535nm / emission 595nm. Signal from all biochemical assays was normalized to body weight of the pools of flies that provided the material. Fluorescence and absorbance were measured using a Victor-3V plate reader (Perkin-Elmer) or a Cytation 5 (BioTek).
Blue-Poo Assay
Male flies were pre-fed on our lab’s standard yeast-molasses food supplemented with 2.5mg/mL of FD&C blue 1 / FCF brilliant blue dye for 24 hours. Excrement was then collected and resuspended into 150uL of MilliQ water. Absorbance was measured at 620nm and normalized to body weight to calculate fecal volume.
Sleep Experiments
For polyamine supplementation experiments, ~3–5 days post-eclosion flies of both sexes were loaded into locomotor tubes with 5% sucrose / 2% agar food supplemented with water vehicle, 16mM L-ornithine monohydrochloride (Sigma-Aldrich 2375), 16mM putrescine dihydrochloride (Sigma-Aldrich P7505), or 16mM spermidine trihydrochloride (Sigma-Aldrich S2501). Sleep was measured from movements on DAM5H multibeam monitors (Trikinetics), averaged across the 2nd-4th full days of recording. A follow-up study with vehicle vs 50mM L-ornithine monohydrochloride was later conducted separately. Supplement doses were chosen based on a pilot dosing curve assaying sleep and toxicity with DAM2 monitors (data not shown) and published work supporting 16mM as a reasonable dose for screening sleep effects with amino acids and chemically similar polyamines 17,60. In addition to standard sleep and activity metrics, average time spent / day at each of the 15 possible beam positions is reported for these datasets.
For nitrogen metabolism RNAi screen, ~3–5 days post-eclosion female flies were loaded into locomotor tubes with 5% sucrose / 2% agar food supplemented with 500uM mifepristone (RU+ food) (Sigma-Aldrich M8046). Only females were used for this screen and all follow-up behavior and qPCR experiments, because lower female baseline sleep allows more reliable detection of sleep gain phenotypes, especially with the relatively small n’s used for behavioral screening. Sleep was recorded from counts of beam breaks on single-beam DAM2 monitors (Trikinetics), and the 4th-5th full days of exposure to RU+ food were averaged to determine sleep. Geneswitch(GS)>Dicer,RNAi crosses with mean sleep at least 60 min higher or lower than both GS>Dicer and RNAi controls were considered potential hits and validated. Validation of promising crosses was carried out similarly to the screen, but included both RU+ and ethanol vehicle (RU-) food conditions to assess whether effects were acute. If the first validation experiment was inconsistent with the initial screen result for a given RNAi, further validation of that RNAi was terminated. At least two independent validation experiments were run for each nitrogen RNAi cross identified as having a legitimate sleep phenotype. Hits showing sleep gain were subsequently re-validated by analyzing movements collected on DAM5H multibeam sleep monitors, to rule out possible position confounds. Later follow-up RNAi and Crispr studies were setup similarly to the description above, but used DAM5H multibeam monitors from the outset.
For awake-time-by-food and sleep analysis of sleep mutant and thermogenetic sleep-restriction flies and their genotypic controls, only male flies were used to avoid oviposition as a confound. ~3–5 days post-eclosion males were loaded onto DAM5H multibeam sleep monitors in locomotor tubes containing high-protein, high-sugar, or all-sugar diets used for lifespan analysis (below). Movements and position distribution were recorded from full Days 2–4 post-loading, averaged, and used to calculate standard sleep and activity metrics, as well as absolute and % awake time / day spent adjacent to food.
DAMfilescan and previously reportedcustom MatLab scripts were used to calculate sleep metrics for both sets of experiments 52. Awake time-by-sleep scripts are novel, and archived at GitHub (see above).
qPCR Validation of Nitrogen Pathway RNAis
To confirm knockdown of target transcripts with RNAi and Crispr tools, we drove expression with actinGS>dcr (RNAi) or actinGS>cas9 (Crispr) and followed the same whole-fly RNA collection, cDNA synthesis, and qPCR method we published previously 42. The following qPCR primer sets were used for each target transcript: asl forward: TCGACAAGCTGTCCCAAGTG reverse: CACCAGATAGTAGGCCCAGTC spds forward: GAAACACGCGCTGAAGGATG reverse: GGCATAGGCCACCTTAGCAA sms forward: GAGCTGCAGAACATTGCTGA reverse: GTACAACAAGGCGCCATCAC α-tubulin forward: CGTCTGGACCACAAGTTCGA reverse: CCTCCATACCCTCACCAACGT
Lifespan Experiments
For all lifespan studies, mated flies of both sexes that had eclosed within the preceding ~2 days (sleep mutant studies) or ~3–4 days (thermogenetic studies) were collected under CO2 anesthesia and housed single-sex on standard or special food at a maximum density of 30/vial.
For classical lifespan studies, flies were flipped to fresh vials and dead were tallied every 3 days (experiments comparing sleep mutant lifespans to control on standard food) or every 2 days (all other experiments). Lifespan vials were co-housed in their incubators with water dishes, to provide supplemental humidity. The w/v of nourishing solutes of roughly similar caloric density were equal for each diet, to minimize differences in caloric density among the diets. Each vial was longitudinally maintained on the same assigned food condition, and dead flies were counted at each flip, tracking survival in this way until all flies were dead. Flies were never again anesthetized after initial collection. Flies that escaped during flips were excluded from analysis.
Sehgal Lab Standard Yeast-Molasses Diet: 64.7g/L corn meal; 27.1g/L dry yeast; 8g/L agar; 61.6mL/L molasses; 10.2mL/L 20% tegosept; 2.5mL/L propionic acid
High-Protein Diet: Sehgal Lab Standard Yeast-Molasses + extra 116g/L yeast
High-Sugar Diet: Sehgal Lab Standard Yeast-Molasses + extra 116g/L sucrose
All-Sugar Diet: 27% w/v sucrose-agar with 10.2mL/L 20% tegosept and 2.5ml/L propionic acid.
For survival on nitrogenous metabolite supplementation studies, flies were initially maintained on standard food, then loaded into locomotor tubes containing 5% sucrose / 2% agar food drugged with either water vehicle or 16mM ornithine, putrescine, or spermidine at ~3–4 days post-eclosion. Behavior was recorded using single-beam DAM monitors until the end of the sixth complete day on supplemented food. Sleep records were analyzed similarly to starvation-challenge, except that all flies surviving past the sixth full day of recording were censored.
QUANTIFICATION AND STATISTICAL ANALYSIS
For molecular studies where lower n’s precluded reliable normality pre-testing, a parametric distribution was assumed. For sleep and feeding behavior experiments, higher n’s allowed reliable Shapiro-Wilkes pre-testing of all groups’ normality to determine whether parametric or non-parametric testing was appropriate for each metric, in each individual experiment. Lifespan studies used specialized non-parametric and semi-parametric statistical approaches. Prism or JMP software was used to carry out all statistical analyses. The following tests were used in the indicated conditions:
--Two groups, or multiple control groups vs one experimental group 61: Welch’s t-test (parametric) or Mann-Whitney test (non-parametric).
--Single control group vs multiple experimental groups: Dunnett test (parametric) or Steel test (non-parametric). Where multiple Dunnett tests were required, they were run as posthoc tests of a two-way ANOVA model.
--All-to-all comparisons, or complex subsets of all comparisons: Tukey HSD test (parametric) or Steel-Dwass test (non-parametric)
--% awake time near food (Data S3) is reported as raw percentages for more intuitive presentation of the data, but statistical tests were conducted on arcsin-transformed percentage values, to more closely approximate an unbounded distribution.
--Mass spectrometry: Welch’s t-tests with Benjamini-Hochberg FDR correction.
--qPCR validation of RNAi knockdown efficiency: one-tailed t-tests
--Lifespan: Wilcoxon tests were used to measure differences in survival. Likelihood tests of differences in Cox proportional hazard ratios were used to measure differences in hazard. Posthoc Bonferroni correction was applied to the significance threshold for survival and hazard comparisons where familywise error was cumulative 62.
Additional details for individual experiments (n definition and number, summary statistics, etc) can be found in corresponding Figure Legends.
Supplementary Material
Data S1. Unbiased metabolomics screen of sleep mutant Drosophila melanogaster. Related to Figures 1 and S1.
A: sleep mutant / iso31 control expression level of metabolites in assorted ureotelic and uricotelic nitrogen pathways, organized roughly in order within their respective pathways.
B: sleep mutant / iso31 control expression levels of metabolites contributing to the Venn diagram in Figure 1A.
C: sleep mutant / iso31 control expression level of all metabolites from both the HD4 global metabolomics screen (top) and CLP lipidomics screen (bottom). Individual metabolites are loosely grouped by their predominant superpathway and subpathway groupings. p-values and q-values for each sleep mutant vs iso31 control comparison can be found on the right.
D: scaled, imputed metabolite levels for each individual iso31, fmn, rye, and sss sample for both the HD4 (top) and CLP (bottom) screens.
E: original scale metabolite levels for each individual iso31, fmn, rye, and sss sample for both the HD4 (top) and CLP (bottom) screens.
Data S2. Auxiliary sleep data from polyamine feeding and nitrogen metabolism RNAi and Crispr-KO sleep experiments. Related to Figures 3 and S3.
A: key listing stock center information and our own identifiers for each RNAi used for our sleep screens, and sgRNAs used in follow-up experiments
B: first-pass female total sleep mean, SEM, and n for each experimental and control group in our actinGS sleep screen. Difference of mean total sleep in each cross vs both control groups is also shown. Crosses that were considered first-pass hits (cross mean total sleep >=60min either higher or lower than both controls) are highlighted in gray. Crosses that survived validation and were identified as genuine hits are highlighted in red (sleep lower than controls) or blue (sleep higher than controls).
C: as Tab#4, but nsybGS screen.
D: raw data, summary statistics, and where applicable provisional hypothesis-testing statistics for sleep screen hits that failed at any point in the validation pipeline. The reason for invalidating each hit is clearly stated.
E: single-beam validation experiments for sleep-loss screen hit actinGS>dcr,asl-RNAi#1, auxiliary sleep and activity metrics. Same flies as Figure 3B,E.
F: single-beam and multi-beam validation experiments for sleep-gain screen hit actinGS>dcr,spds-RNAi#1, auxiliary sleep and activity metrics. Same flies as Figure 3C,F,H.
G: single-beam and multi-beam validation experiments for sleep-gain screen hit actinGS>dcr,sms-RNAi#4, auxiliary sleep and activity metrics. Same flies as Figure 3D,G,I.
H: multi-beam re-testing of sleep gain with actinGS>dcr,spds-RNAi#5 prompted by qPCR studies, auxiliary sleep and activity metrics. Same flies as Figure 3J.
I: multi-beam re-testing of sleep gain with actinGS>dcr,sms-RNAi#5 prompted by qPCR studies, auxiliary sleep and activity metrics. Same flies as Figure S3I.
J: multi-beam auxiliary sleep and activity metrics in actinGS>cas9,spds-sgRNA flies. Same flies as Figure 3K.
K: multi-beam auxiliary sleep and activity metrics in actinGS>cas9,asl-sgRNA flies. Same flies as Figure S3J.
L: multi-beam auxiliary sleep and activity metrics in actinGal4>cas9,spds-sgRNA flies. Same flies as Figure S3M.
M: multi-beam auxiliary sleep and activity metrics in actinGal4>cas9,asl-sgRNA flies. Same flies as Figure S3N.
N: multi-beam auxiliary sleep and activity metrics from female flies on vehicle control or 16mM ornithine, putrescine, or spermidine. Same flies as Figures 3L,N and S3O,P.
O: multi-beam auxiliary sleep and activity metrics from male flies on vehicle control or 16mM ornithine, putrescine, or spermidine. Same flies as Figures 3M,O and S3Q,R.
P: multi-beam auxiliary sleep and activity metrics from female flies on vehicle control or 50mM ornithine. Same flies as Figures 3P and S3S,T.
Q: multi-beam auxiliary sleep and activity metrics from male flies on vehicle control or 50mM ornithine. Same flies as Figures 3Q and S3U,V.
Data S3. Sleep data and % awake time near food from sleep mutants and thermogenetically sleep-restricted flies on special diets. Related to Figures 4 and S4.
All tabs show sleep metrics from the same flies subjected to awake-time-near-food analysis on multibeam sleep monitors in Figure S4.
A: male fmn, rye, and sss sleep mutants and iso31 control flies at 25C.
B: male 60D04-Gal4/+ control, UAS-TrpA1 control, and 60D04>TrpA1 sleep-restricted flies at 29C.
C: male 11H05-Gal4/+ control, UAS-TrpA1 control, and 11H05>TrpA1 sleep-restricted flies at 29C.
KEY RESOURCES TABLE.
| REAGENT or RESOURCE | SOURCE | IDENTIFIER |
|---|---|---|
| Antibodies | ||
| n/a | ||
| Bacterial and virus strains | ||
| n/a | ||
| Biological samples | ||
| n/a | ||
| Chemicals, peptides, and recombinant proteins | ||
| FCF Brilliant Blue Dye (FD&C blue no1 dye) | Spectrum Chemicals | FD110 |
| Agar, Drosophila Type | Fisher | NC1429200 |
| Corn Meal | LabScientific Inc | FLY-8010-20 |
| Molasses | Gennessee Scientific | 62-118 |
| Drosophila Dry Active Yeast | LabScientific Inc | FLY-8040-10 |
| D-Sucrose | Fisher Scientific | BP220-212 |
| L-Ornithine Monohydrochloride | Sigma-Aldrich | O2375 |
| Putrescine Dihydrochloride | Sigma-Aldrich | P7505 |
| Spermidine Trihydrochloride | Sigma-Aldrich | S2501 |
| SYBR Green PCR Master Mix | Lifetech | 4364344 |
| Mifepristone (RU486) | Sigma-Aldrich | M8046 |
| Critical commercial assays | ||
| Ammonia Assay Kit | Sigma-Aldrich | MAK310 |
| Uric Acid (Urate) Assay Kit | Sigma-Aldrich | MAK077 |
| BCA Protein Assay Kit | Abcam | ab207003 |
| Deposited data | ||
| HD4 unbiased global metabolomics dataset from sleep mutant and control fly heads | Metabolon | Deposited on Metabolights as MTBLS3318 |
| Experimental models: Cell lines | ||
| n/a | ||
| Experimental models: Organisms/strains | ||
| iso31 control strain | lab generated allele | PMID: 15238529 63 |
| fumin (fmn: backcrossed 5X to iso31) | gift from Kazuhiko Kume | PMID: 16093388 4 |
| redeye (rye: backcrossed 5X to iso31) | lab generated allele | PMID: 24497543 5 |
| sleepless P1 (sss: backcrossed 5X to iso31) | lab generated allele | PMID: 18635795 6 |
| 60D04-gal4 | gift from Kyunghee Koh; also available from Bloomington Drosophila Stock Center | Bloomington #45356 15,16,64 |
| 11H05-gal4 | gift from Kyunghee Koh; also available from Bloomington Drosophila Stock Center | Bloomington #45016 15,16,64 |
| UAS-trpA1 (II) (backcrossed 5X to iso31) | gift from Leslie Griffiths | PMID: 18548007 65 |
| actin-geneswitch (actinGS: backcrossed 5X to iso31) | gift from Ken Irvine | PMID: 16269336 66 |
| UAS-dicer2 (II) (w1118) | Vienna Drosophila Resource Center | VDRC #60008 |
| nsyb-geneswitch (nsybGS: backcrossed 5X to iso31) | lab generated allele | PMID: 29590612 67 |
| assorted RNAi’s and sgRNA’s (stock center backgrounds) | see Data S2 | see Data S2 |
| Oligonucleotides | ||
| Drosophila asl forward qPCR primer (TCGACAAGCTGTCCCAAGTG) | Integrated DNA Technologies (IDT) | n/a |
|
Drosophila asl reverse qPCR primer (CACCAGATAGTAGGCCCAGTC) |
Integrated DNA Technologies (IDT) | n/a |
|
Drosophila spds forward qPCR primer (GAAACACGCGCTGAAGGATG) |
Integrated DNA Technologies (IDT) | n/a |
|
Drosophila spds reverse qPCR primer (GGCATAGGCCACCTTAGCAA) |
Integrated DNA Technologies (IDT) | n/a |
|
Drosophila sms forward qPCR primer (GAGCTGCAGAACATTGCTGA) |
Integrated DNA Technologies (IDT) | n/a |
|
Drosophila sms reverse qPCR primer (GTACAACAAGGCGCCATCAC) |
Integrated DNA Technologies (IDT) | n/a |
|
Drosophila α-tub forward qPCR primer (CGTCTGGACCACAAGTTCGA) |
Integrated DNA Technologies (IDT) | n/a |
|
Drosophila α-tub reverse qPCR primer (CCTCCATACCCTCACCAACGT) |
Integrated DNA Technologies (IDT) | n/a |
| Recombinant DNA | ||
| n/a | ||
| Software and algorithms | ||
| JMP 13 | JMP | Download at JMP.com |
| GraphPad Prism | GraphPad | Download at GraphPad.com |
| DAMfilescan | Trikinetics | Free download at https://trikinetics.com |
| Matlab | Mathworks | Download at Mathworks.com |
| Other | ||
| Single-Beam Sleep Monitors | Trikinetics | DAM2 |
| Multi-Beam (15 Beams) Sleep Monitors | Trikinetics | DAM5H |
Highlights.
Nitrogen metabolism is remodeled in sleep mutants, but not after acute sleep loss.
Nitrogen excretion efficiency is impaired by chronic, but not acute, sleep loss.
Polyamines, primarily putrescine, are novel somnogens.
Chronic sleep loss exacerbates the toxicity of dietary nitrogen sources.
Acknowledgements
The Howard Hughes Medical Institute, R01DK120757, NIA F32 AG056081, and NINDS K99 NS118561 funded this work.
Footnotes
Declaration of Interests
The authors declare no competing interests.
Publisher's Disclaimer: This is a PDF file of an unedited manuscript that has been accepted for publication. As a service to our customers we are providing this early version of the manuscript. The manuscript will undergo copyediting, typesetting, and review of the resulting proof before it is published in its final form. Please note that during the production process errors may be discovered which could affect the content, and all legal disclaimers that apply to the journal pertain.
References
- 1.Mignot E (2008). Why We Sleep: The Temporal Organization of Recovery. PLoS Biol 6, e106. 10.1371/journal.pbio.0060106. [DOI] [PMC free article] [PubMed] [Google Scholar]
- 2.Malik DM, Paschos GK, Sehgal A, and Weljie AM (2020). Circadian and Sleep Metabolomics Across Species. Journal of Molecular Biology 432, 3578–3610. 10.1016/j.jmb.2020.04.027. [DOI] [PMC free article] [PubMed] [Google Scholar]
- 3.Dubowy C, and Sehgal A (2017). Circadian Rhythms and Sleep in Drosophila melanogaster. Genetics 205, 1373–1397. 10.1534/genetics.115.185157. [DOI] [PMC free article] [PubMed] [Google Scholar]
- 4.Kume K, Kume S, Park SK, Hirsh J, and Jackson FR (2005). Dopamine is a regulator of arousal in the fruit fly. J. Neurosci. 25, 7377–7384. 10.1523/JNEUROSCI.2048-05.2005. [DOI] [PMC free article] [PubMed] [Google Scholar]
- 5.Shi M, Yue Z, Kuryatov A, Lindstrom JM, and Sehgal A (2014). Identification of Redeye, a new sleep-regulating protein whose expression is modulated by sleep amount. Elife 3, e01473. 10.7554/eLife.01473. [DOI] [PMC free article] [PubMed] [Google Scholar]
- 6.Koh K, Joiner WJ, Wu MN, Yue Z, Smith CJ, and Sehgal A (2008). Identification of SLEEPLESS, a sleep-promoting factor. Science 321, 372–376. 10.1126/science.1155942. [DOI] [PMC free article] [PubMed] [Google Scholar]
- 7.Chen W-F, Maguire S, Sowcik M, Luo W, Koh K, and Sehgal A (2015). A neuron-glia interaction involving GABA transaminase contributes to sleep loss in sleepless mutants. Mol. Psychiatry 20, 240–251. 10.1038/mp.2014.11. [DOI] [PMC free article] [PubMed] [Google Scholar]
- 8.Weihrauch D, and O’Donnell MJ (2021). Mechanisms of nitrogen excretion in insects. Current Opinion in Insect Science 47, 25–30. 10.1016/j.cois.2021.02.007. [DOI] [PubMed] [Google Scholar]
- 9.Miller-Fleming L, Olin-Sandoval V, Campbell K, and Ralser M (2015). Remaining Mysteries of Molecular Biology: The Role of Polyamines in the Cell. Journal of Molecular Biology 427, 3389–3406. 10.1016/j.jmb.2015.06.020. [DOI] [PubMed] [Google Scholar]
- 10.Yan L-J, Levine RL, and Sohal RS (1997). Oxidative damage during aging targets mitochondrial aconitase. Proceedings of the National Academy of Sciences 94, 11168–11172. 10.1073/pnas.94.21.11168. [DOI] [PMC free article] [PubMed] [Google Scholar]
- 11.Fu M-X, Requena JR, Jenkins AJ, Lyons TJ, Baynes JW, and Thorpe SR (1996). The Advanced Glycation End Product, Nϵ-(Carboxymethyl)lysine, Is a Product of both Lipid Peroxidation and Glycoxidation Reactions. Journal of Biological Chemistry 271, 9982–9986. 10.1074/jbc.271.17.9982. [DOI] [PubMed] [Google Scholar]
- 12.Amaral AU, Cecatto C, Castilho RF, and Wajner M (2016). 2-Methylcitric acid impairs glutamate metabolism and induces permeability transition in brain mitochondria. J Neurochem 137, 62–75. 10.1111/jnc.13544. [DOI] [PubMed] [Google Scholar]
- 13.Melo DR, Mirandola SR, Assunção NA, and Castilho RF (2012). Methylmalonate impairs mitochondrial respiration supported by NADH-linked substrates: Involvement of mitochondrial glutamate metabolism. J. Neurosci. Res. 90, 1190–1199. 10.1002/jnr.23020. [DOI] [PubMed] [Google Scholar]
- 14.Dilley LC, Vigderman A, Williams CE, and Kayser MS (2018). Behavioral and genetic features of sleep ontogeny in Drosophila. Sleep 41. 10.1093/sleep/zsy086. [DOI] [PMC free article] [PubMed] [Google Scholar]
- 15.Vaccaro A, Kaplan Dor Y, Nambara K, Pollina EA, Lin C, Greenberg ME, and Rogulja D (2020). Sleep Loss Can Cause Death through Accumulation of Reactive Oxygen Species in the Gut. Cell 181, 1307–1328.e15. 10.1016/j.cell.2020.04.049. [DOI] [PubMed] [Google Scholar]
- 16.Seidner G, Robinson JE, Wu M, Worden K, Masek P, Roberts SW, Keene AC, and Joiner WJ (2015). Identification of Neurons with a Privileged Role in Sleep Homeostasis in Drosophila melanogaster. Curr Biol 25, 2928–2938. 10.1016/j.cub.2015.10.006. [DOI] [PMC free article] [PubMed] [Google Scholar]
- 17.Kanaya HJ, Park S, Kim J, Kusumi J, Krenenou S, Sawatari E, Sato A, Lee J, Bang H, Kobayakawa Y, et al. (2020). A sleep-like state in Hydra unravels conserved sleep mechanisms during the evolutionary development of the central nervous system. Sci. Adv. 6, eabb9415. 10.1126/sciadv.abb9415. [DOI] [PMC free article] [PubMed] [Google Scholar]
- 18.Yamazaki M, Tomita J, Takahama K, Ueno T, Mitsuyoshi M, Sakamoto E, Kume S, and Kume K (2012). High calorie diet augments age-associats sleep impairment in Drosophila. Biochemical and Biophysical Research Communications 417, 812–816. 10.1016/j.bbrc.2011.12.041. [DOI] [PubMed] [Google Scholar]
- 19.Fontana L, Partridge L, and Longo VD (2010). Extending healthy life span--from yeast to humans. Science 328, 321–326. 10.1126/science.1172539. [DOI] [PMC free article] [PubMed] [Google Scholar]
- 20.Good TP, and Tatar M (2001). Age-specific mortality and reproduction respond to adult dietary restriction in Drosophila melanogaster. J Insect Physiol 47, 1467–1473. 10.1016/s0022-1910(01)00138-x. [DOI] [PubMed] [Google Scholar]
- 21.Longo VD, and Panda S (2016). Fasting, Circadian Rhythms, and Time-Restricted Feeding in Healthy Lifespan. Cell Metab 23, 1048–1059. 10.1016/j.cmet.2016.06.001. [DOI] [PMC free article] [PubMed] [Google Scholar]
- 22.Murphy KR, Deshpande SA, Yurgel ME, Quinn JP, Weissbach JL, Keene AC, Dawson-Scully K, Huber R, Tomchik SM, and Ja WW (2016). Postprandial sleep mechanics in Drosophila. Elife 5, e19334. 10.7554/eLife.19334. [DOI] [PMC free article] [PubMed] [Google Scholar]
- 23.Brown EB, Shah KD, Faville R, Kottler B, and Keene AC (2020). Drosophila insulin-like peptide 2 mediates dietary regulation of sleep intensity. PLoS Genet 16, e1008270. 10.1371/journal.pgen.1008270. [DOI] [PMC free article] [PubMed] [Google Scholar]
- 24.Mishra P, Yang SE, Montgomery AB, Reed AR, Rodan AR, and Rothenfluh A (2021). The fly liquid-food electroshock assay (FLEA) suggests opposite roles for neuropeptide F in avoidance of bitterness and shock. BMC Biol 19, 31. 10.1186/s12915-021-00969-7. [DOI] [PMC free article] [PubMed] [Google Scholar]
- 25.van Dam E, van Leeuwen LAG, Dos Santos E, James J, Best L, Lennicke C, Vincent AJ, Marinos G, Foley A, Buricova M, et al. (2020). Sugar-Induced Obesity and Insulin Resistance Are Uncoupled from Shortened Survival in Drosophila. Cell Metab 31, 710–725.e7. 10.1016/j.cmet.2020.02.016. [DOI] [PMC free article] [PubMed] [Google Scholar]
- 26.Hill VM, O’Connor RM, Sissoko GB, Irobunda IS, Leong S, Canman JC, Stavropoulos N, and Shirasu-Hiza M (2018). A bidirectional relationship between sleep and oxidative stress in Drosophila. PLoS Biol. 16, e2005206. 10.1371/journal.pbio.2005206. [DOI] [PMC free article] [PubMed] [Google Scholar]
- 27.Thimgan MS, Seugnet L, Turk J, and Shaw PJ (2015). Identification of genes associated with resilience/vulnerability to sleep deprivation and starvation in Drosophila. Sleep 38, 801–814. 10.5665/sleep.4680. [DOI] [PMC free article] [PubMed] [Google Scholar]
- 28.Cirelli C, Gutierrez CM, and Tononi G (2004). Extensive and Divergent Effects of Sleep and Wakefulness on Brain Gene Expression. Neuron 41, 35–43. 10.1016/S0896-6273(03)00814-6. [DOI] [PubMed] [Google Scholar]
- 29.Weljie AM, Meerlo P, Goel N, Sengupta A, Kayser MS, Abel T, Birnbaum MJ, Dinges DF, and Sehgal A (2015). Oxalic acid and diacylglycerol 36:3 are cross-species markers of sleep debt. Proc. Natl. Acad. Sci. U.S.A. 112, 2569–2574. 10.1073/pnas.1417432112. [DOI] [PMC free article] [PubMed] [Google Scholar]
- 30.Davies SK, Ang JE, Revell VL, Holmes B, Mann A, Robertson FP, Cui N, Middleton B, Ackermann K, Kayser M, et al. (2014). Effect of sleep deprivation on the human metabolome. Proceedings of the National Academy of Sciences 111, 10761–10766. 10.1073/pnas.1402663111. [DOI] [PMC free article] [PubMed] [Google Scholar]
- 31.Hinard V, Mikhail C, Pradervand S, Curie T, Houtkooper RH, Auwerx J, Franken P, and Tafti M (2012). Key Electrophysiological, Molecular, and Metabolic Signatures of Sleep and Wakefulness Revealed in Primary Cortical Cultures. Journal of Neuroscience 32, 12506–12517. 10.1523/JNEUROSCI.2306-12.2012. [DOI] [PMC free article] [PubMed] [Google Scholar]
- 32.Pamboro ELS, Brown EB, and Keene AC (2020). Dietary fatty acids promote sleep through a taste-independent mechanism. Genes, Brain and Behavior 19. 10.1111/gbb.12629. [DOI] [PubMed] [Google Scholar]
- 33.Thimgan MS, Suzuki Y, Seugnet L, Gottschalk L, and Shaw PJ (2010). The perilipin homologue, lipid storage droplet 2, regulates sleep homeostasis and prevents learning impairments following sleep loss. PLoS Biol. 8. 10.1371/journal.pbio.1000466. [DOI] [PMC free article] [PubMed] [Google Scholar]
- 34.Thimgan MS, Kress N, Lisse J, Fiebelman C, and Hilderbrand T (2018). The acyl-CoA Synthetase, pudgy, Promotes Sleep and Is Required for the Homeostatic Response to Sleep Deprivation. Front. Endocrinol. 9, 464. 10.3389/fendo.2018.00464. [DOI] [PMC free article] [PubMed] [Google Scholar]
- 35.Grant LK, Ftouni S, Nijagal B, De Souza DP, Tull D, McConville MJ, Rajaratnam SMW, Lockley SW, and Anderson C (2019). Circadian and wake-dependent changes in human plasma polar metabolites during prolonged wakefulness: A preliminary analysis. Sci Rep 9, 4428. 10.1038/s41598-019-40353-8. [DOI] [PMC free article] [PubMed] [Google Scholar]
- 36.Honma A, Revell VL, Gunn PJ, Davies SK, Middleton B, Raynaud FI, and Skene DJ (2020). Effect of acute total sleep deprivation on plasma melatonin, cortisol and metabolite rhythms in females. Eur J Neurosci 51, 366–378. 10.1111/ejn.14411. [DOI] [PMC free article] [PubMed] [Google Scholar]
- 37.Xu H, Zheng X, Qian Y, Guan J, Yi H, Zou J, Wang Y, Meng L, Zhao A, Yin S, et al. (2016). Metabolomics Profiling for Obstructive Sleep Apnea and Simple Snorers. Sci Rep 6, 30958. 10.1038/srep30958. [DOI] [PMC free article] [PubMed] [Google Scholar]
- 38.Xu H, Li X, Zheng X, Xia Y, Fu Y, Li X, Qian Y, Zou J, Zhao A, Guan J, et al. (2018). Pediatric Obstructive Sleep Apnea is Associated With Changes in the Oral Microbiome and Urinary Metabolomics Profile: A Pilot Study. Journal of Clinical Sleep Medicine 14, 1559–1567. 10.5664/jcsm.7336. [DOI] [PMC free article] [PubMed] [Google Scholar]
- 39.Marini S, Santangeli O, Saarelainen P, Middleton B, Chowdhury N, Skene DJ, Costa R, Porkka-Heiskanen T, and Montagnese S (2017). Abnormalities in the Polysomnographic, Adenosine and Metabolic Response to Sleep Deprivation in an Animal Model of Hyperammonemia. Front Physiol 8, 636. 10.3389/fphys.2017.00636. [DOI] [PMC free article] [PubMed] [Google Scholar]
- 40.Wang L, Kiuchi T, Fujii T, Daimon T, Li M, Banno Y, Kikuta S, Kikawada T, Katsuma S, and Shimada T (2013). Mutation of a novel ABC transporter gene is responsible for the failure to incorporate uric acid in the epidermis of ok mutants of the silkworm, Bombyx mori. Insect Biochem Mol Biol 43, 562–571. 10.1016/j.ibmb.2013.03.011. [DOI] [PubMed] [Google Scholar]
- 41.Sautin YY, and Johnson RJ (2008). Uric acid: the oxidant-antioxidant paradox. Nucleosides Nucleotides Nucleic Acids 27, 608–619. 10.1080/15257770802138558. [DOI] [PMC free article] [PubMed] [Google Scholar]
- 42.Bedont JL, Toda H, Shi M, Park CH, Quake C, Stein C, Kolesnik A, and Sehgal A (2021). Short and long sleeping mutants reveal links between sleep and macroautophagy. eLife 10, e64140. 10.7554/eLife.64140. [DOI] [PMC free article] [PubMed] [Google Scholar]
- 43.Chen J, Ricardo AC, Reid KJ, Lash J, Chung J, Patel SR, Daviglus ML, Huang T, Liu L, Hernandez R, et al. (2022). Sleep, cardiovascular risk factors, and kidney function: The Multi-Ethnic Study of Atherosclerosis (MESA). Sleep Health, S2352–7218(22)00144–9. 10.1016/j.sleh.2022.08.004. [DOI] [PMC free article] [PubMed] [Google Scholar]
- 44.Yin S, Wang J, Bai Y, Yang Z, Cui J, and Wang J (2022). Association between sleep duration and kidney stones in 34 190 American adults: A cross-sectional analysis of NHANES 2007–2018. Sleep Health, S2352721822001425. 10.1016/j.sleh.2022.08.003. [DOI] [PubMed] [Google Scholar]
- 45.Igarashi K, Ueda S, Yoshida K, and Kashiwagi K (2006). Polyamines in renal failure. Amino Acids 31, 477–483. 10.1007/s00726-006-0264-7. [DOI] [PubMed] [Google Scholar]
- 46.Winer JR, and Mander BA (2018). Waking Up to the Importance of Sleep in the Pathogenesis of Alzheimer Disease. JAMA Neurol 75, 654. 10.1001/jamaneurol.2018.0005. [DOI] [PubMed] [Google Scholar]
- 47.Bergin DH, Jing Y, Mockett BG, Zhang H, Abraham WC, and Liu P (2018). Altered plasma arginine metabolome precedes behavioural and brain arginine metabolomic profile changes in the APPswe/PS1ΔE9 mouse model of Alzheimer’s disease. Transl Psychiatry 8, 108. 10.1038/s41398-018-0149-z. [DOI] [PMC free article] [PubMed] [Google Scholar]
- 48.Ju YH, Bhalla M, Hyeon SJ, Oh JE, Yoo S, Chae U, Kwon J, Koh W, Lim J, Park YM, et al. (2022). Astrocytic urea cycle detoxifies Aβ-derived ammonia while impairing memory in Alzheimer’s disease. Cell Metab 34, 1104–1120.e8. 10.1016/j.cmet.2022.05.011. [DOI] [PubMed] [Google Scholar]
- 49.Bensemain F, Hot D, Ferreira S, Dumont J, Bombois S, Maurage C-A, Huot L, Hermant X, Levillain E, Hubans C, et al. (2009). Evidence for induction of the ornithine transcarbamylase expression in Alzheimer’s disease. Mol. Psychiatry 14, 106–116. 10.1038/sj.mp.4002089. [DOI] [PubMed] [Google Scholar]
- 50.Spiegel K, Tasali E, Penev P, and Cauter EV (2004). Brief Communication: Sleep Curtailment in Healthy Young Men Is Associated with Decreased Leptin Levels, Elevated Ghrelin Levels, and Increased Hunger and Appetite. Ann Intern Med 141, 846. 10.7326/0003-4819-141-11-200412070-00008. [DOI] [PubMed] [Google Scholar]
- 51.Bhutani S, Howard JD, Reynolds R, Zee PC, Gottfried J, and Kahnt T (2019). Olfactory connectivity mediates sleep-dependent food choices in humans. eLife 8, e49053. 10.7554/eLife.49053. [DOI] [PMC free article] [PubMed] [Google Scholar]
- 52.Hsu CT, Choi JTY, and Sehgal A (2020). Manipulations of the olfactory circuit highlight the role of sensory stimulation in regulating sleep amount. Sleep, zsaa265. 10.1093/sleep/zsaa265. [DOI] [PMC free article] [PubMed] [Google Scholar]
- 53.Nieman DC, Gillitt ND, Sha W, Esposito D, and Ramamoorthy S (2018). Metabolic recovery from heavy exertion following banana compared to sugar beverage or water only ingestion: A randomized, crossover trial. PLoS ONE 13, e0194843. 10.1371/journal.pone.0194843. [DOI] [PMC free article] [PubMed] [Google Scholar]
- 54.Kuang A, Erlund I, Herder C, Westerhuis JA, Tuomilehto J, and Cornelis MC (2018). Lipidomic Response to Coffee Consumption. Nutrients 10, E1851. 10.3390/nu10121851. [DOI] [PMC free article] [PubMed] [Google Scholar]
- 55.Ubhi BK (2018). Direct Infusion-Tandem Mass Spectrometry (DI-MS/MS) Analysis of Complex Lipids in Human Plasma and Serum Using the Lipidyzer™ Platform. In Clinical Metabolomics Methods in Molecular Biology, Giera M, ed. (Springer; New York: ), pp. 227–236. 10.1007/978-1-4939-7592-1_15. [DOI] [PubMed] [Google Scholar]
- 56.Lintonen TPI, Baker PRS, Suoniemi M, Ubhi BK, Koistinen KM, Duchoslav E, Campbell JL, and Ekroos K (2014). Differential Mobility Spectrometry-Driven Shotgun Lipidomics. Anal. Chem. 86, 9662–9669. 10.1021/ac5021744. [DOI] [PubMed] [Google Scholar]
- 57.Baker PRS, Armando AM, Campbell JL, Quehenberger O, and Dennis EA (2014). Three-dimensional enhanced lipidomics analysis combining UPLC, differential ion mobility spectrometry, and mass spectrometric separation strategies. Journal of Lipid Research 55, 2432–2442. 10.1194/jlr.D051581. [DOI] [PMC free article] [PubMed] [Google Scholar]
- 58.Rhoades SD, and Weljie AM (2016). Comprehensive Optimization of LC-MS Metabolomics Methods Using Design of Experiments (COLMeD). Metabolomics 12, 183. 10.1007/s11306-016-1132-4. [DOI] [PMC free article] [PubMed] [Google Scholar]
- 59.Malik DM, Rhoades S, and Weljie A (2018). Extraction and Analysis of Pan-metabolome Polar Metabolites by Ultra Performance Liquid Chromatography-Tandem Mass Spectrometry (UPLC-MS/MS). Bio Protoc 8, e2715. 10.21769/BioProtoc.2715. [DOI] [PMC free article] [PubMed] [Google Scholar]
- 60.Ki Y, and Lim C (2019). Sleep-promoting effects of threonine link amino acid metabolism in Drosophila neuron to GABAergic control of sleep drive. eLife 8, e40593. 10.7554/eLife.40593. [DOI] [PMC free article] [PubMed] [Google Scholar]
- 61.Shaffer JP (1995). Multiple Hypothesis Testing. Annu. Rev. Psychol. 46, 561–584. 10.1146/annurev.ps.46.020195.003021. [DOI] [Google Scholar]
- 62.Logan BR, Wang H, and Zhang M-J (2005). Pairwise multiple comparison adjustment in survival analysis. Stat Med 24, 2509–2523. 10.1002/sim.2125. [DOI] [PubMed] [Google Scholar]
- 63.Ryder E, Blows F, Ashburner M, Bautista-Llacer R, Coulson D, Drummond J, Webster J, Gubb D, Gunton N, Johnson G, et al. (2004). The DrosDel Collection: A Set of P -Element Insertions for Generating Custom Chromosomal Aberrations in Drosophila melanogaster. Genetics 167, 797–813. 10.1534/genetics.104.026658. [DOI] [PMC free article] [PubMed] [Google Scholar]
- 64.Jenett A, Rubin GM, Ngo T-TB, Shepherd D, Murphy C, Dionne H, Pfeiffer BD, Cavallaro A, Hall D, Jeter J, et al. (2012). A GAL4-Driver Line Resource for Drosophila Neurobiology. Cell Reports 2, 991–1001. 10.1016/j.celrep.2012.09.011. [DOI] [PMC free article] [PubMed] [Google Scholar]
- 65.Hamada FN, Rosenzweig M, Kang K, Pulver SR, Ghezzi A, Jegla TJ, and Garrity PA (2008). An internal thermal sensor controlling temperature preference in Drosophila. Nature 454, 217–220. 10.1038/nature07001. [DOI] [PMC free article] [PubMed] [Google Scholar]
- 66.Rogulja D, and Irvine KD (2005). Regulation of cell proliferation by a morphogen gradient. Cell 123, 449–461. 10.1016/j.cell.2005.08.030. [DOI] [PubMed] [Google Scholar]
- 67.Bai L, Lee Y, Hsu CT, Williams JA, Cavanaugh D, Zheng X, Stein C, Haynes P, Wang H, Gutmann DH, et al. (2018). A Conserved Circadian Function for the Neurofibromatosis 1 Gene. Cell Rep 22, 3416–3426. 10.1016/j.celrep.2018.03.014 [DOI] [PMC free article] [PubMed] [Google Scholar]
Associated Data
This section collects any data citations, data availability statements, or supplementary materials included in this article.
Supplementary Materials
Data S1. Unbiased metabolomics screen of sleep mutant Drosophila melanogaster. Related to Figures 1 and S1.
A: sleep mutant / iso31 control expression level of metabolites in assorted ureotelic and uricotelic nitrogen pathways, organized roughly in order within their respective pathways.
B: sleep mutant / iso31 control expression levels of metabolites contributing to the Venn diagram in Figure 1A.
C: sleep mutant / iso31 control expression level of all metabolites from both the HD4 global metabolomics screen (top) and CLP lipidomics screen (bottom). Individual metabolites are loosely grouped by their predominant superpathway and subpathway groupings. p-values and q-values for each sleep mutant vs iso31 control comparison can be found on the right.
D: scaled, imputed metabolite levels for each individual iso31, fmn, rye, and sss sample for both the HD4 (top) and CLP (bottom) screens.
E: original scale metabolite levels for each individual iso31, fmn, rye, and sss sample for both the HD4 (top) and CLP (bottom) screens.
Data S2. Auxiliary sleep data from polyamine feeding and nitrogen metabolism RNAi and Crispr-KO sleep experiments. Related to Figures 3 and S3.
A: key listing stock center information and our own identifiers for each RNAi used for our sleep screens, and sgRNAs used in follow-up experiments
B: first-pass female total sleep mean, SEM, and n for each experimental and control group in our actinGS sleep screen. Difference of mean total sleep in each cross vs both control groups is also shown. Crosses that were considered first-pass hits (cross mean total sleep >=60min either higher or lower than both controls) are highlighted in gray. Crosses that survived validation and were identified as genuine hits are highlighted in red (sleep lower than controls) or blue (sleep higher than controls).
C: as Tab#4, but nsybGS screen.
D: raw data, summary statistics, and where applicable provisional hypothesis-testing statistics for sleep screen hits that failed at any point in the validation pipeline. The reason for invalidating each hit is clearly stated.
E: single-beam validation experiments for sleep-loss screen hit actinGS>dcr,asl-RNAi#1, auxiliary sleep and activity metrics. Same flies as Figure 3B,E.
F: single-beam and multi-beam validation experiments for sleep-gain screen hit actinGS>dcr,spds-RNAi#1, auxiliary sleep and activity metrics. Same flies as Figure 3C,F,H.
G: single-beam and multi-beam validation experiments for sleep-gain screen hit actinGS>dcr,sms-RNAi#4, auxiliary sleep and activity metrics. Same flies as Figure 3D,G,I.
H: multi-beam re-testing of sleep gain with actinGS>dcr,spds-RNAi#5 prompted by qPCR studies, auxiliary sleep and activity metrics. Same flies as Figure 3J.
I: multi-beam re-testing of sleep gain with actinGS>dcr,sms-RNAi#5 prompted by qPCR studies, auxiliary sleep and activity metrics. Same flies as Figure S3I.
J: multi-beam auxiliary sleep and activity metrics in actinGS>cas9,spds-sgRNA flies. Same flies as Figure 3K.
K: multi-beam auxiliary sleep and activity metrics in actinGS>cas9,asl-sgRNA flies. Same flies as Figure S3J.
L: multi-beam auxiliary sleep and activity metrics in actinGal4>cas9,spds-sgRNA flies. Same flies as Figure S3M.
M: multi-beam auxiliary sleep and activity metrics in actinGal4>cas9,asl-sgRNA flies. Same flies as Figure S3N.
N: multi-beam auxiliary sleep and activity metrics from female flies on vehicle control or 16mM ornithine, putrescine, or spermidine. Same flies as Figures 3L,N and S3O,P.
O: multi-beam auxiliary sleep and activity metrics from male flies on vehicle control or 16mM ornithine, putrescine, or spermidine. Same flies as Figures 3M,O and S3Q,R.
P: multi-beam auxiliary sleep and activity metrics from female flies on vehicle control or 50mM ornithine. Same flies as Figures 3P and S3S,T.
Q: multi-beam auxiliary sleep and activity metrics from male flies on vehicle control or 50mM ornithine. Same flies as Figures 3Q and S3U,V.
Data S3. Sleep data and % awake time near food from sleep mutants and thermogenetically sleep-restricted flies on special diets. Related to Figures 4 and S4.
All tabs show sleep metrics from the same flies subjected to awake-time-near-food analysis on multibeam sleep monitors in Figure S4.
A: male fmn, rye, and sss sleep mutants and iso31 control flies at 25C.
B: male 60D04-Gal4/+ control, UAS-TrpA1 control, and 60D04>TrpA1 sleep-restricted flies at 29C.
C: male 11H05-Gal4/+ control, UAS-TrpA1 control, and 11H05>TrpA1 sleep-restricted flies at 29C.
Data Availability Statement
Our HD4 global metabolomics dataset is deposited on Metabolights at https://www.ebi.ac.uk/metabolights/MTBLS3318.
Previously unreported scripts for time-at-position (multibeamPositionAnalysis_minutesPerDay.m) and awake time-at-position analysis (posWhileAwakeToExcel.m) were deposited to the repository on GitHub (https://github.com/cthsu86/damSleepConverter). Other code used has been previously reported 52.
Other data and additional information required to reanalyze data reported in this paper is available from the lead contact upon request.