Abstract
Type 2 diabetes mellitus (T2DM) is characterized by insulin resistance and a relative deficiency of insulin. This study aims to screen T2DM-related maker genes in the mouse extraorbital lacrimal gland (ELG) by LASSO regression.C57BLKS/J strain with leptin db/db homozygous mice (T2DM, n = 20) and wild-type mice (WT, n = 20) were used to collect data. The ELGs were collected for RNA sequencing. LASSO regression was conducted to screen marker genes with the training set. Five genes were selected from 689 differentially expressed genes by LASSO regression, including Synm, Elovl6, Glcci1, Tnks and Ptprt. Expression of Synm was downregulated in ELGs of T2DM mice. Elovl6, Glcci1, Tnks, and Ptprt were upregulated in T2DM mice. Area under receiver operating curve of the LASSO model was 1.000(1.000–1.000) and 0.980(0.929–1.000) in the training set and the test set, respectively. The C-index and the robust C-index of the LASSO model were 1.000 and 0.999, respectively, in the training set, and 1.000 and 0.978, respectively, in the test set. In the lacrimal gland of db/db mice, Synm, Elovl6, Glcci1, Tnks and Ptprt can be used as marker genes of T2DM. Abnormal expression of marker genes is related to lacrimal gland atrophy and dry eye in mice.
Subject terms: Eye diseases, Diabetes, Computational biology and bioinformatics, Biomarkers
Introduction
Globally, there are 537 million people with diabetes mellitus (DM), according to the International Diabetes Federation 2021. The per capita health expenditure related to DM is $1838.4. The proportion of DM-related deaths among people under the age of 60 accounts for 32.6%1. Type 2 diabetes mellitus (T2DM) is characterized by insulin resistance and a relative lack of insulin secretion from pancreatic beta cells2,3. T2DM is the most common type of DM, accounting for more than 90% of all DM in the world4. Patients with poorly controlled blood glucose in T2DM can cause many complications, the severe ones being cardiovascular disease and stroke5. T2DM can also cause many ocular complications, the commonest being diabetic retinopathy, corneal neuropathy, glaucoma and cataracts6. The incidence of these conditions in T2DM patients is significantly higher than in the general population.
The extraorbital lacrimal gland (ELG) is located in the superior lacrimal fossa outside the orbit. As an exocrine gland, the ELG plays a crucial role in maintaining ocular surface homeostasis, immune protection, and corneal transparency by providing water, electrolytes, growth factors, antimicrobial peptides, and neuropeptides7. It is well established that DM is often accompanied by lacrimal gland dysfunction, and nearly 50% of DM patients suffer from chronic dry eye8,9. However, the exact timing of the onset of T2DM is also usually uncertain. As many as one-third to one-half of patients with T2DM in the population may not be identified by medical diagnosis1. Therefore, searching for marker genes that are associated with T2DM and lacrimal gland dysfunction will potentially provide new insights into the prediction and treatment of T2DM and ocular complications in a high-risk population.
The Least Absolute Shrinkage and Selection Operator (LASSO) regression is based on regression methods to obtain more accurate predictive algorithms. The LASSO procedure is relatively suitable for models showing high levels of multicollinearity or when certain parts of the model are automatically selected, such as variable selection/parameter elimination10. In addition, LASSO regression models are suitable for studies where the number of predictors is greater than the sample of test subjects. This is typically used for those analyses that are based on genetic data but not on clinically used variables10.
Db/db mice are leptin receptor gene-deficient mice with characteristics such as obesity, insulin resistance and hyperglycemia and are widely used as models of T2DM11. To find marker genes associated with lacrimal gland dysfunction accompanying T2DM, the db/db mice were used in the present study as a T2DM model. First, the differentially expressed genes (DEGs) in the mouse lacrimal gland associated with T2DM were obtained by RNA sequencing and bioinformatics analysis techniques, and then the marker genes highly associated with T2DM were further screened using LASSO regression. Multiple validation was performed to assess the efficiency of marker genes in identifying T2DM. These results will provide a theoretical basis for the prediction and treatment of T2DM and lacrimal gland dysfunction caused by T2DM in the future.
Materials and methods
Animals
Twenty C57BLKS/J background db/db (DB) mice aged 12 weeks were used as a T2DM model, and C57BLKS/J male mice from the same litter were used as wild-type (WT) control mice. All animals were provided by the Model Animal Research Center of Nanjing University (Nanjing, China). All animals were housed in 12 h/12 h light/dark circadian chambers with free access to water and food. All animal experimental procedures were approved by the Institutional Animal Care and Use Committee of the Henan Provincial People's Hospital, Zhengzhou University (Experiment Ethical No: HNEECA-2022-20). All methods were carried out in accordance with relevant guidelines and regulations (the Association for Research in Vision and Ophthalmology’s statement) and in compliance with the Animal Research: Reporting of In Vivo Experiments (ARRIVE) guidelines.
Data collection
The body weight and blood glucose of the two groups of mice were measured after two weeks of adaptation in the circadian rhythm chamber. Tear secretion level was measured as previously described12. Briefly, mice were given pilocarpine hydrochloride (a cholinergic agonist for the parasympathetic nerve, 4.5 mg/kg) in saline by intraperitoneal injection. After 10-min recovery, tear volumes were measured using the phenol red thread test (#30059010; Tianjin Jingming New Technology Development Co., Tianjin, China) by carefully placing the thread at the inner canthus of the eye and holding it in place for 20 s. The length (millimeters) of the red portion was measured to evaluate the amount of tear secretion. Animals were anesthetized with 2% isoflurane before euthanasia through cervical dislocation. The ELGs of mice were collected and quickly put into liquid nitrogen for subsequent RNA extraction and RNA sequencing. Total RNA was extracted from ELGs and purified using RNeasy spin column kit (Qiagen, Hilden, Germany). And mRNA was then enriched using Oligo (dT) magnetic beads. The cDNA fragments were amplified by PCR after the first and second cDNA strands being synthesized. The BGISEQ-500 sequencing platform (BGI, Wuhan, China) was used to sequence data libraries. SOAPnuke software (v1.5.2 https://github.com/BGI-flexlab/SOAPnuke) was used to obtain clean reads. Mapping with the reference gene set was conducted using the Bowtie2 software (v2.2.5 http://bowtiebio.sourceforge.net/%20Bowtie2%20/index.shtml) and mapping with the reference genome using the HISAT software (v2.0.4 http://www.ccb.jhu.edu/software/hisat/index.shtml). The raw count data were normalized using the fragments per kilobase per million mapped fragments (FPKM) value.
Identification of differentially expressed genes between WT and DB mice
Differentially expressed genes (DEGs) were identified by using the DESeq package of R software (version 4.2.0). DEGs were defined as absolute log2 fold change (FC) > 1 and an adjusted P value of < 0.05.
Functional annotation with enrichment analysis
DEGs were subjected to gene ontology (GO) and Kyoto Encyclopedia of Genes and Genomes (KEGG) pathway analysis by using the Database for Annotation, Visualization and Integrated Discovery (DAVID) bioinformatics tool (version 6.8), which to identify the functional roles of the upregulated and downregulated DEGs, respectively. GO enrichment was described from three aspects: biological process (BP), molecular function (MF), and cellular component (CC). Annotated reference gene sets of c5.all.v7.1.symbols.gmt were downloaded from the Molecular Signatures Database.
Statistical analysis
All statistical analyses were conducted with R software (version 4.2.0) and GraphPad Prism software version 8.0 (GraphPad Software, La Jolla, CA). All mice of each group were randomly separated into a training set (n = 14) and testing set (n = 6). To further narrow the scope of the candidate marker genes related to T2DM, we adopted the LASSO binary logistic regression model using the training set, which was applied to minimize overfitting and identify the most significant T2DM-associated DEGs in ELGs. The risk-score signature for prediction of T2DM was obtained by multiplying the expression level of each selected marker genes by its corresponding relative regression coefficient weight, as follows:
where N represents the total number of selected marker genes, βi represents the coefficient index of each gene calculated by LASSO regression, and Ei represents the gene expression value of each gene. The risk score was calculated for each mouse in the training set. Those with a higher risk score than the median score were classified into the high-score group, while those with a lower risk score were classified into the low-score group. Receiver operating characteristic (ROC) curves of the regression model were plotted to evaluate the sensitivity and specificity of the marker genes we screened. The survival package of R software was used to construct a nomogram for the screened marker genes, and the nomogram was assessed by discrimination and calibration. The concordance index (C-index) was calculated to evaluate the efficiency of the nomogram by using the bootstrap method with 1000 resamples. The calibration curve of the nomogram was plotted to observe the relationship between the nomogram prediction probability and the observation rate. The test set was used to verify the discrimination ability of the selected marker genes. All statistical tests were two-sided, and P values less than 0.05 were considered statistically significant.
Results
General descriptions of the control and T2DM mice
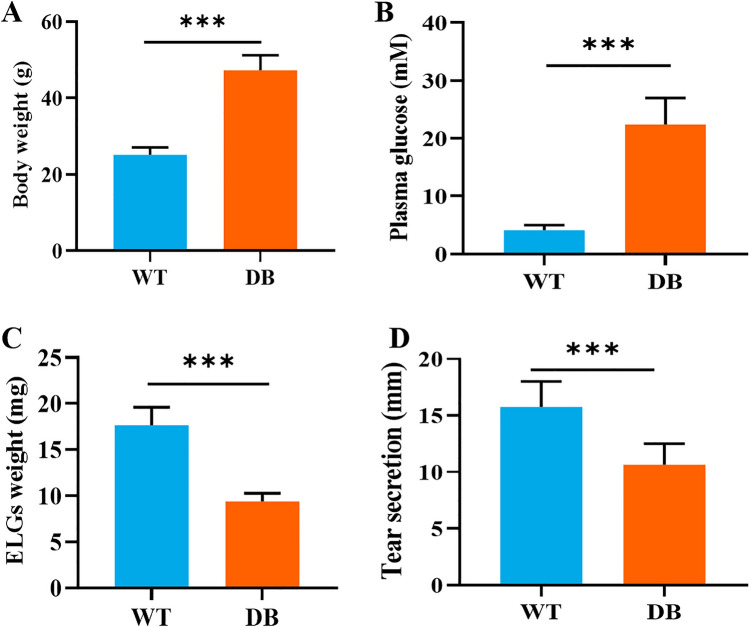
The body weight of the WT and DB mice was 25.10 ± 1.94 g and 47.27 ± 3.88 g, respectively. The difference was statistically significant between two groups (t = 22.85, P < 0.001) (Fig. 1A). There was a statistical difference in the fasting blood glucose level between WT group (4.12 ± 0.85 mmol/L) and DB group (22.40 ± 4.57 mmol/L) (t = 17.570, P < 0.001) (Fig. 1B). The ELG weight of the WT mice (17.65 ± 1.94 mg) was significantly heavier than that of the DB mice (9.37 ± 0.91 mg) (t = 17.280, P < 0.001) (Fig. 1C). There were significant statistical differences in level of tear secretion between WT (15.77 ± 2.22 mm) and DB group (10.64 ± 1.87 mm) (t = 8.299, P < 0.001) (Fig. 1D).
Figure 1.
Comparison of general characteristics between WT and DB mice.
Screening of DEGs associated with T2DM
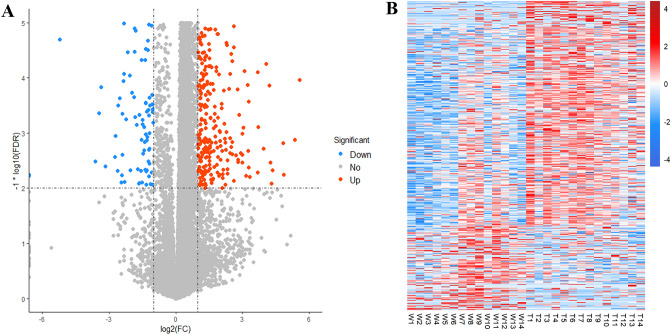
Altogether, 16,677 transcripts were sequenced for WT and DB mice, respectively. Sixteen samples of each group were used as the training set to screen DEGs. Under the conditions of FDR < 0.01 and |log2 (FC)|> 1, 689 DEGs were screened. The volcano plot of DEGs between two groups is shown in Fig. 2A, in which, 166 genes were downregulated and 523 genes were upregulated in DB group. Heatmaps display the standardized expression of 689 DEGs (Fig. 2B).
Figure 2.
The differentially expressed genes between WT and DB mice. (A) The volcano plot of DEGs between two groups. (B) The heatmap displays expression levels of 689 DEGs based on the RNA-seq data.
Biological functions of DEGs associated with T2DM
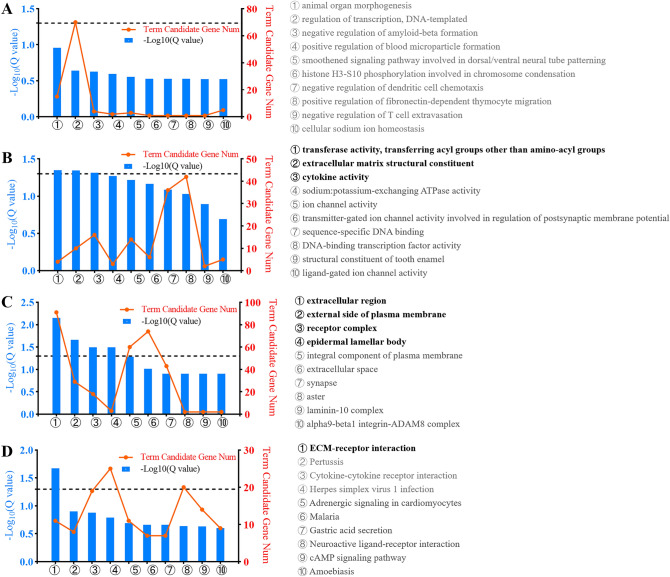
To establish links between DEGs and biological processes, GO annotation and KEGG pathway annotation were performed using the gene2go.gz and KEGG database V81.0 with NCBI RefSeq GCF_000001635.25_GRCm38.p5 as a reference gene set, respectively. The biological processes, molecular functions and cellular components of the DEGs are presented in Fig. 3A–C. No biological process was annotated in these DEGs. Three molecular functions were annotated, including transferase activity, transferring acyl groups other than amino-acyl groups, extracellular matrix structural constituent, and cytokine activity. Four cellular components were annotated, including extracellular region, external side of plasma membrane, receptor complex, and epidermal lamellar body. One KEGG pathway was annotated in these DEGs (Fig. 3D).
Figure 3.
Gene annotation of GO and KEGG pathways enriched in DEGs. (A–C) The biological processes (A), molecular functions (B) and cellular components (C) of the DEGs; (D) Annotation of 689 DEGs from the KEGG pathway database. The text in bold represents the pathway that Q < 0.05.
Identification of marker genes related to T2DM using LASSO regression
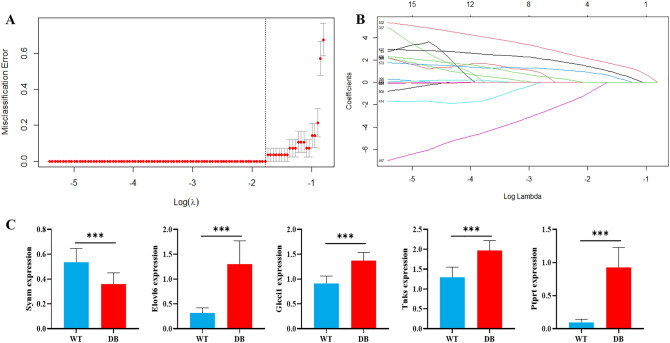
Fourteen samples from 20 samples in each group were randomly selected as the training set, and the LASSO regression model was used to screen the marker genes related to T2DM. The 689 DEGs were included in the model for variable screening, the minimum standard was adopted to obtain the value of the parameter λ by tenfold cross-validation. The binomial deviance was computed for the training data as a measure of the predictive performance of the fitted models. Screening of marker genes related to T2DM based on LASSO regression are shown in Fig. 4. The results showed the λ values ranged from 0.00047 to 0.44720. Cross validation plot for the penalty term is shown in Fig. 4A. Plots for LASSO regression coefficients over different values of the penalty parameter are shown in Fig. 4B. The λ value with a minimal root mean square error (RMSE) was confirmed as 0.1683709 where the optimal lambda resulted in 5 non-zero coefficients. The marker genes identified by LASSO regression included Synm, Elovl6, Glcci1, Tnks and Ptprt. The expression of the 5 marker genes in WT and DB group is shown in Fig. 4C. The 5 marker genes were divided into low expression (Lowexp) and high expression (Highexp) groups according to the median of the expression. Logistic regression was conducted to estimate the impact of each marker gene on ELGs of T2DM mice. Table 1 displays the results of the logistic regression analysis of 5 marker genes. Lower expression of Synm and higher expression of Elovl6, Glcci1, Tnks, and Ptprt may increase the risk of T2DM.
Figure 4.
Screening of marker genes related to T2DM based on LASSO regression. (A) Cross validation plot for the penalty term. When logλ = − 0.775, a minimal root mean square error (RMSE) and 5 non-zero coefficients were obtained. (B) LASSO regression coefficients over different values of the penalty parameter. (C) Expression of the 5 marker genes in WT and DB groups. ***P < 0.001.
Table 1.
Results of the logistic regression analysis of 5 marker genes.
| WT | DB | χ2 | P | OR (95% CI) | |||
|---|---|---|---|---|---|---|---|
| Synm | |||||||
| Lowexp | 2 | 14.3% | 11 | 78.6% | 11.631 | 0.001 | 0.045(0.006–0.325) |
| Highexp | 12 | 85.7% | 3 | 21.4% | |||
| Elovl6 | |||||||
| Lowexp | 13 | 92.9% | 1 | 7.1% | 20.571 | < 0.001 | 169.000(9.521–2999.916) |
| Highexp | 1 | 7.1% | 13 | 92.9% | |||
| Glcci1 | |||||||
| Lowexp | 12 | 85.7% | 0 | 0.0% | 21.000 | < 0.001 | 0.143(0.040–0.515) |
| Highexp | 2 | 14.3% | 14 | 100.0% | |||
| Tnks | |||||||
| Lowexp | 12 | 85.7% | 0 | 0.0% | 21.000 | < 0.001 | 0.143(0.040–0.515) |
| Highexp | 2 | 14.3% | 14 | 100.0% | |||
| Ptprt | |||||||
| Lowexp | 14 | 100.0% | 0 | 0.0% | 28.000 | < 0.001 | – |
| Highexp | 0 | 0.0% | 14 | 100.0% | |||
Efficiency of marker genes screened by LASSO model
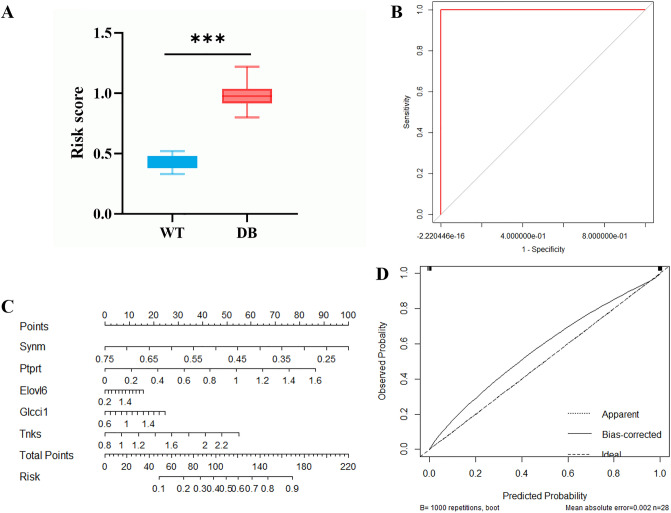
We used the minimal λ to build a T2DM-related gene score which we named the “TG-score”. The TG-score = − 0.1884 * Synmexp + 0.0022 * Elovl6exp + 0.1800 * Glcci1exp + 0.2555 * Tnksexp + 0.3499 * Ptprtexp. Next, we attempted to further determine the value of TG-score by predicting the T2DM patients. We divided patients into high and low TG-score groups with the best cut-off value of 0.60. We found that the high TG-score group had a higher risk of T2DM than the low TG-score group (Fig. 5A).
Figure 5.
Efficiency of marker genes screened by LASSO model using the training set. (A) The high TG-score group had a higher risk of T2DM than the low TG-score group. (B) The ROC curve of the marker genes-model. The AUC of the model was 1.000(1.000–1.000). (C) The nomogram of LASSO regression. (D) The calibration curve of the marker genes-model. The C-index and the robust C-index were 1.000 and 0.999, respectively. ***P < 0.001.
The regression model was constructed with 5 marker genes as independent variables to obtain the probability that each sample was identified as T2DM. Taking the probability of each sample as the test variable and grouping WT and DB mice as the state variable, ROC analysis was carried out and a ROC curve was obtained. The area under receiver operating curve (AUC) of the model was 1.000(1.000–1.000), which indicated that the efficiency of the model was good. The ROC curve of the marker genes-model is shown in Fig. 5B.
A nomogram was created using LASSO regression analysis, which to estimate the probability of T2DM (Fig. 5C). The calibration curve was used to describe the prediction value of the nomogram, and the 45° line indicates the actual diagnostic grouping. The C-index and the robust C-index were 1.000 and 0.999, respectively. The results for identifying T2DM mice showed that the nomogram-predicted T2DM closely matched the best prediction performance (Fig. 5D), indicating that these 5 marker genes screened by LASSO regression have a significant predictive value for identifying T2DM. Collectively, our results indicated a good performance of the 5-marker genes for T2DM.
Validation of the marker genes screened by LASSO model
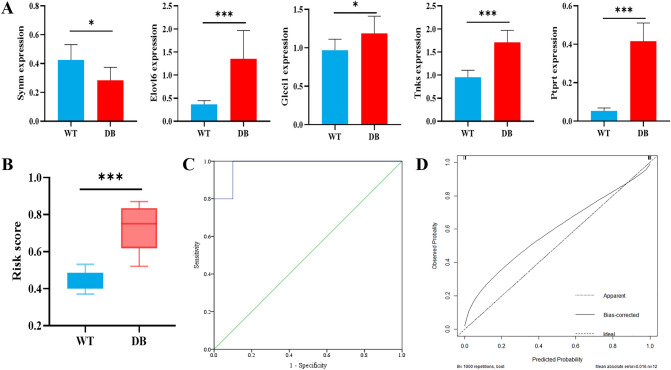
The marker genes were further validated by the test set (n = 6), which to evaluate the robustness of the LASSO model. The expression of the 5 marker genes in the test set is shown in Fig. 6A. Similar to the findings in the training set, the test set was consistently stratified into the high TG-score group with a higher risk of T2DM and the low TG-score group with a lower risk of T2DM (P < 0.001) (Fig. 6B). The probability of identifying T2DM in the test samples was obtained using the 5 marker genes. Similar to the performance in the training set, the AUC of the probability value was 0.980(0.920–1.000) in our validation dataset (Fig. 6C). The nomogram calibration curves for the possibility of T2DM displayed obvious concordance between the predicted results and observations in the test set (Fig. 6D). The C-index and the robust C-index were 1.000 and 0.978, respectively. The results show that the marker genes screened by LASSO model performed best in both the training and the validation sets.
Figure 6.
Validation of the marker genes screened by LASSO model using the test set. (A) Expression of the 5 marker genes in the test set. (B) Similar to the findings in the training set, the test set showed the high TG-score group had a higher risk of T2DM than the low TG-score group. (C) The ROC curve of the marker genes-model in the test set. The AUC of the model was 0.980(0.929–1.000). (D) The calibration curves for the possibility of T2DM in the test set. The C-index and the robust C-index were 1.000 and 0.978, respectively. ***P < 0.001.
Relationship between T2DM marker genes and lacrimal gland function
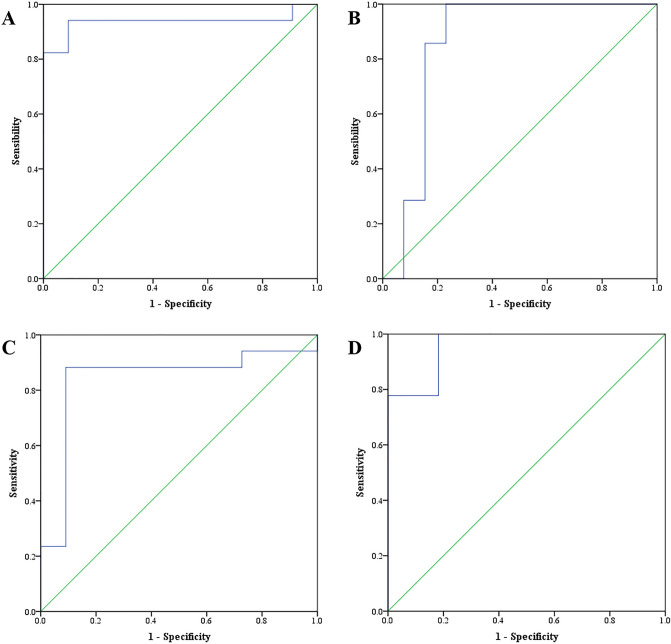
In order to explore the relationship between expression of marker genes and lacrimal gland function, the correlation coefficient between weight of lacrimal gland, as well as tear secretion and expression of 5 marker genes was calculated by Spearman correlation analysis (Table 2). The results indicated expression of Synm was positively correlated with the weight of lacrimal gland. While, the expression of Elovl6, Glcci1, Tnks and Ptprt was negatively correlated with the weight of lacrimal gland and tear secretion. The efficacy of the TG-score of the LASSO model in predicting ELG function (ELG weight and the level of tear secretion) was analyzed with adjusting the expression of leptin receptor gene (Lepr). The ROC curves of the LASSO model in predicting ELG weight and the level of tear secretion are shown in Fig. 7. Results show that the AUC of the LASSO model in predicting ELG weight was 0.936(0.831–1.000) in the training set, and 0.857(0.681–1.000) in the test set (Fig. 7A,B). The AUC of the LASSO model in predicting the level of tear secretion was 0.840(0.668–1.000) in the training set, and 0.960(0.882–1.000) in the test set (Fig. 7C,D). These findings suggest abnormal expression of marker genes is related to lacrimal gland atrophy and dry eye in mice.
Table 2.
Relationship between expression of marker genes and lacrimal gland function.
| Synm | Elovl6 | Glcci1 | Tnks | Ptprt | |
|---|---|---|---|---|---|
| Weight of lacrimal gland | |||||
| r | 0.386 | − 0.849 | − 0.761 | − 0.767 | − 0.882 |
| P | 0.007 | < 0.001 | < 0.001 | < 0.001 | < 0.001 |
| Tear secretion | |||||
| r | 0.221 | − 0.791 | − 0.562 | − 0.727 | − 0.862 |
| P | 0.131 | < 0.001 | < 0.001 | < 0.001 | < 0.001 |
Figure 7.
ROC curves of the LASSO model in predicting ELG function. (A) The ROC curve of the LASSO model in predicting ELG weight in the training set; (B) The ROC curve of the LASSO model in predicting ELG weight in the test set; (C) The ROC curve of the LASSO model in predicting the level of tear secretion in the training set; (D) The ROC curve of the LASSO model in predicting the level of tear secretion in the test set.
Discussion
Owing to the rising prevalence of T2DM, its high economic cost and serious complications, primary prevention and timely intervention are essential in preventing or delaying the onset of T2DM. Genome wide association studies have identified more than 400 genetic variations associated with T2DM, which together account for about 15–18% of the occurrence of T2DM. Marker genes are valuable for timely identification and the implementation of effective intervention in a high-risk population. In this study, we screened five marker genes that were highly related to T2DM in the lacrimal gland of db/db mice using LASSO regression, including Synm, Elovl6, Glcci1, Tnks and Ptprt. The results of multiple validation showed the model had good efficiency and stability for identifying T2DM, indicating that these five selected genes were highly correlated with T2DM and could be used as marker genes. In addition, we found that the expression of these genes was also significantly related to the lacrimal gland function, and the incidence of dry eyes in mice with abnormal expression was higher.
In recent years, the prediction and screening models of T2DM have become a research hotspot. Most of the models are based on age, gender, disease history, behavior habits and other indicators. In addition, DM is also closely related to hereditary factors. However, previous prediction models seldom consider the role of genetic factors in disease occurrence. In addition, there are few reports about the genes related to T2DM in lacrimal gland tissue. LASSO regression is characterized by variable screening and complexity adjustment while fitting the generalized linear model. It has unique advantages in dealing with high-dimensional data, even data whose dimension is much larger than the sample size. Adjusting the complexity of the model by control λ, can not only make the mean square error of the prediction model reach an ideal level, but can also avoid the overfitting of the model, which is especially suitable for the screening of marker genes in transcriptome data. In this study, five marker genes related to T2DM were selected by LASSO regression. The results shows that there is a certain statistical correlation between T2DM and marker genes, and provided a new idea for prediction and gene therapy of high-risk groups in the future.
The results showed that the expression of Synm in the lacrimal gland of T2DM mice was lower than that of control mice. The study of Juvinao-Quintero et al.13 indicated cg16765088 (near SYNM) of methylated CpG sites was associated with T2DM in European populations. Synm is located on chromosome 15, and the protein encoded by this gene is a member of the intermediate filament family. Synemin (SYNM) is an intermediate filament protein copolymerized with desmin and vimentin, which is expressed in gastrointestinal tract, bladder, brain, ovary and so on. SYNM deficiency will affect the copolymerization with vimentin14, and vimentin deficiency has been reported to affect vascular response15. Studies have shown that SYNM decreases after arterial injury16. The effect of decreased expression of Synm on vascular reactivity may be one of the causes of T2DM and its vascular complications.
The long chain fatty acid family member 6 (Elovl6) gene located on chromosome 4q25 encodes a microsomal enzyme that catalyzes the extension of saturated and monounsaturated fatty acids containing 12, 14 and 16 carbons17,18. Studies have shown that overexpression of Elovl6 can lead to dysfunction of the β cell19. Elovl6 deficiency increases insulin sensitivity and reduces insulin resistance20. The knockout of Elovl6 limits the extension of palmitate to stearate, thus desaturating palmitate to palmitoleic acid, which is a potential low-fat toxic fatty acid. This leads to palmitic acid-induced endoplasmic reticulum stress and attenuation of pancreas β apoptosis19. Therefore, the reduced expression of Elovl6 may be beneficial to protective role of β cell21. The results of this study showed that the expression of Elovl6 in the lacrimal gland of T2DM mice was higher than that of control mice. Matsuzaka's research demonstrates that manipulating fatty acid components by blocking Elovl6 can prevent insulin resistance, impaired insulin secretion and obesity-related diseases22. These facts suggest that Elovl6 may be involved in the development of T2DM, and limiting the expression or activity of Elovl6 may be a new method for the treatment of T2DM.
Glcci1 gene is expressed in many tissues and is considered to be an early marker of glucocorticoid induced apoptosis23. In cultured thymocyte lines, upregulation of glucocorticoid receptor dependent GLCCI1 is associated with glucocorticoid induced proapoptotic events24. The change of Glcci1 expression may affect the role of glucocorticoids in regulating glucose and fat metabolism through this mechanism. Kim et al. found that the expression of Glcci1 in the glomerulus of hyperglycemic rats decreased significantly, but increased in diabetic rats treated with wortmannin25. The present study showed that compared with the control group, the expression of Glcci1 in the lacrimal gland of T2DM group was upregulated. This may be due to the tissue-specific expression of Glcci1. The mechanism of Glcci1 gene affecting T2DM in different organs and tissues needs further study.
Tankyrases (TNKSs) are members of the poly ADP-ribose polymerase (PARP) family. They catalyze post-translational modification of proteins by transferring the ADP ribose portion of NAD+ to the target protein26. The activity of TNKSs affects the function and stability of target proteins, thereby regulating a variety of cellular processes, including cell differentiation and energy metabolism. In humans, Tnks is located on chromosome 8p23.1, which is the susceptibility site of T2DM. The mutation of Tnks is related to early-onset obesity. This study showed that the expression of Tnks in the lacrimal gland of T2DM mice was higher than that of control mice. Other studies have shown that the specific destruction of Tnks1 activity in adipocytes can enhance glucose tolerance and insulin sensitivity in female mice. Inhibition of TNKS1 (a subtype of TNKSs) with TNKS specific inhibitors can reduce fasting blood glucose and improve insulin sensitivity27. Wang et al. found that TNKS inhibition reduced the body weight, abdominal fat content and serum cholesterol level of db/db mice, by driving the transcription reprogramming of PGC-1α in muscle and white adipose tissue26. These results suggest that specific TNKS activity inhibitor may become a potential drug for the treatment of obesity and T2DM.
The protein encoded by Ptprt gene is a member of protein tyrosine phosphatase (PTP) family. PTPs are signaling molecules that regulate a variety of cellular processes, including cell growth, differentiation and carcinogenic transformation. PTPRT can inhibit lung cancer, breast cancer and other malignant tumors by regulating JAK-STAT pathway and inhibiting transcription activator-3 (STAT3)28,29. Ptprt knockout mice have upregulated STAT3 phosphorylation in the hypothalamus, are resistant to obesity induced by a high-fat diet, and show improved peripheral insulin sensitivity and reduced blood glucose30. The results of this study showed that the expression of Ptprt was upregulated in the lacrimal gland of T2DM mice. These results suggest that Ptprt may have an effect on obesity and diabetes by regulating STAT3 signal.
In this study, five marker genes highly related to T2DM were screened by LASSO regression, which provided a scientific basis for the prediction and gene therapy of T2DM. However, this research has some limitations. First, in order to exclude the impact of sex hormones, only male mice were used in this study. Whether these five marker genes can also effectively identify T2DM in the lacrimal gland of female mice remains to be further studied. Second, because gene expression is tissue-specific, this study only collected lacrimal gland samples for RNA sequencing. The five marker genes may not be applicable to other tissues and organs. In addition, sampling of lacrimal gland and gene quantification are not easy to be applied in practice. In the future, we will continue to explore the marker genes in tissues that are easy to acquire, such as blood or hair. Third, this was a cross-sectional study, rather than a prospective study, the results of which only indicated a statistical association between five marker genes and T2DM. Thus, it is not possible to infer whether there is a causal relationship between these marker genes and T2DM. In addition to T2DM and marker genes, the differences in lacrimal gland function between the two groups in this study may also be related to a deficient leptin signal in db/db mice and various other factors. Finally, although the internal validation showed the results were robust, external validation was not carried out. In the future, multi-center external validation studies will be conducted to further study the mechanism of marker genes affecting the occurrence and development of T2DM.
Conclusion
In the lacrimal gland of db/db mice, Synm, Elovl6, Glcci1, Tnks and Ptprt can be used as marker genes of T2DM. Mice with abnormal expression have a higher prevalence of T2DM and dry eye. These findings provide an insight for the study of dry eyes caused by T2DM, and will be explored in other organ tissues such as blood and hair in the future. The discovery of the marker genes provides a new direction for the gene therapy of T2DM and complication caused by T2DM in clinical practice, by transferring exogenous normal genes into the target cells to correct or compensate for abnormal marker genes.
Acknowledgements
The authors kindly appreciate all technical staff of Henan Provincial People’s Hospital for providing the materials and their collaboration during the sampling.
Abbreviations
- AUC
Area under receiver operating curve
- BP
Biological process
- CC
Cellular component
- C-index
Concordance index
- DAVID
Database for annotation, visualization and integrated discovery
- DM
Diabetes mellitus
- DEGs
Differentially expressed genes
- ELG
Extraorbital lacrimal gland
- FC
Fold change
- FPKM
Fragments per kilobase per million mapped fragments
- GO
Gene ontology
- Highexp
High expression
- KEGG
Kyoto encyclopedia of genes and genomes
- LASSO
Least absolute shrinkage and selection operator
- Lowexp
Low expression
- MF
Molecular function
- PARP
Poly ADP-ribose polymerase
- PTP
Protein tyrosine phosphatase
- ROC
Receiver operating characteristic
- RMSE
Root mean square error
- TNKSs
Tankyrases
- T2DM
Type 2 diabetes mellitus
- WT
Wild-type mice
Author contributions
Z.L. and X.P. conceived of the study, participated in its design and coordination and helped to draft the manuscript; X.P. and D.Q. participated in the data collection, analysis and drafted the manuscript; J.L. and H.S. carried out sample collection and DNA extraction; S.H., S.Z. and D.L. carried out the immunoassays. All authors read and approved the final manuscript. All authors have given consent for publication.
Funding
This work was supported by the Henan Provincial Medical Science and Technology Research Joint Co-construction Project [Grant No. LHGJ20220085]; the Basic Science Project of Henan Eye Institute/Henan Eye Hospital [Grant Nos. 22JCQN004 and 21JCZD001]; and the National Natural Science Foundation of China [Grant Nos. 81470603 and 82101089].
Data availability
All relevant data are included in the papers. Please contact the corresponding author for additional information regarding data access.
Competing interests
The authors declare no competing interests.
Footnotes
Publisher's note
Springer Nature remains neutral with regard to jurisdictional claims in published maps and institutional affiliations.
References
- 1.International diabetes federation diabetes atlas, 2021, 10th Edition. http://www.diabetesatlas.org/. Accessed 1 October 2022.
- 2.DeFronzo RA, et al. Type 2 diabetes mellitus. Nat. Rev. Dis. Primers. 2015;1:15019. doi: 10.1038/nrdp.2015.19. [DOI] [PubMed] [Google Scholar]
- 3.Galicia-Garcia U, et al. Pathophysiology of type 2 diabetes mellitus. Int. J. Mol. Sci. 2020 doi: 10.3390/ijms21176275. [DOI] [PMC free article] [PubMed] [Google Scholar]
- 4.Association AD. 2. Classification and diagnosis of diabetes: Standards of medical care in diabetes-2021. Diabetes Care. 2021;44:S15–S33. doi: 10.2337/dc21-S002. [DOI] [PubMed] [Google Scholar]
- 5.Vaidya V, Gangan N, Sheehan J. Impact of cardiovascular complications among patients with type 2 diabetes mellitus: A systematic review. Expert Rev. Pharmacoecon. Outcomes Res. 2015;15:487–497. doi: 10.1586/14737167.2015.1024661. [DOI] [PubMed] [Google Scholar]
- 6.Kautzky-Willer A, Harreiter J, Pacini G. Sex and gender differences in risk, pathophysiology and complications of type 2 diabetes mellitus. Endocr. Rev. 2016;37:278–316. doi: 10.1210/er.2015-1137. [DOI] [PMC free article] [PubMed] [Google Scholar]
- 7.Rocha EM, Alves M, Rios JD, Dartt DA. The aging lacrimal gland: Changes in structure and function. Ocul. Surf. 2008;6:162–174. doi: 10.1016/s1542-0124(12)70177-5. [DOI] [PMC free article] [PubMed] [Google Scholar]
- 8.Dias AC, et al. Insulin replacement restores the vesicular secretory apparatus in the diabetic rat lacrimal gland. Arq. Bras. Oftalmol. 2015;78:158–163. doi: 10.5935/0004-2749.20150041. [DOI] [PubMed] [Google Scholar]
- 9.Yoo TK, Oh E. Diabetes mellitus is associated with dry eye syndrome: A meta-analysis. Int. Ophthalmol. 2019;39:2611–2620. doi: 10.1007/s10792-019-01110-y. [DOI] [PubMed] [Google Scholar]
- 10.Hu JY, Wang Y, Tong XM, Yang T. When to consider logistic LASSO regression in multivariate analysis? Eur. J. Surg. Oncol. 2021;47:2206. doi: 10.1016/j.ejso.2021.04.011. [DOI] [PubMed] [Google Scholar]
- 11.Guilbaud A, et al. The LepR(db/db) mice model for studying glycation in the context of diabetes. Diabetes Metab. Res. Rev. 2019;35:e3103. doi: 10.1002/dmrr.3103. [DOI] [PubMed] [Google Scholar]
- 12.Jiao X, et al. Microbial reconstitution improves aging-driven lacrimal gland circadian dysfunction. Am. J. Pathol. 2021;191:2091–2116. doi: 10.1016/j.ajpath.2021.08.006. [DOI] [PubMed] [Google Scholar]
- 13.Juvinao-Quintero DL, et al. DNA methylation of blood cells is associated with prevalent type 2 diabetes in a meta-analysis of four European cohorts. Clin. Epigenet. 2021;13:40. doi: 10.1186/s13148-021-01027-3. [DOI] [PMC free article] [PubMed] [Google Scholar]
- 14.Skalli O. The cytoskeleton meets the skeleton. Focus on "Deficiency of the intermediate filament synemin reduces bone mass in vivo". Am. J. Physiol. Cell Physiol. 2016;311:C837–C838. doi: 10.1152/ajpcell.00303.2016. [DOI] [PMC free article] [PubMed] [Google Scholar]
- 15.Henrion D, et al. Impaired flow-induced dilation in mesenteric resistance arteries from mice lacking vimentin. J. Clin. Invest. 1997;100:2909–2914. doi: 10.1172/jci119840. [DOI] [PMC free article] [PubMed] [Google Scholar]
- 16.Perisic Matic L, et al. Phenotypic modulation of smooth muscle cells in atherosclerosis is associated with downregulation of LMOD1, SYNPO2, PDLIM7, PLN, and SYNM. Arterioscler. Thromb. Vasc. Biol. 2016;36:1947–1961. doi: 10.1161/atvbaha.116.307893. [DOI] [PMC free article] [PubMed] [Google Scholar]
- 17.Moon YA, Shah NA, Mohapatra S, Warrington JA, Horton JD. Identification of a mammalian long chain fatty acyl elongase regulated by sterol regulatory element-binding proteins. J. Biol. Chem. 2001;276:45358–45366. doi: 10.1074/jbc.M108413200. [DOI] [PubMed] [Google Scholar]
- 18.Matsuzaka T, et al. Cloning and characterization of a mammalian fatty acyl-CoA elongase as a lipogenic enzyme regulated by SREBPs. J. Lipid Res. 2002;43:911–920. doi: 10.1089/10799900260100231. [DOI] [PubMed] [Google Scholar]
- 19.Green CD, Olson LK. Modulation of palmitate-induced endoplasmic reticulum stress and apoptosis in pancreatic β-cells by stearoyl-CoA desaturase and Elovl6. Am. J. Physiol. Endocrinol. Metab. 2011;300:E640–649. doi: 10.1152/ajpendo.00544.2010. [DOI] [PubMed] [Google Scholar]
- 20.Matsuzaka T, Shimano H. Elovl6: A new player in fatty acid metabolism and insulin sensitivity. J. Mol. Med. (Berl.) 2009;87:379–384. doi: 10.1007/s00109-009-0449-0. [DOI] [PubMed] [Google Scholar]
- 21.Liu Y, et al. Genetic analysis of the ELOVL6 gene polymorphism associated with type 2 diabetes mellitus. Braz. J. Med. Biol. Res. 2013;46:623–628. doi: 10.1590/1414-431x20133103. [DOI] [PMC free article] [PubMed] [Google Scholar]
- 22.Matsuzaka T. Role of fatty acid elongase Elovl6 in the regulation of energy metabolism and pathophysiological significance in diabetes. Diabetol. Int. 2021;12:68–73. doi: 10.1007/s13340-020-00481-3. [DOI] [PMC free article] [PubMed] [Google Scholar]
- 23.Hu X, et al. GLCCI1 Deficiency induces glucocorticoid resistance via the competitive binding of IRF1:GRIP1 and IRF3:GRIP1 in asthma. Front. Med. (Lausanne) 2021;8:686493. doi: 10.3389/fmed.2021.686493. [DOI] [PMC free article] [PubMed] [Google Scholar]
- 24.Kiuchi Z, et al. GLCCI1 is a novel protector against glucocorticoid-induced apoptosis in T cells. FASEB J. 2019;33:7387–7402. doi: 10.1096/fj.201800344RR. [DOI] [PubMed] [Google Scholar]
- 25.Kim SH, Kim HJ, Kim CW. GLCCI1 is a novel component associated with the PI3K signaling pathway in podocyte foot processes. Exp. Mol. Med. 2016;48:e233. doi: 10.1038/emm.2016.28. [DOI] [PMC free article] [PubMed] [Google Scholar]
- 26.Wang H, et al. Tankyrase inhibition ameliorates lipid disorder via suppression of PGC-1α PARylation in db/db mice. Int. J. Obes. (Lond.) 2020;44:1691–1702. doi: 10.1038/s41366-020-0573-z. [DOI] [PMC free article] [PubMed] [Google Scholar]
- 27.Zhong L, et al. The PARsylation activity of tankyrase in adipose tissue modulates systemic glucose metabolism in mice. Diabetologia. 2016;59:582–591. doi: 10.1007/s00125-015-3815-1. [DOI] [PubMed] [Google Scholar]
- 28.Sen M, et al. PTPRT epigenetic silencing defines lung cancer with STAT3 activation and can direct STAT3 targeted therapies. Epigenetics. 2020;15:604–617. doi: 10.1080/15592294.2019.1676597. [DOI] [PMC free article] [PubMed] [Google Scholar]
- 29.Wang X, et al. Association of PTPRD/PTPRT mutation with better clinical outcomes in NSCLC patients treated with immune checkpoint blockades. Front. Oncol. 2021;11:650122. doi: 10.3389/fonc.2021.650122. [DOI] [PMC free article] [PubMed] [Google Scholar]
- 30.Feng X, et al. PTPRT regulates high-fat diet-induced obesity and insulin resistance. PLoS ONE. 2014;9:e100783. doi: 10.1371/journal.pone.0100783. [DOI] [PMC free article] [PubMed] [Google Scholar]
Associated Data
This section collects any data citations, data availability statements, or supplementary materials included in this article.
Data Availability Statement
All relevant data are included in the papers. Please contact the corresponding author for additional information regarding data access.


