Abstract
It recently has been reported that partial‐epithelial–mesenchymal transition (p‐EMT) program is associated with metastasis in head and neck squamous cell carcinoma (HNSCC). We previously have identified POSTN (which encodes periostin) as an invasion‐promoting molecule in HNSCC. Interestingly, POSTN expression is frequently observed in cancer cells with higher p‐EMT score by using a previous single‐cell transcriptomic data of HNSCC cases. Although it is known that POSTN has 11 splicing variants, the role of them has not been determined in HNSCC. Here, we found that HNSCC cells with EMT features expressed POSTN isoforms, Iso3 (lacking exon 17 and 21) and Iso5 (lacking exon 17), whereas fibroblast expressed Iso3 and Iso4 (lacking exon 17, 18, and 21). The expression of POSTN Iso3 and Iso4 are known to be widely observed in various cell types including stromal cells. Therefore, we focused on the role of novel cancer cell‐derived POSTN isoform, Iso5, in HNSCC. Single overexpression of POSTN Iso5 as well as Iso3 promoted invasion. Surprisingly, Iso5 synergistically promoted invasion together with Iso3. Notably, Iso5 as well as Iso3 upregulated p‐EMT‐related genes. We suggest that a novel cancer‐specific POSTN isoform lacking exon 17 (Iso5) can be a useful marker for detecting cancer cells undergoing p‐EMT. Moreover, a POSTN Iso5 can be a novel target for diagnosis and therapy in HNSCC.
Keywords: head and neck squamous cell carcinoma, invasion–, isoform, metastasis, Periostin
In this study, we identified a POSTN isoform lacking exon 17 (Iso5) as a promoting factor of tumor progression via p‐EMT program in HNSCC. HNSCC cells having co‐expression of POSTN Iso3 and Iso5 may possess more aggressive invasive potential. We suggest that POSTN Iso5 can be a useful marker for detecting cancer cells undergoing EMT.
1. INTRODUCTION
Head and neck squamous cell carcinoma (HNSCC) has an annual incidence of over 500,000 cases worldwide. 1 HNSCC has an approximately 50% of 5‐year survival rate. Unfortunately, in over 2 decades, the 5‐year survival rate has not improved. 2 In a multistep process of HNSCC development, multiple genetic and epigenetic alterations are accumulated. 3 We previously identified POSTN (which encodes periostin) by comparing the gene expression profiles of parent cells and their highly invasive clone. 4 Periostin encoded by the POSTN gene (GenBank: D13664) is a secreted and a vitamin K‐dependent glutamate‐containing matricellular protein. 5 , 6 To date, POSTN expression has been shown to be induced by growth factors (Transforming growth factor‐β1 (TGF‐β1), TGF‐β2, TGF‐β3, BMP‐2, BMP‐4, Vascular Endothelial Growth Factor (VEGF), connective tissue growth factor 2 (CTGF2)), interleukins (IL‐3, −4, −6 and − 13), vitamin K, and valsartan in a cell‐specific context. 7
In various cancers, the elevated POSTN expression is observed and is involved in malignant behaviors. 8 We previously found that ectopic periostin promotes invasion, anchorage‐independent growth, angiogenesis, lymphangiogenesis, and metastasis. 4 , 9 Bao et al. demonstrated that periostin overexpression displayed accelerated metastatic growth of colon cancer cells and promoted cancer cell survival via activation of Akt/PKB pathway. 10 Clinical studies in oral, breast, and colon cancers reveal that POSTN is well correlated with angiogenesis and metastasis. 9 , 10 , 11 , 12 In addition, periostin drives the epithelial–mesenchymal transition (EMT) via induction of matrix metalloproteinase 9 (MMP‐9), MMP‐10, and MMP‐13 expression, resulting in local tumor spread via extracellular matrix degradation. 13 , 14 , 15 Furthermore, periostin plays a role in remodeling of the tumor microenvironment. 4 , 16 , 17 , 18 , 19 On the other hand, metastatic colonization can be achieved by stromal periostin via the interaction between cancer stem cells and their metastatic niche. 20 , 21 , 22
EMT is defined by a loss of epithelial cell junctions and polarity and an acquisition of mesenchymal properties. 23 In early stage of metastatic process, cancer cells lose cell–cell adhesion and increase the mobility via EMT. 24 During EMT induction during cancer progression, solid cancer cells exhibit the hybrid epithelial and mesenchymal characteristics, and this process is known as a partial EMT (p‐EMT). 25 , 26 , 27 , 28 It is thought that the p‐EMT program in cancer cells is involved in enhanced invasive properties, generation of circulating tumor cells, and resistance to anticancer drugs. 29 , 30 It is believed that p‐EMT rather than complete EMT possesses a higher metastatic risk. Single‐cell transcriptional profiles from HNSCC patients reveal that a p‐EMT program exhibits the expression of extracellular matrix (ECM) proteins and lacks the expression of classical EMT transcription factors. 31
So far, 11 different splice variants of POSTN have been described. 7 , 32 , 33 However, functional implications of POSTN splicing variants are not fully understood yet. Potentially, in various tissues and disease states, distinct splicing variants may have different functions. In this study, therefore, we investigated the expression patterns and the role of POSTN splicing variants of HNSCC cell lines. A novel cancer cell‐derived POSTN isoform (Iso5) was specifically identified in HNSCC cells and synergistically enhanced invasion with a common isoform (Iso3).
2. MATERIALS AND METHODS
2.1. scRNA‐seq data analysis
The processed single‐cell RNA‐seq data obtained from the GEO database (accession number: GSE103322) was used. 30 The log‐transformed expression data from the cancer cells or noncancer cells were re‐analyzed using the Seurat (v4.1.1) R package. 31 Clustering analysis was initially performed with default settings using all cells, including cancer or noncancer cells. We used top 15 principal components (PCs) as an input to Uniform Manifold Approximation and Projection (UMAP) analysis. The resolution parameter was set to 0.4 for the FindClusters function. Then, the eight cancer cells in the noncancer cell cluster were removed and the clustering analysis was performed again with cancer cells (PCs:13, resolution:0.6). The second‐level clustering for MEEI5/16 cluster was performed with the different parameter (resolution = 0.4) based on the re‐calculated top 10 PCs. Differential gene expression analysis between POSTN expressing and nonexpressing cells in MEEI16 tumor was performed with FindMarkers function and top20 differential‐expressed genes were visualized.
The p‐EMT scores for reported p‐EMT signatures 31 were calculated by single sample gene enrichment analysis using the ConsensusTME R package.
2.2. TCGA data analysis
RNA‐seq data of 564 (520 tumors, 44 normal) head and neck cancers (TCGA‐HNSC) were obtained using RTCGA R package. The fibroblast scores in each TCGA samples were calculated by ssGSEA using the ConsensusTME R package. The three‐year overall survival of HNSC patients with higher and lower expression in POSTN were analyzed using survival and survminer R package.
2.3. Reagents and antibodies
Growth factors were obtained from the following companies: TGF‐β1 (#240‐B‐010/CF), HGF (#294‐HG‐005/CF), and PDGF (#220‐BB‐010, R&D Systems, Inc.); basic FGF2 (#064–04541, FUJIFILM Wako Pure Chemical Corp.); and EGF (#100–47, Pepro Tech). We generated a polyclonal anti‐periostin antibody for detection exon 21 by using specific peptides (GHLFEDEEIKRLLQGC). For recognizing all periostin isoforms, we used an anti‐periostin antibody against N‐terminal of periostin (ab14041, Abcam). A mouse monoclonal anti‐GFP antibody and a mouse monoclonal β‐actin antibody were obtained from Wako and Sigma, respectively.
2.4. Cell culture
HSC2, HSC3, HSC4, and MRC‐5 were obtained from JCRB (Japanese Collection of Research Bioresources Cell Bank). HOC313, HOC621, HOC719‐PE, and HOC719‐NE cells were obtained from Prof. Nobuyuki Kamata (Hiroshima University). 34 These cells were maintained in Dulbecco's Modified Eagle's Medium (#044–29765, FUJIFILM Wako Pure Chemical Corp.) supplemented with heat‐inactivated 10% fetal bovine serum (#10099–141, Invitrogen) at 37°C in 5% CO2. MSCC‐Inv1 cells were established in our laboratory 4 and were maintained in Keratinocyte‐SFM (#17005042, Invitrogen) under a condition of 5% CO2 in air at 37 °C.
2.5. RT‐PCR
By using the RNeasy Mini Kit (#74106, Qiagen), total RNA was isolated from cells. Their purity was determined by a standard spectrophotometric method. From 500 ng total RNA, cDNA was synthesized by using the PrimeScript RT Master Mix (#RR036A, Takara Bio Inc). We used the following primers. human POSTN: forward, 5′‐CTCATAGTCGTATCAGGGGTCG‐3′ and reverse, 5′‐ACACAGTCGTTTTCTG‐3′; human GAPDH: forward, 5′‐TCCACCACCCTGTTGCTGTA‐3′ and reverse, 5′‐ACCACAGTCCATGCCATCAC‐3′ (product size, 450 bp). For analyzing splicing variants, we used the following primers. F1: CTTCAAAGAAATCCCCGTGAC; F2: GGAGGTGGAGAAACAGAAGAAA, R1: TCTTCTGTTTCTCCACCTCCA; R2: CAACTTCCTCACGGGTGTGT. Total cDNA was amplified with GoTaq® Green Master Mix (#M712, Promega). PCR was performed by using a T100 thermal cycler (Bio‐rad) for 35 cycles after an initial 2 min denaturation at 95°C, annealed for 30 sec at 58°C for F1/R1, 56.5°C for F1/R2 and 57°C for F2/R2, and then extended for 1 min at 72°C in all primers. The PCR products were electrophoresed on 1.2% or 3.0% agarose/TAE gels (#02468–66, Nakalai tesque, Inc.) at 100 mV and visualized by ethidium‐bromide staining.
2.6. Quantitative RT‐PCR
POSTN mRNA expression was determined by using a LightCycler 96 system (Roche) with SYBR Premix Ex Taq II reagent (#RR820A, Takara Bio). For detecting POSTN or GAPDH expression, the following primers were used. POSTN: forward, 5′‐CTCATAGTCGTATCAGGGGTCG‐3′ and reverse, 5′‐ACACAGTCGTTTTCTG‐3′; GAPDH: forward, 5′‐TCCACCACCCTGTTGCTGTA‐3′ and reverse, 5′‐GCATCCTGGGCTACACTGAG‐3′. Relative POSTN mRNA expression was normalized by GAPDH mRNA.
For the expression of p‐EMT genes, the following primers were used. SERPINE1: forward, 5′‐cgctgggaaagca ttaagag‐3′ and reverse, 5′‐cacgcccagctaatttttgt‐3′; TGF Beta Induced (TGFBI): 5′‐gtgtgtgctgtgcagaaggt‐3′ and reverse, 5′‐ttgagagtggtagggctgct‐3′; MMP10: 5′‐ggctctttcactcagcc aac‐3′ and reverse, 5′‐tcccgaaggaacagattttg‐3; LAMC2: 5′‐gtcactggagaacgctgtga‐3′ and reverse, 5′‐agacccatttcgtt ggacag‐3′; P4HA2: 5′‐tgtcaaactgacaccccgta‐3′ and reverse, 5′‐ggactcctgtcttgggatca‐3′; PDPN: 5′‐catcgaggatctgccaac tt‐3′ and reverse, 5′‐acgatgattgcaccaatgaa‐3′; ITGA5: 5′‐ct acaatgatgtggccatcg‐3′ and reverse, 5′‐ggatatccattgccatcc ag‐3′; LAMA3: 5′‐agatgaggcacatggagacc‐3′ and reverse, 5′‐ttcttttgcgctttgtgttg‐3′; CDH13: 5′‐tgatgatgccaaaaacctca‐3′ and reverse, 5′‐atgggcaggttgtagtttgc‐3′; TNC: 5′‐ggtacagt gggacagcaggt‐3′ and reverse, 5′‐gttaacgccctgactgtggt‐3′; MMP2: 5′‐atgacagctgcaccactgag‐3′ and reverse, 5′‐atttg ttgcccaggaaagtg‐3′; EMP3: 5′‐gtggtctcagcccttcacat‐3′ and reverse, 5′‐atgagggagagcaccatgag‐3′; INHBA: 5′‐cctcgga gatcatcacgttt‐3′ and reverse, 5′‐ccctttaagcccacttcctc‐3′; LAMB3: 5′‐gggggagatcacaaacttga‐3′ and reverse, 5′‐gtg ctggcagacacagacat‐3′; VIM: 5′‐attgcaggaggagatgcttca‐3′ and reverse, 5′‐gtggagtttcttcaaaaaggca‐3′; THBS2: 5′‐tcctg aaaacaatgccatca‐3′ and reverse, 5′‐gtccacagacccaaactcgt‐3′; CXCL13: 5′‐ctctgcttctcatgctgctg‐3′ and reverse, 5′‐tgaggg tccacacacacaat‐3′; FN1: 5′‐cagtgggagacctcgagaag‐3′ and reverse, 5′‐gtccctcggaacatcagaaa‐3′; MMP3: 5′‐gcagtttgct cagcctatcc‐3′ and reverse, 5′‐gagtgtcggagtccagcttc‐3′; MMP9: 5′‐ttgacagcgacaagaagtgg‐3′ and reverse, 5′‐gccattcacgtcg tccttat‐3′; RAB25: 5′‐ccatcacctcggcgtactat‐3′ and reverse, 5′‐tttgttacccacgagcatga‐3′; MT1X: 5′‐accccaactgctcctgct‐3′ and reverse, 5′‐tctgacgtccctttgcagat‐3′; GPX3: 5′‐tgcaacc aatttggaaaaca‐3′ and reverse, 5′‐ttcatgggttcccagaagag‐3′; SPP1: 5′‐cccacagacccttccaagta‐3′ and reverse, 5′‐ggggacaa ctggagtgaaaa‐3′; MXD1: 5′‐tgaacatggttatgcctcca‐3′ and reverse, 5′‐acttgattcgggtccaagtg‐3′. Relative mRNA expression of p‐EMT genes was normalized to GAPDH mRNA.
2.7. Generation of periostin isoform 3‐ and 5‐overexpressing HNSCC cells
Lentiviral vector and packaging plasmids (psPAX2 and pMD2.G) were obtained from Addgene. Lentiviral vectors expressing GFP, periostin Iso3, and Iso5 were generated by using In Fusion cloning kit (#NC1845088, Clontech) from pEGFP‐C1 (#6084–1, Clontech) or pcDNA3.1‐periostin Iso3 and Iso5 obtained from Genscript. Lentiviruses were generated by co‐transfection with each amount of lentiviral vector and packaging plasmids into Lenti‐X 293 T cells (#NC9834960, Clontech) using PEI max reagent (#24765–100, Polyscience, Warrington, USA). After 48 hours of transfection, supernatants were collected and filtered using a 0.45 μm membrane. Filtered supernatants with 4 μg/mL polybrene directly infected to HOC621 cells. After 24 hours, the medium was changed by fresh media with 1 μg/mL of puromycin (#A1113803, Invitrogen).
2.8. Western blot analysis
Western blotting was performed as described previously. 4 GFP, periostin Iso3‐ and Iso5‐overexpressing HOC621 cells were treated with 3 μM of monensin (#M5273, Sigma, Burlington, USA) for 24 hours. The intracellular protein expression of periostin is low because of the secretion from intracellular into extracellular. To quantify intracellular protein expression of periostin, we utilized monensin known as a protein transport inhibitor. Monensin blocks intracellular protein transport processes of any secreted proteins and induces the accumulation of these proteins in the Golgi complex. The increased accumulation of secreted proteins enhances the detectability of periostin with western blot analysis utilizing total cell lysate. Monensin treatment is well‐characterized method for detecting cytokines in intracellular staining with flowcytometry and immunofluorescence. 35 , 36 Then, cells were lysed using lysis buffer (50 mM pH 7.6 Tris–HCl, 150 mM NaCl, 1 mM EDTA, 1.5 mM MgCl2, 0.5% Nonidet P‐40, and 10% glycerol) with protease inhibitor cocktail (#04080‐24, Nacalai tesque). After centrifugation at 17,000 g for 20 min, the supernatant was collected. Protein concentration was measured using Bio‐Rad protein assay dye reagent (#5000006, Bio‐Rad laboratories Inc) by the absorption at 595 nm using a microplate reader (SpectraMax i3, Molecular Devices). Using 5%–20% gradient polyacrylamide gel (#E‐T520L, ATTO Corporation), 25 μg of protein were electrophoresed followed by blotting onto a nitrocellulose membrane (#10600093, Cytiva). By using an Immobilon HRP substrate (EMD Millipore Corporation), the signal was detected by a Fusion SOLO 7 S. EDGE (VILBER).
2.9. RNA Interference
Cells were seeded at a density of 1 × 10⁵ cells on a 6 cm dish and then transfected with oligonucleotides by using Lipofectamine RNAiMax (#100014472, Invitrogen). After 48 hours of transfection, total RNAs and lysates were prepared and analyzed by qPCR and immunoblotting, respectively. HOC719‐NE cells expressed periostin Iso3 and 5. To specifically knockdown POSTN Iso5, siRNAs were designed for targeting POSTN exon 21. For silencing all POSTN splicing variants, a 21‐bp duplex oligoribonucleotides corresponding to nucleotides 2397–2417 of the human POSTN mRNA sequence was used (Thermo Fisher Scientific). For silencing POSTN Iso 5, a siRNA targeting 5′‐GAAGAUGAAGAAAUUAAAAGA‐3′ (siRNA Ex21) was used (GeneDesign Inc.). The negative control siRNA was obtained from Horizon Discovery Ltd.
2.10. In vitro invasion assay
Invasion ability was determined by an in vitro invasion assay using an 8 μm pore cell culture insert (#3097, Becton Dickinson) in a 24‐well plate. Twenty micrograms of Matrigel (#354234, Becton Dickinson) was coated on the filter as a reconstituted basement membrane substance. Five hundred microliters of complete media or serum‐free medium (for TGF‐β1 treatment) were added to the lower compartment. 1.0–1.5 × 10⁵ cells were plated on the upper compartment of the cell culture insert with 100 μl of complete media or serum‐free medium. After incubation for 24 h at 37°C, the cells were fixed with formalin and stained with hematoxylin (#131‐09665, FUJIFILM Wako Pure Chemical Corp). By wiping with a cotton swab, the cells on the upper surface of the filter were removed, and the number of invaded cells (cells on the lower surface of the filter) was counted under a light microscope at 100x magnification. We assayed three times, and counted randomly selected three fields on the filter.
2.11. Statistical analysis
For qRT‐PCR analysis, the t‐test was used for comparing two groups. For in vitro invasion assay, data were processed in GraphPad Prism 9 (GraphPad) for statistical analyses using one‐way analysis of variance. For comparing p‐EMT and fibroblast scores and gene expression values between two groups in RNA‐seq data, Wilcoxon signed‐rank test was used. A p‐value of <0.05 was considered as a significant difference.
3. RESULTS
3.1. Expression of POSTN in HNSCC tissues
In previous studies, POSTN expression was observed in both cancer cells and stromal cells. 37 To know POSTN expression in various cell types within the HNSCC tissue, we used the processed RNA‐seq data obtained from the GEO database with single‐cell transcriptomes from HNSCC patients. 31 The log‐transformed expression data from the cancer cells or noncancer cells was re‐analyzed using the Seurat (v4.1.1) R package. 38 Single‐cell profiles of malignant and nonmalignant cells highlighted the composition of the tumor microenvironment. By the expression pattern of known marker genes of stromal cells including fibroblasts, endothelial cells, muscle satellite cells (MuSC), T cells, B/plasma cells, macrophages, dendritic cells, and mast cells, the nonmalignant cells were partitioned to annotated clusters (Figure S1A). POSTN expression was mainly observed in endothelial cells and cancer‐associated fibroblasts (CAFs) (Figure S1B). By analyzing using bulk RNA‐seq data (TCGA‐HNSC), POSTN expression in tumor tissues was lower than that in normal tissues (Figure S1C). This may reflect the lower fibroblast abundance in cancer tissues (Figure S1D). Three‐year survival between patients with higher and lower POSTN expression shows no difference, which may be reflected by POSTN expression in noncancer cells.
Then, the malignant cells were clustered according to their origin (Figure 1A). The cluster composed of two classical subtype tumors (MEEI5 and MEEI16) preferentially expressed POSTN (Figure 1A, B). As a result of re‐clustering, POSTN was preferentially expressed in MEEI16. Notably, previous report has revealed that MEEI16 showed a highest p‐EMT score among the HNSCC cases, 28 suggesting that POSTN may be involved in p‐EMT program.
FIGURE 1.
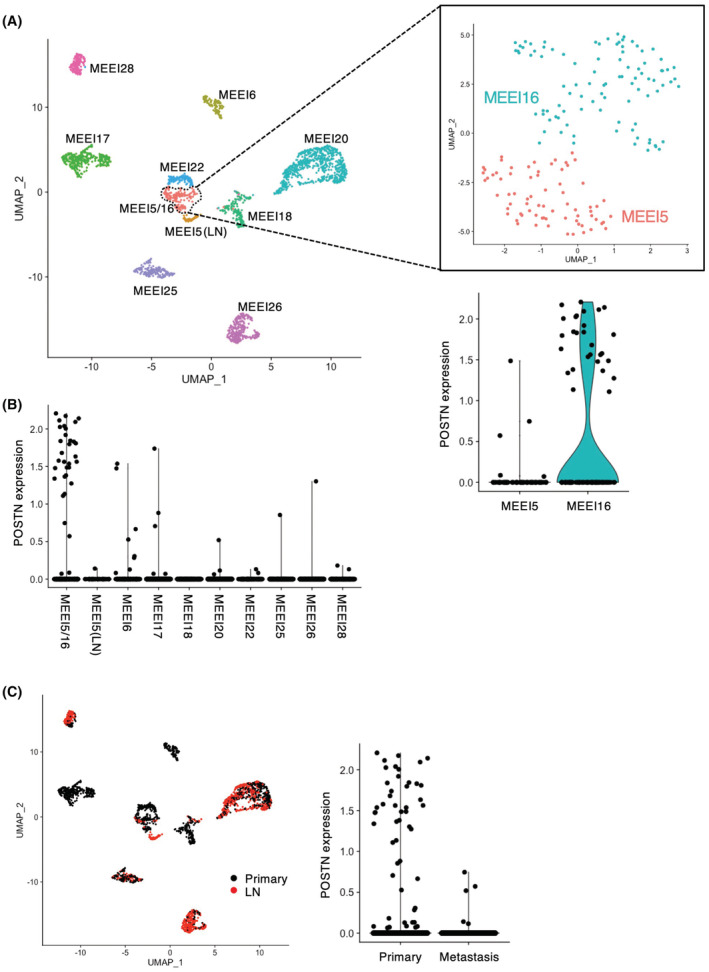
POSTN expression in the heterogeneity of cancer cells within the HNSCC tissues. The processed RNA‐seq data obtained from the GEO database (accession number: GSE103322) was used. 31 (A) UMAP plot of cancer cells from 10 patients (indicated by colors) reveals tumor‐specific clusters. Zoomed in UMAP plot of MEEI5/16 with MEEI5 and MEEI16, which can be seen to further divide into two subclusters. Violin plot depicts distributions of the POSTN expression in MEEI5/16 cluster. (B) Cells with POSTN expression are plotted in each cluster. (C) Cells from primary tumors and metastatic lymph nodes are colored black and red. Violin plot depicts distributions of the POSTN expression in the cells.
3.2. Expression of POSTN isoforms in HNSCC cell lines
In HNSCC cell lines and fibroblasts, the POSTN expression was examined. Our previous reports showed that HOC313, HOC719‐NE, and MSCC‐Inv1 cells have an EMT phenotype. 39 POSTN expression was detected only in HNSCC cells with an EMT phenotype (HOC313, HOC719‐NE, and MSCC‐Inv1) and fibroblasts (MRC5) (Figure 2A). As HOC719‐NE, MSCC‐inv1 and MRC5 cells showed higher level of POSTN expression, we examined the isoforms of POSTN in these cells.
FIGURE 2.
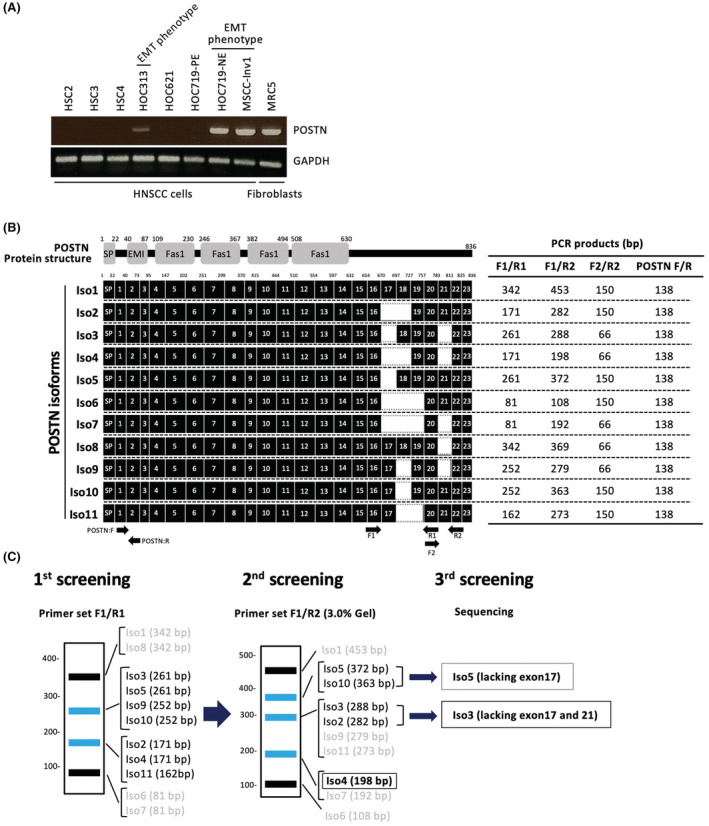
The schematic model of screening methods for POSTN isoforms. (A) POSTN expression was examined by RT‐PCR in HNSCC cell lines and normal fibroblast. GAPDH was used as a control. (B) Periostin protein structure and isoforms (Iso1‐11) are shown. Moreover, primers (F1, F2, R1, and R2) and the product size of each primer set F1/R1, F1/R2 and F2/R2 are shown. (C) The screening method for determination of POSTN isoforms using each primer sets.
POSTN protein contains a secretory signal peptide (SP), a cysteine‐rich EMI domain, and four internal FAS1 repeats (Figure 2B). Human POSTN gene exists on chromosome 13, with genes consisting of 23 exons. POSTN splicing variants are found at the C‐terminal side between exons 17 and 21. In this study, we examined the detection of all 11 isoforms in MSCC‐Inv1, HOC719‐NE, and MRC5. To screen for POSTN isoforms, we designed specific primer sets (F1/R1, F1/R2, and F2/R2) (Figure 2B). These primer sets recognized several isoforms and the expression of POSTN isoforms can be detected by combination of RT‐PCR analysis by using these primer sets (Figure 2B, C). Primer set F1/R1 recognized four bands: Iso1/Iso8, Iso3/Iso5/Ios9/Iso10, Iso2/Iso4/Iso11, and Iso6/Iso7 (Figure 2C, left panel). Primer set F1/R2 recognized five bands: Iso1, Iso5/Iso10, Iso2/Iso3, Iso4/Iso7, and Iso6 (Figure 2C, middle panel). Finally, we distinguished the isoforms lacking exon 17 and lacking exon 17 plus exon 21 by sequencing of gel‐extracted PCR products (Figure 2C, right panel).
In all cells, primer set F1/R1 recognized one band: Iso3/Iso5/Ios9/Iso10 in HOC719‐NE and MSCC‐Inv1 cells and two bands: Iso3/Iso5/Ios9/Iso10 and Iso2/Iso4/Iso11 in MRC5 cells (Figure 3A). Then, primer set F1/R2 recognized Iso3 in MSCC‐Inv1 cells, two bands: Iso5/Iso10 and Iso3 in HOC719‐NE cells, and two bands: Iso3 and Iso4 in MRC5 cells (Figure 3B). Iso3 and Iso9/Iso11 could be distinguished by loading PCR products in 3.0% agarose gel. Finally, we performed sequencing the bands for confirming the isoforms. Collectively, MSCC‐Inv1, HOC719‐NE, and MRC5 cells expressed Iso3, Iso4, or Iso5 (Figure 3C). All cells showed strongly positive for Iso3. Interestingly, HOC719‐NE cells showed strongly positive for Iso5, and MRC5 cells showed strongly positive for Iso4. These findings indicated that Iso3 may be a common in HNSCC cells and fibroblasts, but Iso5 may be a specific isoform in some HNSCC cells. Indeed, previous study showed that Iso3 are common in various types of the cells and Iso4 are frequently observed in periodontal ligament cells41 (Table 1). However, only one report showed that Iso5 is detected in thyroid tissue and periodontal ligament. 40
FIGURE 3.
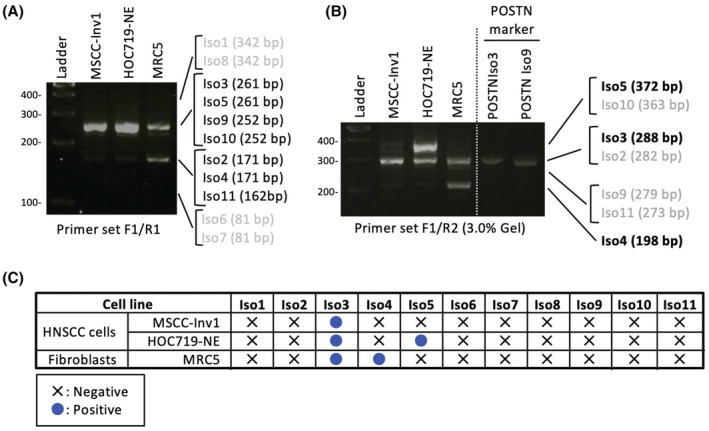
Expression of POSTN isoforms in HNSCC cell lines. (A) POSTN isoforms were detected by RT‐PCR using primer set F1/R1 in MSCC‐Inv1, HOC719‐NE, and MRC5 cells. (B) POSTN isoforms were detected by RT‐PCR using primer set F1/R2 in MSCC‐Inv1, HOC719‐NE, and MRC5 cells. To distinguish Iso3 and Iso9, PCR products by using primer set F1/R2 from POSTN Iso3 and Iso9 constructs were used as a marker. (D) Summary of the expression of POSTN isoforms in MSCC‐Inv1, HOC719‐NE, and MRC5 cells.
TABLE 1.
Overview of the POSTN isoforms
| In this study POSTN Isoforms | NCBI reference sequence | Exons missing | NCBI | Morra et al., 201144 | Morra et al., 201245 | Bai et al., 201042 | Yamada et al., 201441 | Kim et al., 200846 | ||||||
|---|---|---|---|---|---|---|---|---|---|---|---|---|---|---|
| RCC | Normal kidney | Fetal Kidney | NSCLC | Normal lung | Fetal lung | Thyroid | Periodontal ligament | TCC | ||||||
| Iso1 | NP_006466.2 | None | Iso1 | Iso1 | − | − | + | Iso1 | − | − | + | thy1 | Type I | WT |
| Iso2 | NP_001129406.1 | 17, 18 | Iso2 | Iso2 | − | − | + | Iso2 | + | + | + | thy3 | − | Variant III |
| Iso3 | NP_001129407.1 | 17, 21 | Iso3 | Iso3 | + | + | + | Iso3 | + | + | + | thy6 | Type III | Variant II |
| Iso4 | NP_001129408.1 | 17, 18, 21 | Iso4 | Iso4 | + | + | + | Iso4 | + | + | + | thy7 | Type II | Variant I |
| Iso5 | NP_001273594.1 | 17 | − | ND | ND | ND | − | ND | ND | ND | thy2 | Type V | − | |
| Iso6 | NP_001273595.1 | 17, 18, 19 | Iso6 | Iso7 | − | − | + | Iso7 | + | + | + | thy4 | − | − |
| Iso7 | NP_001273596.1 | 17, 18, 19, 21 | Iso7 | Iso8 | + | + | + | Iso8 | + | + | + | thy8 | − | − |
| Iso8 | NP_001317446.1 | 21 | Iso8 | Iso5 | − | − | + | Iso5 | − | − | + | thy5 | − | − |
| Iso9 | − | 18, 21 | − | − | − | − | + | Iso9 | − | − | + | − | − | − |
| Iso10 | − | 18 | − | Iso6 | − | − | + | Iso6 | − | − | − | − | − | − |
| Iso11 | − | 18, 19 | − | − | ND | ND | ND | − | ND | ND | ND | − | Type IV | − |
3.3. Induction of POSTN isoforms by TGF‐β1
Previous report showed that several growth factors including TGF‐β1, BMP, and VEGF induced POSTN expression in a cell‐specific context. 7 In HNSCC tissue, TGF‐β1 was produced by several types of the cells (Figure S2A) and its receptor, TGFBR2 as well as POSTN was preferentially expressed in tumors including where p‐EMT program was detected (MEEI5, 16, 17, and 28) (Figure S2B). Then, we treated growth factors including TGF‐β1, FGF2, PDGF, HGF, and EGF in HOC621 to examine the induction of POSTN. Among growth factors, TGF‐β1 markedly induced POSTN expression (Figure 4A, B). We examined POSTN induction by TGF‐β1 in HNSCC cells with low POSTN expression or without POSTN expression. POSTN was induced by TGF‐β1 treatment in HOC621 and HOC313 cells (Figure 4C). In HOC621 cells, both POSTN Iso3 and Iso5 were induced by TGF‐β1 treatment (Figure 4D). Indeed, the invasion of HOC621 cells was significantly promoted by TGF‐β1 treatment (Figure 4E).
FIGURE 4.
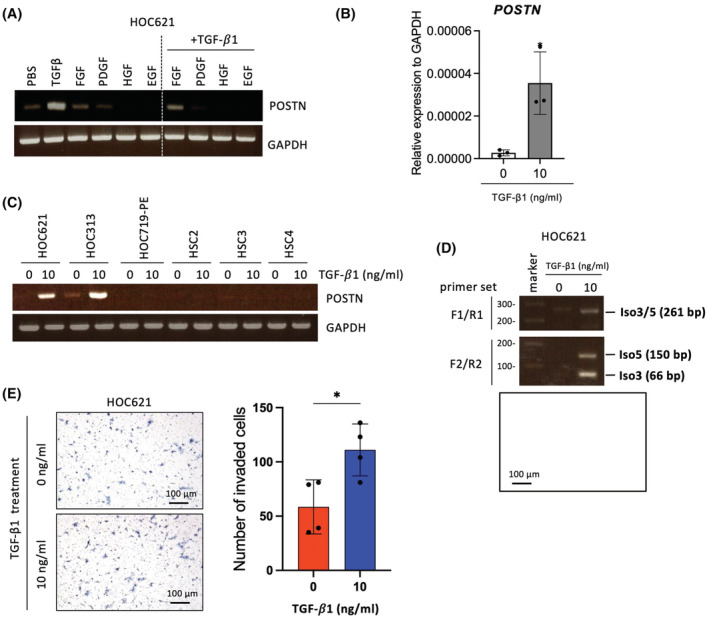
The upregulation of POSTN expression and detection of isoforms in TGF‐β1 treated HNSCC cell lines. (A) HOC621 cells were treated with TGF‐β1, FGF2, PDGF, HGF, and EGF for 24 hours. Cells were then collected and analyzed POSTN expression by RT‐PCR. GAPDH was used as a control. (B) POSTN mRNA expression was determined by qRT‐PCR in HOC621 cells after TGF‐β1 treatment. In each group, data were presented as the mean ± SD of triplicates. *P < 0.05 (C) HNSCC cell lines (HOC621, HOC313, HOC719‐NE, HSC2, HSC3, and HSC4) were treated with 10 ng/mL of TGF‐β1 for 24 hours. Cells were then collected and analyzed POSTN expression by RT‐PCR. GAPDH was used as a control. (D) POSTN isoforms were detected by RT‐PCR using primer set F1/R1 or F2/R2 in TGF‐β1 treated HOC621 cells. (E) The invasion ability of HOC621 cells with or without TGF‐β1 treatment was examined by in vitro invasion assay. Representative images were shown. Graph shows the number of invaded cells as mean ± SEM (n = 3). *p < 0.05.
3.4. Synergistic effect of POSTN Iso5 for promoting invasion by Iso3
Screening for POSTN isoforms by combination of several primer sets revealed that HNSCC cells expressed POSTN Iso3 and Iso5 as shown in Figure 3C. Iso3 is known as a common isoform in various types of cancer. Indeed, we previously showed that Iso3 promoted invasion and metastasis in HNSCC. 4 , 9 However, the role of Iso5 remains unclear. Therefore, here we focused on the role of Iso5 in HNSCC.
We generated Iso5‐overexpressing cells by using HOC621 cells without POSTN expression (Figure 5A, B). We also generated empty vector (GFP)‐transfected cells and Iso3‐overexpressing cells. Ectopic expression of POSTN Iso3 and Iso5 did not change the morphology and cell proliferation, compared with GFP (data not shown). We also detected periostin isoforms after treatment with monensin, which blocks the transport from the medial to the trans cisternae of the Golgi stack (Figure 5C). Anti‐periostin antibody recognized both Iso3 and Iso5, anti‐periostin Ex21 antibody recognized Iso5 (Figure 5C).
FIGURE 5.
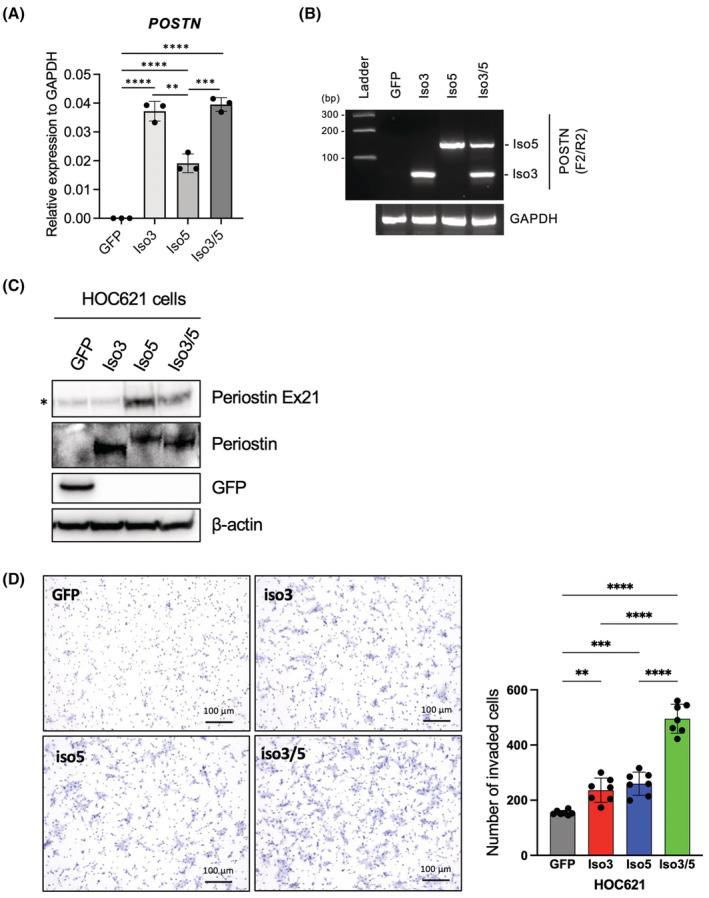
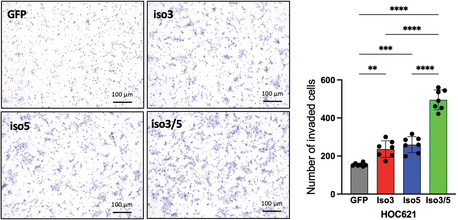
POSTN Iso5 cooperatively promotes invasion with Iso3 which is conventional isoform. (A) HOC621 cells were engineered to overexpressing GFP, POSTN Iso3 and/or Iso5 by transfection with lentiviral gene transfer. The overexpression of GFP was used as a control. Ectopic expression of POSTN Iso3 and Iso5 was quantified by qRT‐PCR. In each group, data are presented as the mean ± SD of triplicates. ****p < 0.001, ***p < 0.005, **p < 0.01. (B) Ectopic expression of POSTN Iso3 and Iso5 were detected by RT‐PCR using primer set F2/R2. GAPDH was used as a loading control. (C) Ectopic expression of Periostin Iso3 and Iso5 with monensin treatment was examined by immunoblotting with antibodies detecting N‐terminus and exon 21 of POSTN. anti‐Ex21 periostin antibody can detect POSTN Iso5 but not Iso3 lacking Exon 21. β‐Actin was used as a control. (D) The invasion ability of GFP‐, POSTN Iso3‐, Iso5, and Iso3/5‐overexpressing HOC621 cells were examined by in vitro invasion assay. Representative images were shown. Graph shows the number of invaded cells as mean ± SEM (n = 3). ****p < 0.001, ***p < 0.005, **p < 0.01.
By using Iso5‐overexpressing cells, we compared the invasion ability with control (GFP‐transfected cells) and Iso‐3 overexpressing cells. Iso5 as well as Iso3 promoted invasion at the similar level, in comparison with GFP‐transfected cells (Figure 5D). Moreover, we examined the synergistic effect of Iso3 and Iso5 (Iso3/5) in the invasion. Interestingly, Iso3/5 overexpression remarkably promoted invasion comparing with single overexpression, even though the total expression of POSTN was comparable level (Figure 5A–D). Thus, POSTN Iso5 promoted the invasion and co‐expression with Iso3 showed synergistic effect for invasion.
3.5. Suppressed invasion by POSTN Iso5 depletion
To confirm the role of POSTN Iso5 in the invasion, we designed siRNA (siEx21) targeting exon 21 for the specific knockdown of Iso5 (Figure 6A). In addition, we designed siRNA (siPOSTN) targeting all isoforms of POSTN (Figure 6A). We confirmed the knockdown efficiency after transfection of these siRNAs in HOC621 cells overexpressing with POSTN Iso5. POSTN Iso5 expression was significantly downregulated by both siPOSTN and siEx21 siRNAs (Figure 6B). Next, we transfected these siRNAs to HOC719‐NE cells with the expression of both POSTN Iso3 and 5. The total expression of POSTN including Iso3 and Iso5 was suppressed by siPOSTN (Figure 6C, D). On the other hand, siEx21 specifically suppressed the expression of Iso5 but not Iso3. Then, we performed in vitro invasion assay after depletion of Iso5 by using siEx21 in HOC719‐NE cells. Depletion of Iso5 did not affect the morphology and slightly decreased the cell growth (data not shown). In HOC719‐NE cells, Iso5 depletion remarkably suppressed the invasion without affecting total POSTN levels (Figure 6C, E), indicating that POSTN promoted the invasion and that co‐expression with Iso3 and 5 showed synergistic effect for invasion.
FIGURE 6.
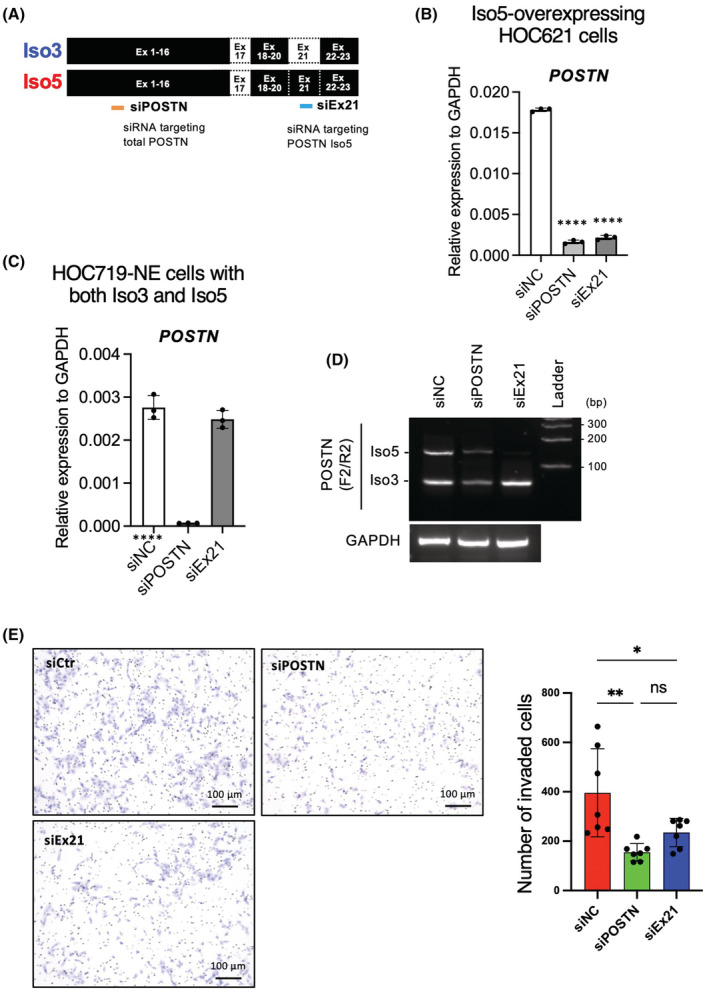
Knockdown of POSTN Iso5 attenuates invasion ability in HNSCC cell line having EMT feature. (A) The structure of POSTN Iso3 and Iso5 are shown. Moreover, siRNA targeting POSTN Iso5 (siEx21) or total POSTN are shown. (B) POSTN mRNA expression in Iso5‐overexpressing HOC621 cells were determined by qRT‐PCR. In each group, data are presented as the mean ± SD of triplicates. ****p < 0.001 (C) POSTN mRNA expression in negative control siRNA (siNC), total POSTN siRNA (siPOSTN), and siRNA targeting POSTN Iso5 (siEx21)‐transfected HOC719‐NE cells were determined by qRT‐PCR. In each group, data are presented as the mean ± SD of triplicates. ****p < 0.001 (D) POSTN isoforms were detected by RT‐PCR using primer set F2/R2 in siNC, siPOSTN, and siEx21‐transfected HOC719‐NE cells. GAPDH was used as a control. (E) The invasion ability of siNC and siEx21‐transfected HOC719‐NE cells were determined by in vitro invasion assay. Representative images were shown. Graph shows the number of invaded cells as mean ± SEM (n = 3). ****p < 0.001.
3.6. Upregulation of p‐EMT genes by POSTN Iso3 and Iso5 overexpression
As shown in Figure 2A, POSTN expression was observed only in HNSCC cells with EMT features. Moreover, POSTN was preferentially expressed in MEEI16 with highest p‐EMT score among the HNSCC cases (Figure 1A), 31 suggesting that POSTN may be involved in p‐EMT program. A previous single‐cell analysis using HNSCC tissues identifies p‐EMT‐related genes. 31 By using this data, we compared POSTN expression with p‐EMT‐related genes. Interestingly, cells expressing POSTN transcripts (ON) in MEEI16 tumor expressed multiple common and variable p‐EMT genes at higher levels compared to cells not expressing POSTN (OFF) (Figure 7A). ON cells showed higher p‐EMT scores and TGFBI expression, a representative p‐EMT gene and homologous to POSTN (Figure 7B). Moreover, the correlation between POSTN expression and p‐EMT score in all type of tumors was examined. POSTN expression was strongly correlated with p‐EMT score in basal tumors where the p‐EMT program was detected, while both POSTN expression and p‐EMT score were lower in classical and atypical tumors 31 (Figure 7C). There were no differences in TGFBR expression between MEEI16 and other tumors, and between ON and OFF cells, suggesting the existence of a p‐EMT induction mechanism specific to POSTN‐expressing cells (Figure S2B, C).
FIGURE 7.
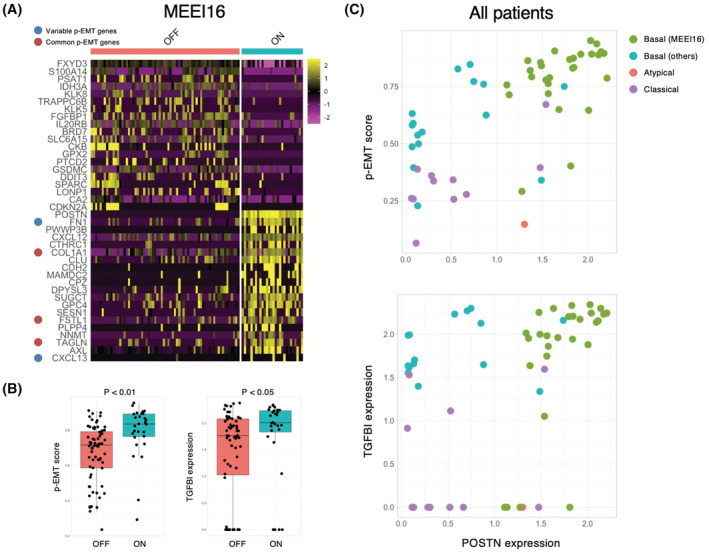
Correlation between POSTN and p‐EMT. (A) Heatmap shows top20 genes (columns) that are differentially expressed across POSTN expressing cells (ON) and POSTN nonexpressing cells (OFF) in MEEI16 tumor. (B) Boxplot shows p‐EMT score and TGFBI expression values in ON and OFF cells. (C) Scatter plot of p‐EMT score and POSTN expression value (upper), TGFBI expression value and POSTN expression value (lower) for ON cells in all tumors were shown. Each cell was colored by the reported TCGA molecular subtype.
To know the involvement of POSTN in p‐EMT program, we investigated the expression of p‐EMT‐related genes in Iso3‐, Iso5‐, and Iso3/5‐overexpressing HOC621 cells by qPCR and compared with GFP‐transfected control cells. Upregulation of several p‐EMT‐related genes were observed in POSTN Iso3‐, Iso5‐, and Iso3/5‐overexpressing cells, in comparison with control cells (Figure 8A). Moreover, we examined the effect of siPOSTN (targeting both Iso3 and Iso5) and siEx21 (targeting Iso5) on the expression of p‐EMT‐related genes in HOC719‐NE cells with Iso3 and Iso5 expression. Several p‐EMT‐related genes were downregulated by siPOSTN or siEx21 (Figure 8B). In POSTN Iso3/5 overexpressing cells, SERPINE1, MMP10, TNC, CXCL13, and MMP3 were upregulated (Figure 8A). Moreover, among them, siEX21 and siPOSTN downregulated MMP10, LAMC2, INHBA, MMP3, and RAB25 (Figure 8B). Therefore, MMP10 and MMP3 may be involved in p‐EMT induction by POSTN isoforms (Iso3 and Iso5).
FIGURE 8.
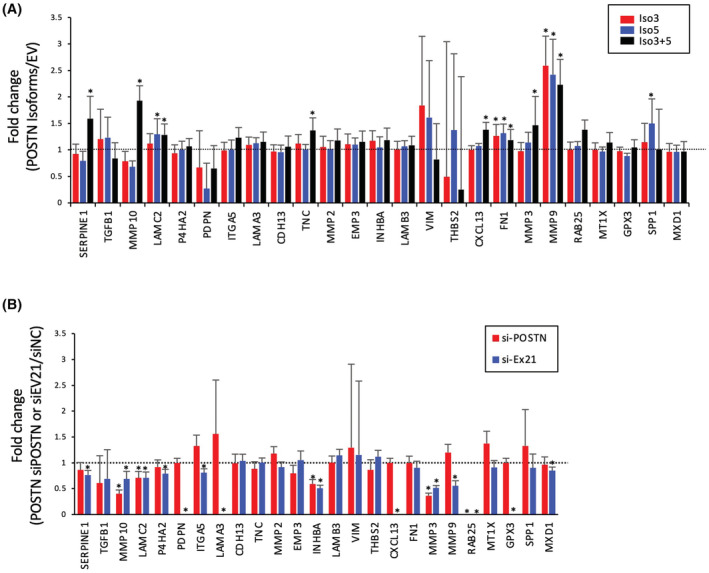
Induction of p‐EMT genes by POSTN Iso3 and/or Iso5. (A) HOC621 cells were engineered to overexpressing POSTN Iso3 and/or Iso5 by transfection with lentiviral vector. The overexpression of GFP was used as a control. Expression of p‐EMT genes was evaluated by qPCR in EV‐, POSTN Iso3‐, Iso5, and Iso3/5‐transfected HOC621 cells. The graphs show the results as mean ± S.D. of three independent experiments. *p < 0.05 (compared to EV). (B) Expression of p‐EMT genes was evaluated by qPCR in negative control siRNA (siNC), siRNA targeting POSTN Iso3 and 5 (siPOSTN), and siRNA targeting POSTN Iso5 (siEx21)‐transfected HOC719‐NE cells with both POSTN Iso3 and Iso5 expression. The graphs show the results as mean ± S.D. of three independent experiments. *p < 0.05 (compared to siNC).
4. DISCUSSION
It has been widely accepted that POSTN is closely involved in cancer progression. 35 In this study, POSTN expression is preferentially observed in endothelial cells, CAFs, and HNSCC cells with the highest p‐EMT score. Indeed, cells with p‐EMT phenotype localize close to CAFs at the leading edge of primary tumor tissues. 31 Moreover, a TGF‐β‐responsive gene, TGFBI is one of the top‐scoring genes in the p‐EMT program. 31 Interestingly, POSTN is highly homologous to TGFBI with FAS1 domains. 41 Indeed, TGF‐β1 upregulates POSTN in certain type of HNSCC cells (Figure 4C). From these observations, POSTN may be concerned with the p‐EMT program. It is well accepted that cancer cells with p‐EMT phenotype show a higher metastatic property, compared with complete EMT phenotype. Interestingly, overexpression of POSTN Iso3 and/or five upregulated p‐EMT‐related genes. As Iso5 depletion suppressed several p‐EMT‐related genes, Iso5 may be contributed to p‐EMT program. Although POSTN itself could not induce EMT evaluated by morphology and loss of E‐cadherin (data not shown), POSTN may promote tumor progression via p‐EMT program under TGF‐β signaling pathway.
Recently, it has been revealed that POSTN has several different splicing variants. 7 , 32 , 33 However, the expression pattern of POSTN isoforms in HNSCC and the functional difference among POSTN isoforms are not fully understood. To date, eight different isoforms of POSTN are registered in NCBI (Table 1). In addition, other three isoforms were also reported in various types of tissues. 40 , 42 , 43 , 44 , 45 POSTN isoforms differ in their C‐terminal sequences (exons 17–21). On the other hand, N‐terminal sequences are common, and the EMI and Fas1 domains within N‐terminus are responsible for integrin binding 37 (Figure 2B). In previous studies, POSTN isoforms were examined by PCR in the various tissues. 40 , 42 , 43 , 44 , 45 However, several types of the cells are included in the tissues. Therefore, here we used the cell lines to know the expression pattern of POSTN isoforms. Indeed, POSTN expression was only observed in HNSCC cells with EMT features. These HNSCC cells and fibroblasts expressed Iso3 and 4. Iso3 was a common isoform in HNSCC cells and fibroblasts and construct of Iso3 has been used for overexpression experiments in previous studies. 40 , 42 , 43 , 44 , 45 Iso4 is also frequently observed in various types of the tissue. 40 , 42 , 43 , 44 , 45 However, only so far has been reported that Iso5 is detected in fetal kidney. 43 This is the first report that Iso5 is detected in cancer cells. We think that Iso5 may be cancer cell‐derived specific isoform in HNSCC cells.
The phenotypes driven by POSTN overexpression may be caused by promoted the downstream signals including migration, invasion, and survival via acting as a ligand for integrins. 4 , 10 , 11 , 46 , 47 In this study, we found co‐expression of Iso3 and Iso5 in HNSCC cells with EMT feature and in TGF‐β1 treated HNSCC cells. Interestingly, invasion ability driven by co‐expression of Iso3 and Iso5 was higher than that by single overexpression. As shown in Figure 2B, Iso3 lacks exon 17 and 21, and Iso5 lacks exon 17. Therefore, exon 21 may have synergistic effect with Iso3. POSTN activated several signaling pathways such as Akt/PKB pathway, YAP/TAZ pathway via the αvβ3 integrin‐FAK/Src axis. 10 , 48 POSTN expressing cells in MEEI16 tumors highly expressed the αvβ3 integrin ligands, such as FN1 and CXCL12 and p‐EMT genes. 49 , 50 The αvβ3 integrin signaling has recently been reported to induce p‐EMT, and signals from these integrin ligands, including POSTN, may contribute to the promotion of p‐EMT program. 51 Hence, it is interesting issue to analyze αvβ3 integrin‐FAK/Src signaling by co‐treatment of Iso3 and Iso5. In the follow‐up studies, we will examine the expression of POSTN Iso5 in a larger number of HNSCC cases by using a specific antibody against exon 21 generated in this study. During EMT, ESRP1 and ESRP2 (Epithelial Splicing Regulatory Proteins 1 and 2) coordinate an epithelial cell‐type‐specific splicing program via the alternative splicing of FGFR‐encoding transcripts. 52 , 53 Therefore, the change in alternative splicing may be essential for p‐EMT program.
This is the first report of cancer cell‐specific splicing variant of POSTN. However, as a limitation of this study, it is difficult to examine the expression of POSTN isoforms in HNSCC tissues. Previously, gene function analysis in TCGA bulk RNA‐seq data using various bioinformatics approaches has been reported. 54 , 55 In the case of POSTN, such analysis using bulk RNA‐seq data is difficult, because multiple cell types express multiple POSTN isoforms. To solve this problem, we should develop in situ hybridization by using a specific probe of each POSTN isoform. In this study, we identified a POSTN isoform lacking exon 17 (Iso5) as a promoting factor of tumor progression via p‐EMT program in HNSCC. HNSCC cells having co‐expression of POSTN Iso3 and Iso5 may possess more aggressive invasive potential. We also suggest that POSTN Iso5 can be a useful marker for detecting cancer cells undergoing EMT. Moreover, detection of POSTN Iso5 can be a novel diagnostic marker and therapeutic target in HNSCC.
AUTHOR CONTRIBUTIONS
Shao Wenhua: Data curation (equal); investigation (equal); writing – original draft (equal). Takaaki Tsunematsu: Conceptualization (equal); data curation (equal); funding acquisition (equal); investigation (equal); methodology (equal); resources (equal); visualization (equal); writing – original draft (equal). Masaki Umeda: Investigation (equal). Hiroaki Tawara: Investigation (supporting). Natsumi Fujiwara: Data curation (equal); formal analysis (equal); investigation (supporting); methodology (equal). Yasuhiro Mouri: Data curation (equal); formal analysis (equal); investigation (equal); methodology (equal); validation (equal). Rieko Arakaki: Investigation (supporting); methodology (supporting). Naozumi Ishimaru: Methodology (supporting); supervision (supporting); writing – review and editing (supporting). Yasusei Kudo: Conceptualization (lead); data curation (equal); formal analysis (equal); funding acquisition (lead); project administration (lead); resources (lead); supervision (lead); validation (lead); visualization (lead); writing – original draft (equal); writing – review and editing (lead).
FUNDING INFORMATION
This work was supported by grants to Y. Kudo from JSPS KAKENHI [22K19629, 22H03288, and 21KK0162]. This work was also supported by grants to T. Tsunematsu from JSPS KAKENHI [20K18480] and Nishiyama Dental Academy Foundation.
CONFLICT OF INTEREST
The authors have no conflict of interest.
Supporting information
Figure S1–S2.
ACKNOWLEDGMENTS
We thank Dr. X‐F. Wang (Duke University Medical Center) for providing POSTN expression vector.
Wenhua S, Tsunematsu T, Umeda M, et al. Cancer cell‐derived novel periostin isoform promotes invasion in head and neck squamous cell carcinoma. Cancer Med. 2023;12:8510‐8525. doi: 10.1002/cam4.5601
Contributor Information
Takaaki Tsunematsu, Email: tsunematsu@tokushima-u.ac.jp.
Yasusei Kudo, Email: yasusei@tokushima-u.ac.jp.
REFERENCES
- 1. Mao L, Hong WK, Papadimitrakopoulou VA. Focus on head and neck cancer. Cancer Cell. 2004;5(4):311‐316. [DOI] [PubMed] [Google Scholar]
- 2. Forastiere A, Koch W, Trotti A, Sidransky D. Head and neck cancer. N Engl J Med. 2001;345(26):1890‐1900. [DOI] [PubMed] [Google Scholar]
- 3. Fidler IJ. Critical factors in the biology of human cancer metastasis: twenty‐eighth GHA Clowes memorial award lecture. Cancer Res. 1990;50(19):6130‐6138. [PubMed] [Google Scholar]
- 4. Kudo Y, Ogawa I, Kitajima S, et al. Periostin promotes invasion and anchorage‐independent growth in the metastatic process of head and neck cancer. Cancer Res. 2006;66(14):6928‐6935. [DOI] [PubMed] [Google Scholar]
- 5. Horiuchi K, Amizuka N, Takeshita S, et al. Identification and characterization of a novel protein, Periostin, with restricted expression to periosteum and periodontal ligament and increased expression by transforming growth factor beta. J Bone Miner Res. 1999;14(7):1239‐1249. [DOI] [PubMed] [Google Scholar]
- 6. Takeshita S, Kikuno R, Tezuka K, Amann E. Osteoblast‐specific factor 2: cloning of a putative bone adhesion protein with homology with the insect protein fasciclin I. Biochem J. 1993;294(Pt1):271‐278. [DOI] [PMC free article] [PubMed] [Google Scholar]
- 7. Norris RA, Moreno‐Rodriguez R, Hoffman S, Markwald RR. The many facets of the matricelluar protein periostin during cardiac development, remodeling, and pathophysiology. J Cell Commun Signal. 2009;3(3–4):275‐286. [DOI] [PMC free article] [PubMed] [Google Scholar]
- 8. Ruan K, Bao S, Ouyang G. The multifaceted role of periostin in tumorigenesis. Cell Mol Life Sci. 2009;66(14):2219‐2230. [DOI] [PMC free article] [PubMed] [Google Scholar]
- 9. Siriwardena BS, Kudo Y, Ogawa I, et al. Periostin is frequently overexpressed and enhances invasion and angiogenesis in oral cancer. Br J Cancer. 2006;95(10):1396‐1403. [DOI] [PMC free article] [PubMed] [Google Scholar]
- 10. Bao S, Ouyang G, Bai X, et al. Periostin potently promotes metastatic growth of colon cancer by augmenting cell survival via the Akt/PKB pathway. Cancer Cell. 2004;5(4):329‐339. [DOI] [PubMed] [Google Scholar]
- 11. Shao R, Bao S, Bai X, et al. Acquired expression of periostin by human breast cancers promotes tumor angiogenesis through up‐regulation of vascular endothelial growth factor receptor 2 expression. Mol Cell Biol. 2004;24(9):3992‐4003. [DOI] [PMC free article] [PubMed] [Google Scholar]
- 12. Kikuchi Y, Kashima TG, Nishiyama T, et al. Periostin is expressed in pericryptal fibroblasts and cancer‐associated fibroblasts in the colon. J Histochem Cytochem. 2008;56(8):753‐756. [DOI] [PMC free article] [PubMed] [Google Scholar]
- 13. Deraz EM, Kudo Y, Yoshida M, et al. MMP‐10/stromelysin‐2 promotes invasion of head and neck cancer. PLoS One. 2011;6(10):e25438. [DOI] [PMC free article] [PubMed] [Google Scholar]
- 14. Kudo Y, Iizuka S, Yoshida M, et al. Matrix metalloproteinase‐13 (MMP‐13) directly and indirectly promotes tumor angiogenesis. J Biol Chem. 2012;287(46):38716‐38722. [DOI] [PMC free article] [PubMed] [Google Scholar]
- 15. Kudo Y, Iizuka S, Yoshida M, et al. Periostin directly and indirectly promotes tumor lymphangiogenesis of head and neck cancer. PLoS One. 2012;7(8):e44488. [DOI] [PMC free article] [PubMed] [Google Scholar]
- 16. Fukushima N, Kikuchi Y, Nishiyama T, Kudo A, Fukayama M. Periostin deposition in the stroma of invasive and intraductal neoplasms of the pancreas. Mod Pathol. 2008;21(8):1044‐1053. [DOI] [PubMed] [Google Scholar]
- 17. Erkan M, Kleeff J, Gorbachevski A, et al. Periostin creates a tumor‐supportive microenvironment in the pancreas by sustaining fibrogenic stellate cell activity. Gastroenterology. 2007;132(4):1447‐1464. [DOI] [PubMed] [Google Scholar]
- 18. Michaylira CZ, Wong GS, Miller CG, et al. Periostin, a cell adhesion molecule, facilitates invasion in the tumor microenvironment and annotates a novel tumor‐invasive signature in esophageal cancer. Cancer Res. 2010;70(13):5281‐5292. [DOI] [PMC free article] [PubMed] [Google Scholar]
- 19. Wong GS, Lee JS, Park YY, et al. Periostin cooperates with mutant p53 to mediate invasion through the induction of STAT1 signaling in the esophageal tumor microenvironment. Oncogenesis. 2013;2(8):e59. [DOI] [PMC free article] [PubMed] [Google Scholar]
- 20. Malanchi I, Santamaria‐Martínez A, Susanto E, et al. Interactions between cancer stem cells and their niche govern metastatic colonization. Nature. 2011;481(7379):85‐89. [DOI] [PubMed] [Google Scholar]
- 21. Wang Z, Ouyang G. Periostin: a bridge between cancer stem cells and their metastatic niche. Cell Stem Cell. 2012;10(2):111‐112. [DOI] [PubMed] [Google Scholar]
- 22. Shimazaki M, Kudo A. Impaired capsule formation of tumors in periostin‐null mice. Biochem Biophys Res Commun. 2008;367(4):736‐742. [DOI] [PubMed] [Google Scholar]
- 23. Nieto MA, Huang RY, Jackson RA, Thiery JP. Emt: 2016. Cell. 2016;166(1):21‐45. [DOI] [PubMed] [Google Scholar]
- 24. Thiery JP, Acloque H, Huang RY, Nieto MA. Epithelial mesenchymal transitions in development and disease. Cell. 2009;139(5):871‐890. [DOI] [PubMed] [Google Scholar]
- 25. Shibue T, Weinberg RA. EMT, CSCs, and drug resistance: the mechanistic link and clinical implications. Nat Rev Clin Oncol. 2017;14(10):611‐629. [DOI] [PMC free article] [PubMed] [Google Scholar]
- 26. Pastushenko I, Brisebarre A, Sifrim A, et al. Identification of the tumour transition states occurring during EMT. Nature. 2018;556(7702):463‐468. [DOI] [PubMed] [Google Scholar]
- 27. Pastushenko I, Blanpain C. EMT transition states during tumor progression and metastasis. Trends Cell Biol. 2019;29(3):212‐226. [DOI] [PubMed] [Google Scholar]
- 28. Yang J, Antin P, Berx G, et al. Guidelines and definitions for research on epithelial–mesenchymal transition. Nat Rev Mol Cell Biol. 2020;21(6):341‐352. [DOI] [PMC free article] [PubMed] [Google Scholar]
- 29. Nieto MA. Context‐specific roles of EMT programmes in cancer cell dissemination. Nat Cell Biol. 2017;19(5):416‐418. [DOI] [PubMed] [Google Scholar]
- 30. Furuya S, Endo K, Takahashi A, Miyazawa K, Saitoh M. Snail suppresses cellular senescence and promotes fibroblast‐led cancer cell invasion. FEBS Open Biol. 2017;7(10):1586‐1597. [DOI] [PMC free article] [PubMed] [Google Scholar]
- 31. Puram SV, Tirosh I, Parikh AS, et al. Single‐cell transcriptomic analysis of primary and metastatic tumor ecosystems in head and neck cancer. Cell. 2017;171(7):1611.e24‐1624.e24. [DOI] [PMC free article] [PubMed] [Google Scholar]
- 32. Shimazaki M, Nakamura K, Kii I, et al. Periostin is essential for cardiac healing after acute myocardial infarction. J Exp Med. 2008;205(2):295‐303. [DOI] [PMC free article] [PubMed] [Google Scholar]
- 33. Takayama I, Kudo A. Periostin in dental science. Jpn Dent Sci Rev. 2012;48(2):92‐98. [Google Scholar]
- 34. Yokoyama K, Kamata N, Hayashi E, et al. Reverse correlation of E‐cadherin and snail expression in oral squamous cell carcinoma cells in vitro. Oral Oncol. 2001;37(1):65‐71. [DOI] [PubMed] [Google Scholar]
- 35. Jung T, Shauer U, Heusser C, Neumann C, Rieger C. Detection of intracellular cytokines by flow cytometry. J Immunol Methods. 1993;159(1–2):197‐207. [DOI] [PubMed] [Google Scholar]
- 36. Sander B, Anderson J, Anderson U. Assessment of cytokines by immunofluorescence and the paraformaldehyde‐saponin procedure. Immunol Rev. 1991;119:65‐93. [DOI] [PubMed] [Google Scholar]
- 37. Conway SJ, Izuhara K, Kudo Y, et al. The role of periostin in tissue remodeling across health and disease. Cell Mol Life Sci. 2014;71(7):1279‐1288. [DOI] [PMC free article] [PubMed] [Google Scholar]
- 38. Satija R, Farrell JA, Gennert D, Schier AF, Regev A. Spatial reconstruction of single‐cell gene expression data. Nat Biotechnol. 2015;33(5):495‐502. [DOI] [PMC free article] [PubMed] [Google Scholar]
- 39. Nguyen PT, Kudo Y, Yoshida M, Kamata N, Ogawa I, Takata T. N‐cadherin expression is involved in malignant behavior of head and neck cancer in relation to epithelial‐mesenchymal transition. Histol Histopathol. 2011;26(2):147‐156. [DOI] [PubMed] [Google Scholar]
- 40. Bai Y, Nakamura M, Zhou G, et al. Novel isoforms of Periostin expressed in the human thyroid. Jpn Clin Med. 2010;1:13‐20. [DOI] [PMC free article] [PubMed] [Google Scholar]
- 41. Skonier J, Neubauer M, Madisen L, Bennett K, Plowman GD, Purchio AF. cDNA cloning and sequence analysis of ßig‐h3, a novel gene induced in a human adenocarcinoma cell line after treatment with transforming growth factor‐ß. DNA Cell Biol. 1992;11(7):511‐522. [DOI] [PubMed] [Google Scholar]
- 42. Yamada S, Tauchi T, Awata T, et al. Characterization of a novel periodontal ligament‐specific periostin isoform. J Dent Res. 2014;93(9):891‐897. [DOI] [PMC free article] [PubMed] [Google Scholar]
- 43. Morra L, Rechsteiner M, Casagrande S, et al. Relevance of Periostin splice variants in renal cell carcinoma. Am J Pathol. 2011;179(3):1513‐1521. [DOI] [PMC free article] [PubMed] [Google Scholar]
- 44. Morra L, Rechsteiner M, Casagrande S, et al. Characterization of periostin isoform pattern in non‐small cell lung cancer. Lung Cancer. 2012;76(2):183‐190. [DOI] [PubMed] [Google Scholar]
- 45. Kim CL, Isono T, Tambe Y, et al. Role of alternative splicing of periostin in human bladder carcinogenesis. Int J Oncol. 2008;32(1):161‐169. [PubMed] [Google Scholar]
- 46. Gillan L, Matei D, Fishman DA, Gerbin CS, Karlan BY, Chang DD. Periostin secreted by epithelial ovarian carcinoma is a ligand for alpha (V)beta (3) and alpha (V)beta (5) integrins and promotes cell motility. Cancer Res. 2002;62(18):5358‐5364. [PubMed] [Google Scholar]
- 47. Baril P, Gangeswaran R, Mahon PC, et al. Periostin promotes invasiveness and resistance of pancreatic cancer cells to hypoxia‐induced cell death: role of the beta4 integrin and the PI3k pathway. Oncogene. 2007;26(14):2082‐2094. [DOI] [PubMed] [Google Scholar]
- 48. Ma H, Wang J, Zhao X, et al. Periostin promotes colorectal tumorigenesis through integrin‐FAK‐Src pathway‐mediated YAP/TAZ activation. Cell Rep. 2020;30(3):793.e6‐806.e6. [DOI] [PubMed] [Google Scholar]
- 49. Missirlis D, Haraszti T, CvC S, et al. Substrate engagement of integrins α5β1 and αvβ3 is necessary, but not sufficient, for high directional persistence in migration on fibronectin. Sci Rep. 2016;6:23258. [DOI] [PMC free article] [PubMed] [Google Scholar]
- 50. Fujita M, Davari P, Takada YK, Takada Y. Stromal cell‐derived factor‐1 (CXCL12) activates integrins by direct binding to an allosteric ligand‐binding site (site 2) of integrins without CXCR4. Biochem J. 2018;475(4):723‐732. [DOI] [PMC free article] [PubMed] [Google Scholar]
- 51. Kariya Y, Oyama M, Suzuki T, Kariya Y. αvß3 integrin induces partial EMT independent of TGF‐β signaling. Commun Biol. 2021;4(1):490. [DOI] [PMC free article] [PubMed] [Google Scholar]
- 52. Horiguchi K, Sakamoto K, Koinuma D, et al. TGF‐β drives epithelial‐mesenchymal transition through 𝛅EF1‐mediated downregulation of ESRP. Oncogene. 2012;31(26):3190‐3201. [DOI] [PMC free article] [PubMed] [Google Scholar]
- 53. Warzecha CC, Sato TK, Nabet B, Hogenesch JB, Carstens RP. ESRP1 and ESRP2 are epithelial cell‐type‐specific regulators of FGFR2 splicing. Mol Cell. 2009;33(5):591‐601. [DOI] [PMC free article] [PubMed] [Google Scholar]
- 54. Feng Y, Tang X, Li C, et al. ARID1A is a prognostic biomarker and associated with immune infiltrates in hepatocellular carcinoma. Can J Gastroenterol Hepatol. 2022;2022:3163955. [DOI] [PMC free article] [PubMed] [Google Scholar]
- 55. Lu L, Hu Y, Wang C, Jiang F, Wu C. Methylation and expression of the exercise‐related TLR1 gene is associated with low grade glioma prognosis and outcome. Front Mol Biosci. 2021;8:747933. [DOI] [PMC free article] [PubMed] [Google Scholar]
Associated Data
This section collects any data citations, data availability statements, or supplementary materials included in this article.
Supplementary Materials
Figure S1–S2.


