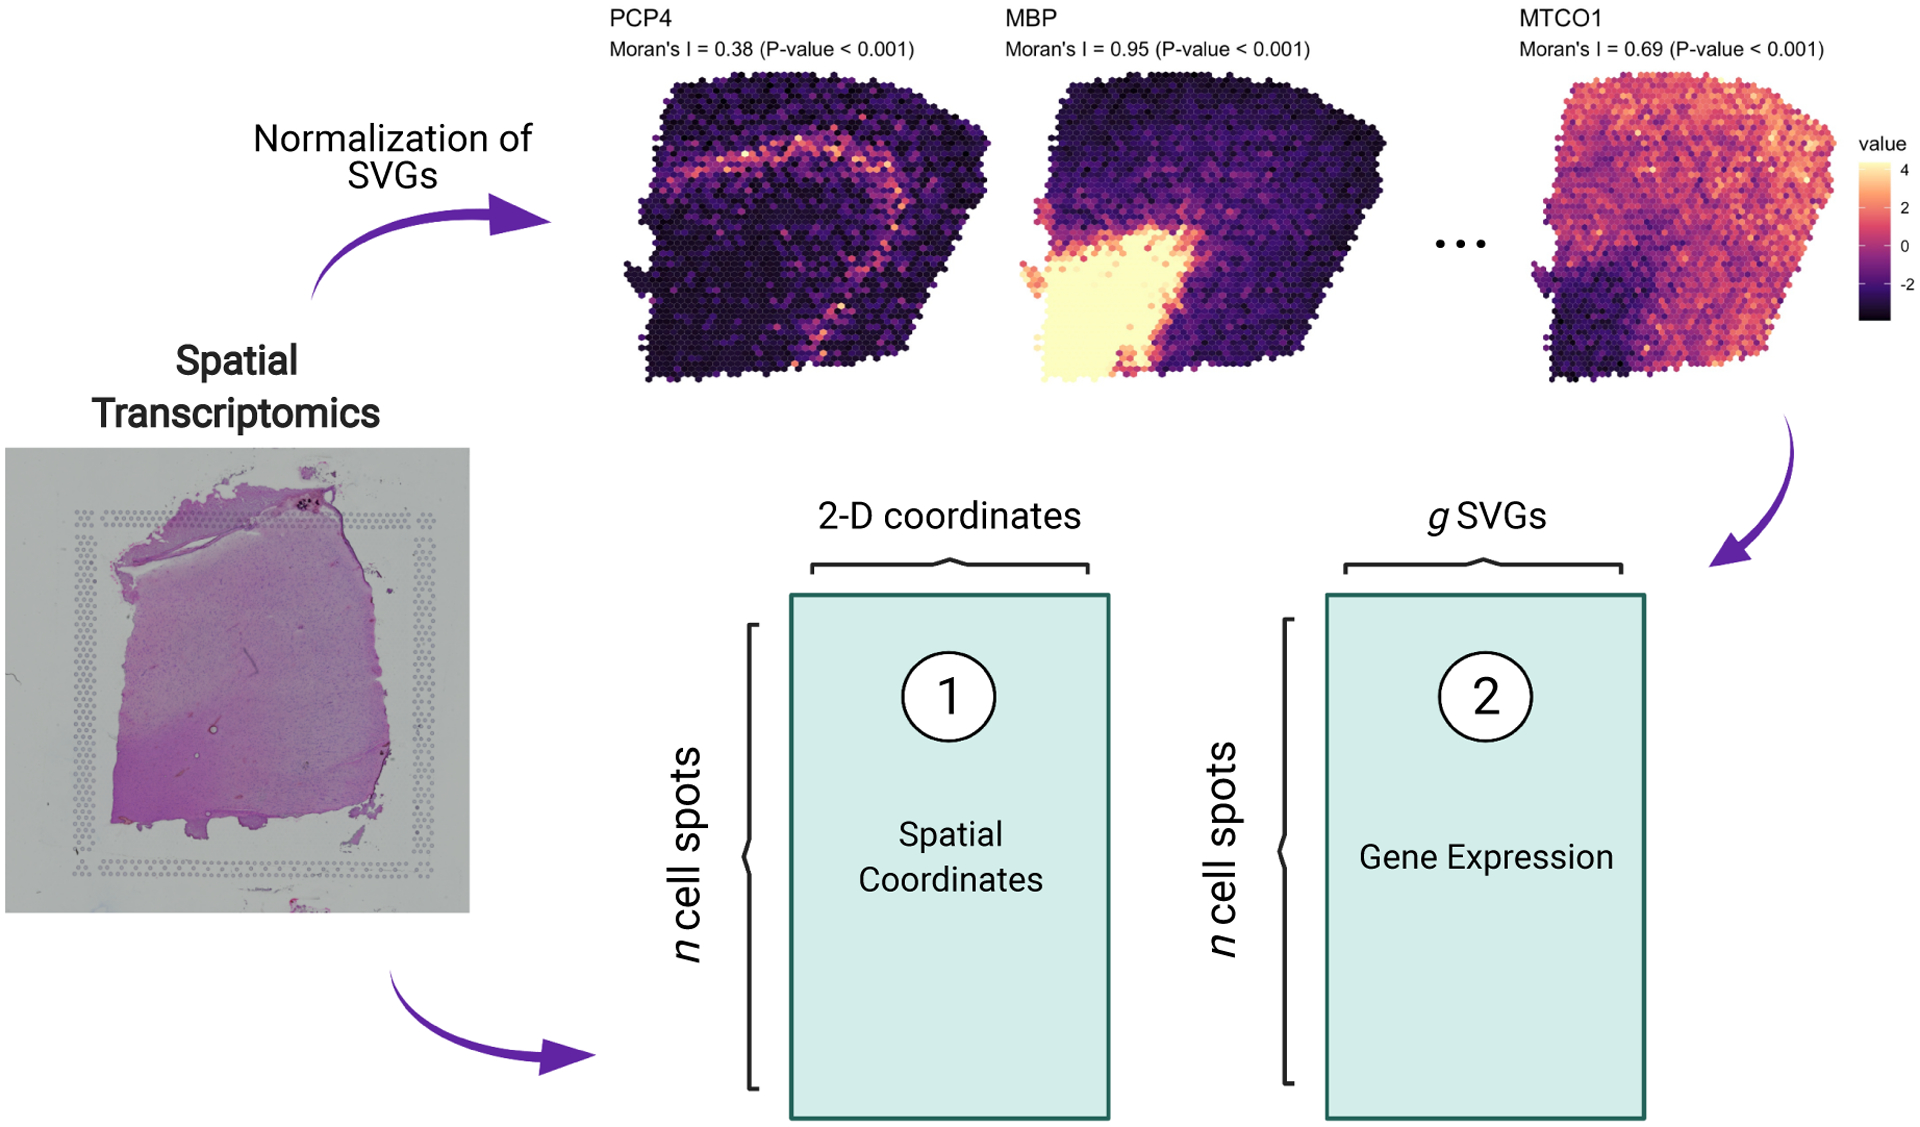
Figure 1.

Graphical illustration of the key data structures obtained by HST data. Tissue samples are processed to derive (1) an cell spot coordinate matrix and (2) an expression matrix where columns are spatially variable genes (SVGs) and rows are cell spots.
