

Abstract

Adeno-associated virus (AAV) is showing promise as a therapy for diseases that contain a single-gene deletion or mutation. One major scale-up challenge is the removal of empty or non-gene of interest containing AAV capsids. Analytically, the empty capsids can be separated from full capsids using anion exchange chromatography. However, when scaled up to manufacturing, the minute changes in conductivity are difficult to consistently obtain. To better understand the differences in the empty and full AAV capsids, we have developed a single-particle atomic force microscopy (AFM) method to measure the differences in the charge and hydrophobicity of AAV capsids at the single-particle level. The atomic force microscope tip was functionalized with either a charged or a hydrophobic molecule, and the adhesion force between the functionalized atomic force microscope tip and the virus was measured. We measured a change in the charge and hydrophobicity between empty and full AAV2 and AAV8 capsids. The charge and hydrophobicity differences between AAV2 and AAV8 are related to the distribution of charge on the surface and not the total charge. We propose that the presence of nucleic acids inside the capsid causes minor but measurable changes in the capsid structure that lead to measurable surface changes in charge and hydrophobicity.
Introduction
Adeno-associated virus (AAV) is becoming a popular choice for single-gene deletion or mutation therapy. The large variety of serotypes have many different tissue tropisms, providing a broad range of applications for these vectors. AAV biology is relatively simple compared to other viruses, since the vector can only hold a small genome of about 4.7 kbp. Several AAV products have successfully found their way to the market and hundreds more are currently in clinical trials. However, manufacturing large amounts of therapeutic products remains a key challenge. There are analytical,1 packaging,2 and separation3 challenges. Only through sustained and creative solutions to these challenges will AAV become the breakthrough cure that many desire.
AAV is extremely inefficient at packaging its genome. As many as 80% of the capsids formed may not have the gene of interest (GOI) packaged inside.4 This is likely due to the stochastic nature of AAV capsid assembly and packaging. The empty-to-full capsid ratio for gene therapies is often determined by comparing GOI to capsid content using PCR and ELISA, respectively, but both assays suffer from high variability.5 Digital drop PCR lowers the variability in the GOI measurement, but it is not yet viable for production. Other methods that characterize the empty and full AAV capsid content include analytical ultracentrifugation (AUC) and transmission electron microscopy (TEM).6 A mass spectrometry method recently showed that when the GOI is not packaged, heterogeneous DNA can be packaged instead.7 Regardless of whether the GOI, nothing, or heterogeneous DNA is packaged inside of the AAV capsid, AAV is dosed by the GOI amount. Therefore, empty or extraneous packaged DNA can cause immunogenicity issues when AAV is given in high doses.1,8 Minimizing empty capsids during the packaging stage is a high priority for AAV manufacturing, but separating empty and full capsids remains a challenge.9
Traditionally, ultracentrifugation has been used to separate empty and full capsids by density.10 However, this method is not easily scaled in manufacturing to produce large amounts of drug substance. Anion exchange chromatography is currently the most popular method to separate empty and full AAV.11,12 While it works well at the analytical scale, achieving the necessary separation at a manufacturing scale can be challenging. The main issue is that chromatography beads are highly diffusion controlled, and the diffusion of large AAVs in the beads is extremely slow and completely excluded from the interior of the chromatographic beads. Even with low binding capacity of AAVs to chromatography resins, an isocratic elution method has been developed with careful selection of salts to remove empty capsids and enrich full AAV capsids,3 which may pave the way for more manufacture-friendly separations.
What changes between empty and full capsids could create differences that allow for the separation of empty and full capsids by charge? One hypothesis is that the large charge density of nucleic acids inside of the capsid would create a change on the outside of the capsid.13 However, the dipole moment of proteins, which form the capsid, is very low;14 therefore, this transfer of charge from the inside to the outside of the capsid is unlikely. Another hypothesis is that the pressure of the genome inside of the capsid causes the capsid to expand,15 creating minute changes in structure that could change the solvent-exposed charged amino acids on the capsid. This could potentially create enough of a charge difference between empty and full capsids for analytical separation on an anion exchange column. Two recent studies have looked at the changes in empty and full capsids. Using dynamic light scattering, it was shown that empty AAV5 was larger (33 ± 0.4 nm) compared to full capsids containing the green fluorescence protein (GFP) gene (27 ± 0.3 nm).16 This suggests that the genome causes a slight collapse of the capsid, which is the opposite of the pressure theory. A recent cryogenic electron microscopy (cryo-EM) study of empty and full AAV8 capsids17 demonstrated that the genome interacted with the capsid to cause small changes in the capsid structure. While it is not completely clear why charge differences exist between empty and full AAV capsids, it does appear that the phenomenon is happening and is measurable.
We have developed a method to measure the chemical differences between individual viral particles using an atomic force microscope.18 The adhesion of a chemically modified atomic force microscope tip in buffers of different pH has been used to determine the isoelectric point of three viruses.19,20 This single-particle measurement does not require extremely pure stocks of virus when studying isoelectric points or other full population characteristics. However, when exploring distinct populations of virus, like empty and full populations, purification of the stock virus is required. Here, we use the chemically modified atomic force microscope tips to measure charge and hydrophobicity differences between empty and full AAV capsids. We also compare how force measurements may relate to virus surface chemistry. In total, the goal is to give insight into physicochemical differences that could be used to separate the capsids during manufacturing.
Materials and Methods
Materials
Sodium phosphate dibasic heptahydrate (ACS grade, 98.0–102.0%), sodium phosphate monobasic monohydrate (ACS grade, 98.0–102.0%), sodium chloride (ACS grade, ≥99.0%), 11-mercaptoundecyl-N, N,N-trimethylammonium bromide (HS(CH2)11N(CH3)3Br), Trizma base (NH2C(CH2OH)3, ≥99.8%), 12-mercaptododecanoic acid (HS (CH2)11COOH, 96%), 1-dodecanethiol (HS(CH2)11CH3, ≥98%), and 11-mercapto-1-undecanol (HS(CH2)11OH, ≥99%) were purchased from Sigma-Aldrich (St. Louis, MO). N-hydroxysulfosuccinimide (NHS), 1-ethyl-3-(3-dimethylaminopropyl) carbodiimide hydrochloride (EDC), and plain microscope slides (25 × 75 × 1 mm) were purchased from ThermoFisher Scientific (Waltham, MA). CSG10/Au probes were purchased from NT-MDT Spectrum Instruments (Moscow, Russia). Ethanol 200 proof was purchased from Decon Labs. Inc. (King of Prussia, PA). All aqueous solutions or buffers were prepared using purified water with a resistivity of ≥18 MΩ·cm from a nanopure filtration system (Thermo Scientific) and filtered using a 0.2 μm disposable bottle top filter before use. AAV2 and AAV8 empty and full capsids were purchased from Vigene Biosciences Inc., Rockville, MD. Full capsids contained the GFP gene.
Methods
Preparation of Buffers
Tris–HCl solution at pH 7 or 9 was prepared as a 20 mM solution with Trizma base. Phosphate buffer saline (PBS) solution at pH 7.2 was prepared by mixing a solution of 1.06 mM sodium phosphate monobasic, 2.97 mM sodium phosphate dibasic, and 155 mM sodium chloride. A solution of 1 M NaOH or HCl was used to adjust the acidic or basic level, and pH was measured with a calibrated Fisherbrand Accumet AE150 benchtop pH meter (Hampton, NH).
Virus Samples and Control Surface Preparation
Using a PerkinElmer Randex sputtering system (model 2400, Waltham, MA), cleaned glass slides were coated with 5 nm chromium followed by a gold layer of 35 nm. The gold-coated slides were cleaned with 100% ethanol, dried, and stored in a clean Petri dish until use. The virus particles were immobilized using the same protocol from our previous work18 with the background being 50% carboxylic acid-functionalized thiol and 50% CH3-functionalized thiol.
Control surfaces were used to confirm the probe functionalization. Hydroxyl (OH–), quaternary amine (N(CH3)3), and methyl (CH3) gold-coated glass slides were prepared by immersing gold-coated glass slides in 14 ml of 2 mM HS(CH2)11OH, 4 mM HS(CH2)11N(CH3)3Br, or 4 mM HS(CH2)11CH3 in ethanol for 24 h, respectively.
Atomic Force Microscope Probe Functionalization
Probes used for force measurements were NT-MDT CSG10/Au atomic force microscope probes (spring constant—0.1–0.5 N/m, tip radius—10 nm). The probes were functionalized at the same time and concentrations as the control surfaces described earlier and as described previously.19,20 After immersion, the probes were rinsed with ethanol, dried in a chemical hood, and placed safely in a clean atomic force microscope probe box. Functionalized probes were used within 96 h and were tested using the control gold-coated glass slides to ensure proper functionalization before use.
Force Measurements and Analysis
All hydrophobicity and charge force measurements were carried out with a Bruker Dimension ICON atomic force microscope with the ScanAsyst system (Santa Barbara, CA) using the peak force quantitative nanoscale mechanical mode (PeakForce QNM) with the respective functionalized NT-MDT CSG10/Au atomic force microscope probes. The spring constant of functionalized probes was obtained using the thermal tuning function on the atomic force microscope before use. The surface of the virus was probed with functionalized probes using PBS at pH 7.2 as the solution for hydrophobic measurements, while 20 mM Tris–HCl at pH 7 or 9 was used for the charge measurements. Between 50 and 150 force–distance (F–D) curves were obtained for each probe/sample (virus on glass slide) combination equaling an average of 150–200 F–D curves from triplicates for each condition. All experiments were performed at room temperature. Control measurements were also performed following the same procedure. Data analysis was performed using the curve analysis section of the Bruker Nanoscope Analysis software.
Computational Analysis of Capsid Structures
The residue composition and coordinates of AAV2-wt (PDB: 1lp3),21 AAV8-full (PDB: 6v10),22 and AAV8-empty (PDB: 6v12)22 were imported from the RCSB protein data bank.23 The solvent accessible surface residues (SAR) of the protein subunit exposed on the outside of the capsid were extracted from the CapsidMaps application available on the VIPERdb website (https://viperdb.scripps.edu).24,25 The residues were selected by choosing the “Surf. Out” option. The buried surface area (BSA) was noted for each residue. A python script was written to extract the charged surface residues from the capsid crystal structure. The Euclidean distance between each surface charge was calculated. A similar pathway was used to access the surface accessible hydrophobic residues and compute the distances. Each surface accessible charged/hydrophobic residue was assigned as a reference residue, and the distances were calculated from the alpha carbon of the reference residue to the alpha carbon of the other charged/hydrophobic residues in a region of increasing radius to determine the charge and hydrophobic patchiness.26 The resulting distances and regional particle counts were plotted as heatmaps using the seaborn library.
Molecular graphics and analyses were performed with UCSF ChimeraX 1.3, developed by the Resource for Biocomputing, Visualization, and Informatics at the University of California, San Francisco, with support from National Institutes of Health R01-GM129325 and the Office of Cyber Infrastructure and Computational Biology, National Institute of Allergy and Infectious Diseases.27
Statistical Analysis
Statistical analysis was performed in Excel using the built-in Data Analysis package.
Results and Discussion
This study measured the chemical differences in the surfaces of empty and full AAV capsids using force microscopy with chemically modified atomic force microscope tips. As shown in Figure 1, chemically modified atomic force microscope probe can be used to determine the adhesion force of the probe to a viral particle. On the surface, we covalently bonded viruses that are spread out enough that single-particle measurements can be obtained. This method was used to find the isoelectric point of non-enveloped and enveloped viruses.19,20 Here, we apply it to better understand the differences between empty and full AAV2 and AAV8 capsids.
Figure 1.
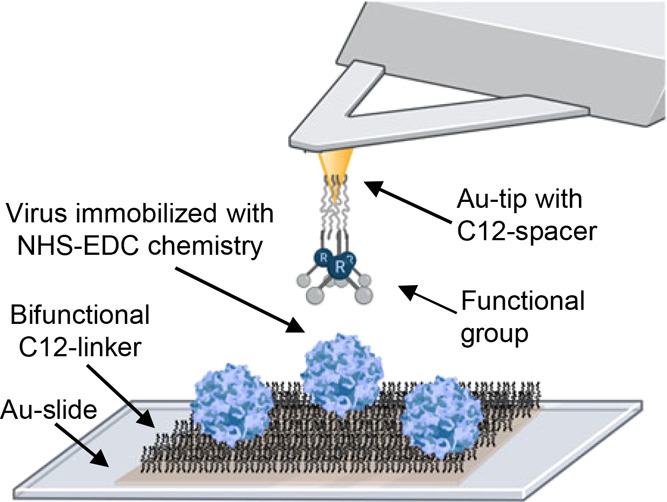
Atomic force microscope with chemically modified tips. AAV particles are covalently bound to the surface by taking a gold-coated slide, functionalizing with bifunctional thiol and carboxylic acid compounds, and using NHS-EDC chemistry to bond the virus to the surface. The atomic force microscope tip is functionalized with similar bifunctional linkers to a gold-coated tip. Adapted with permission from ref (19). Copyright 2021, The Authors under a CC-BY license.
The adhesion of AAV2 and AAV8 empty and full capsids was measured with a positively charged quaternary amine probe at low conductivity and at two different pH values. pH 7 was chosen due to it being pH neutral, and pH 9 was tested because it is a common pH for anion exchange chromatography to separate empty and full capsids. Control data to confirm tip functionalization can be found in Figure S1. Only virus particles were measured. The surface was scanned to find virus particles and then only the force on the virus particle was measured.20 Forces that were found to be between 0 and 30 nm from the surface were used.
Mean adhesion force was used to compare the data sets. The mean force calculated from the histograms in Figure 2 is shown in Table 1. At both pHs, the full AAV8 particles adhered to the positively charged probe more strongly than the empty capsids, as determined by comparing the full AAV8 in Figure 2B,D to the empty AAV8 in Figure 2F,H, respectively. The differences in mean force for AAV8 are much more pronounced at pH 7 than at pH 9. This is mainly due to the large change in adhesion force for the full AAV8 capsids between the two pHs. Higher adhesion of the full capsid is expected, as many anion exchange chromatography runs have shown that full capsids need higher ionic strength to elute from the chromatography column than empty capsids.3
Figure 2.

AAV2 and AAV8 adhesion histograms for charge measurements using an NR3+ probe in 20 mM Tris-HCl at pH 7 and 9. (A) AAV2 full capsids in pH 7, (B) AAV8 full capsids in pH 7, (C) AAV2 full capsids in pH 9, (D) AAV8 full capsids in pH 9, (E) AAV2 empty capsids in pH 7, (F) AAV8 empty capsids in pH 7, (G) AAV2 empty capsids in pH 9, and (H) AAV8 empty capsids in pH 9. > 150 F–D curves were recorded.
Table 1. Measured Mean Force Using a NR3+ Probe at pH 7 and 9a.
| capsid type | AAV2 |
AAV8 |
||||||
|---|---|---|---|---|---|---|---|---|
| mean (95% CI) | median | mode | skewness | mean (95% CI) | median | mode | skewness | |
| pH 7 | ||||||||
| full | 131 (121–141) | 122 | 80 | 0.48 | 144 (134–154) | 138 | 150 | 1.32 |
| empty | 185 (172–198) | 180 | 105 | 1.33 | 79 (75–83) | 76 | 64 | 0.72 |
| pH 9 | ||||||||
| full | 143 (133–153) | 138 | 181 | 0.86 | 164 (151–177) | 139 | 139 | 1.45 |
| empty | 165 (152–178) | 156 | 98 | 0.91 | 106 (97–115) | 89 | 136 | 1.07 |
Each data set is > 150 data points (ranges from 155 to 254). Only forces measured <30 nm were considered.
Other observations can be taken from the histograms and the insert representative F–D curves. As shown in Table 1, the skewness of all of the histograms is positive and deviates from zero. For a sample size of 150 samples (of which all of our samples were >150 samples), a skewness that deviates from an absolute value of >0.322 represents a deviation from a normal distribution.28 All of the samples skewed to the right (a positive skew value), demonstrating a tail to the higher values. In this work and our previous work,19,20 it has been noted that the larger the mean adhesion value, the larger the skewness. We think this is due to the fact that the tip and the virus are about the same size (both have a diameter of about 20 nm). A virus is located by imaging the surface, then the force measurement is taken at the coordinates of the virus location. It is possible that the force measurement could not be taken at exactly the center point of the virus, thus skewing the results.
There were also several other observations that should be noted for the approach curves. First, all of the approach curves had a snap-in as the tip approached the virus surface. A snap-in is a sudden adhesion force that occurs when the tip is very close to the surface. One approach curve is expanded in Figure S2 to show the snap-in. There is not a clear understanding of this snap-in force, but one possible explanation is the hydrophobic attraction29 or surface energy.30 Interestingly, this is seen with the positively charged probes, as well as the hydrophobic probes. Without the high snap-in, approach curves can be fit to modified DLVO theory models to understand the hydrophobic repulsion between the surface of the virus particle and the atomic force microscope tip.31 Finally, there is also hysteresis seen in the approach and retraction curves. This could be due to using too high of an approach and retraction rate.30
AAV2 showed different trends. At both pHs, the empty capsid had a higher mean adhesion than the full capsids (comparing Figures 2A,E,C, and G and data in Table 1). There is not a clear trend in how pH affects capsid adhesion. For AAV8, the mean adhesion of the full virions dropped when moving from pH 7 to pH 9, but the mean of the empty virion adhesion slightly increased. For AAV2, again the opposite was observed. In both cases, the virus particle with the highest adhesion (empty or full) decreased with an increase in pH, and the lower adhesion particle increased adhesion with a decrease in pH. The skewness, snap-in force, and hysteresis were all observed and similar to AAV8.
The adhesion force was also measured for a methyl probe in PBS at pH 7.2 to measure the hydrophobic differences between the virus particles. The same trends developed with the positively charged probe were found with the hydrophobic probe. For AAV2, the empty capsids had a stronger mean hydrophobic adhesion than the full capsids (Figure 3A,C and Table 2) and for AAV8, the full capsids had a stronger mean adhesion than the empty capsids (Figure 3B,D and Table 2). Three of the four sets of data represented a normal distribution, with a skewness in the range of −0.322 and 0.322. Only the empty AAV2 had a negative skewness, which was not seen in the charged probe.
Figure 3.
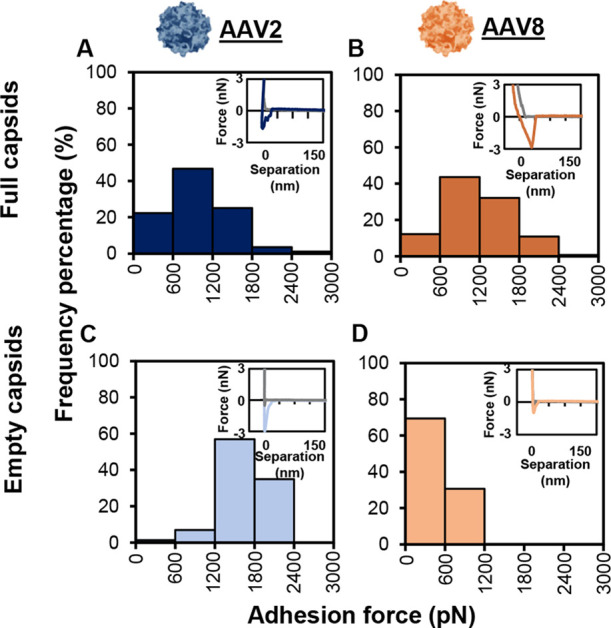
Adhesion histograms for hydrophobicity measurements in PBS, pH 7.2. (A) AAV2 full capsids, (B) AAV8 full capsids, (C) AAV2 empty capsids, and (D) AAV8 empty capsids. ≥ 300 F–D curves were recorded.
Table 2. Measured Mean Force Using CH3 Probe at pH 7.2a.
| AAV2 |
AAV8 |
|||||||
|---|---|---|---|---|---|---|---|---|
| capsid type | mean (95% CI) | median | mode | skewness | mean (95% CI) | median | mode | skewness |
| Full | 767 (726–801) | 772 | 594 | –0.07 | 1093 (1048–1138) | 1069 | 698 | 0.26 |
| Empty | 1637 (1602–1672) | 1674 | 1609 | –1.22 | 499 (477–521) | 468 | 461 | 0.22 |
Each data set is > 300 data points (ranges from 300 to 420). Only forces measured <30 nm were considered.
The overall magnitude of the adhesion appeared to be higher for the hydrophobic probe than for the charged probe. Other data have shown that parvoviruses are more hydrophobic than proteins32 and may confirm that AAV has a high hydrophobicity. It has also been shown that hydrophobic interaction chromatography often leads to viruses irreversibly sticking to the resins,33 also supporting the theory that viral capsids are highly hydrophobic. However, elution conditions were found to elute AAV8 from a hydrophobic phenyl resin.34 It is possible that different results would be found if the experiment was repeated with a phenyl-modified probe.
To better understand how the force measurements related to actual virus surface chemistry, we analyzed crystal structures of AAV2 and AAV8 and compared them to our force measurements. AAV2 was created from a crystal structure and mapped to canine parvovirus,21 thus likely being more representative of a full capsid. AAV8 was created from a cryo-EM map of empty and full capsids separately.17 The structures shown in Figure 4 are for full capsids.
Figure 4.

Crystal structure showing electrostatic and hydrophobic patches. (A) AAV2 charged surface residues, (B) AAV8 charged surface residues, (C) AAV2 hydrophobic surface residues, and (D) AAV8 hydrophobic surface residues. The residue index is the residue number in the PDB, but only charged or hydrophobic residues found on the surface are shown. Images were made in ChimeraX 1.3 with AAV 2, PBD ID: 1lp3, AAV8 Full capsids, PDB ID:6v10, AAV8 empty capsids, PDB ID:6v12 (not shown).
Capsid surface charge was analyzed by extracting only the charged surface accessible residues. The distance between all of the charged surface residues was calculated and can be found in Figure S3. AAV2 has more surface charges than AAV8, as only surface charges are shown in Figure 4A,B and in Table 3. The center column shows the distance between surface accessible charges on the surface of viral protein 3 (VP3). The right column shows the number of charges at different radii from each charged residue. This was done by assuming that the charged residue was a point charge that resided at the alpha carbon of the amino acid. Circles of different radii were drawn around the charged residue, and the number of point charges that occupied the surface of the virus was counted. Focusing on relatively close residues (a radius of 8–20 Å in the right column), AAV2 has distinct patches of charge, whereas the charge appears to be more distributed across the virus capsid for AAV8. Interestingly, in the middle column, both AAV2 and AAV8 have one negative and two positive charges that are far from other residues. In the case of AAV2, it is Glu 185, Arg 448, and Arg 451, and for AAV8, it is Glu 330, Lys 623, and Lys 643 (Figure S3). Negative residues in AAV2 have a large amount of positive charge surrounding them, likely nullifying the charge effectiveness of the patch, compared to AAV8 (Figure S3). Another observation is that the charged residues are different in each serotype. AAV2 has arginines on the surface, while AAV8 has lysines. While the total number of charges is higher for AAV2 than AAV8, the ratio of negative to positive charges is approximately the same, as shown in Table 3.
Table 3. Surface Charge for AAV2 and AAV8.
| serotype | - surface charges | + surface charges | Total surface charges | ratio (–/+) |
|---|---|---|---|---|
| AAV2 | 13 | 8 | 21 | 1.63 |
| AAV8 | 8 | 5 | 13 | 1.60 |
Knowing that the structures used to create Figure 4 were full capsids, these data can be compared to the full capsids in Figure 2A–D and Table 1. AAV8 has a stronger adhesion than AAV2 to a positive probe at both pHs studied. This is likely due to the more distributed charge on the surface of AAV8. This is shown qualitatively in Figure 5. The atomic force microscope probe used here is ∼20 nm in diameter. At this size, the more distributed charges on AAV8 adhere to more positively charged molecules on the probe than do the more concentrated charges on AAV2. Also, AAV2 has a lot more positive charges that could repel the positively charged probe, although the ratio of negative to positive charges is the same for AAV2 and AAV8 (Table 3).
Figure 5.
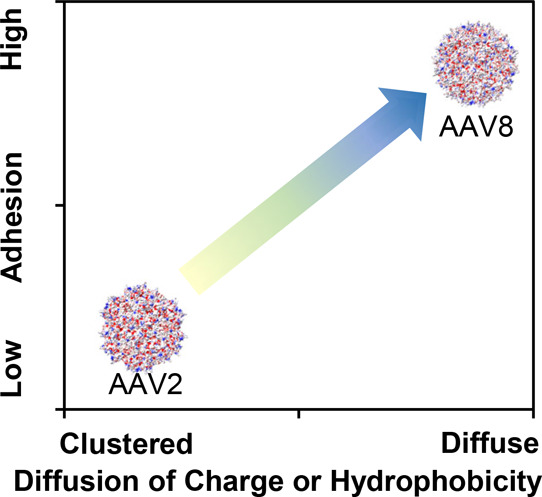
Qualitative comparison of force data and surface charge or hydrophobicity distribution at pH 7.
The same analysis can be done for the hydrophobicity of the two different virus capsids. AAV8 has more hydrophobic residues on its surface than AAV2, as shown in Figure 4C,D. The distribution of the hydrophobic residues is even across the capsid for AAV8 and is more concentrated for AAV2. There is a cluster of Val 216, Ala 527, and Ala 530 on AAV2 that is not found on AAV8. The full hydrophobicity difference between AAV2 and AAV8 measured by force microscopy again shows that the more distributed hydrophobicity of AAV8 shows a higher adhesion to the hydrophobic probe than does the more concentrated AAV2, as shown in Figure 3 and Table 2. AAV8 also has an Ile, the most hydrophobic amino acid, on its surface, as well as two Trp. Neither of these amino acids are found on the surface of AAV2.
Crystal structures were determined for empty and full AAV8 capsids,17 thus providing a new look into differences in these capsid structures. The changes in the BSA for amino acids found on the surface with a BSA less than 60 are shown in Figure 6. A BSA of zero means that the amino acid is fully surface exposed. For the one positive Lys 623, there was no change in the BSA for the empty and the full capsids (Figure 6A). There was a change for three amino acids. Glu 330 had a higher BSA for the empty capsid, meaning it was buried more, whereas Asp 714 and Glu 720 were more exposed in the empty capsid than the full. These minor changes do not correlate with the force microscopy data that shows a drop in adhesion to a positively charged probe when going from full AAV8 to empty AAV8. There was a lot less change in the hydrophobic amino acid surface exposure, as shown in Figure 6B. This data does not correlate well with the force microscopy data on the changes in hydrophobicity between empty and full capsids either. More work is needed to understand why the changes in hydrophobicity and charge are observed.
Figure 6.
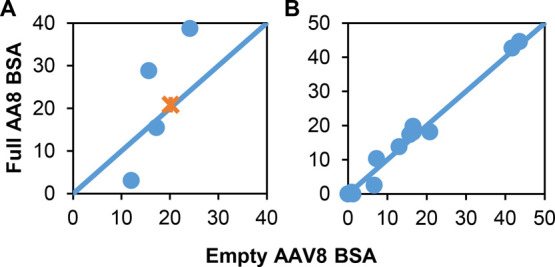
Comparison of surface amino acids on AAV8. (A) AAV8 changes in the buried surface area (BSA) for electrostatic amino acids. Orange symbol is the positive amino acids, and blue symbols are the negative amino acids (B) AAV8 changes in the BSA for hydrophobic amino acids. AAV8 Full capsids, PDB ID:6v10, AAV8 empty capsids, PDB ID:6v12.
Conclusions
The separation of empty and full AAV capsids is possible based on differences in charge. However, there are different theories on what has the biggest influence on capsid charge and why different serotypes that are fully packaged or empty have different charges. Here, we show experimentally that we can measure changes in the charge between empty and full AAV2 and AAV8 capsids using force microscopy with chemically modified atomic force microscope tips. AAV2 empty capsids have a stronger adhesion to the positively charged probe than the full capsids, and the opposite was seen with AAV8. The adhesion to a hydrophobic probe showed similar trends. To better understand what the force data is telling us about the virus surface chemistry, the data was compared to published crystal structures of AAV2 and AAV8. It appears that AAV2 has more clusters of charges on its surface, while AAV8 has less overall charge, but it is more distributed. Just comparing full particles, the more distributed charges have a higher adhesion to the positive probe, and this correlates with experimental results. The same is true for hydrophobicity. However, the differences found in the AAV8 empty and full capsids from published crystal structures do not correlate with the differences found experimentally with force microscopy for capsid charge or hydrophobicity. While differences in charge and hydrophobicity can be measured experimentally and shown by ion exchange and hydrophobic interaction chromatography, there is still more work to be done to understand the source of these adsorption changes.
Acknowledgments
The authors acknowledge Pfizer, NSF (CAREER-1451959), and NIH R21AI150962 for funding of this work. The content is solely the responsibility of the authors and does not necessarily represent the official views of the funders. The authors also appreciate discussions with Dr. Sarah Perry at University of Massachusetts Amherst on the patch analysis of viral capsids, assistance with the AFM by Dr. Fei Long at Michigan Tech, and assistance responding to reviews by Seth Kriz at Michigan Tech.
Supporting Information Available
The Supporting Information is available free of charge at https://pubs.acs.org/doi/10.1021/acs.langmuir.2c02643.
Control experiments for the atomic force microscope tip functionalization, an example approach curve, and additional patch analysis (PDF)
Author Contributions
C.L.H.-conceptualization, methodology, analysis, writing—original draft, writing—review and editing, supervision, project administration, and funding acquisition, O.A.-investigation, analysis, writing—review and editing, and visualization, P.U.J. - investigation, analysis, writing—review and editing, and visualization, X.M. -investigation and analysis, Y.I.-investigation, A.B.-conceptualization, project administration, writing—review and editing, and funding acquisition.
The authors declare the following competing financial interest(s): Some authors work for Pfizer.
Supplementary Material
References
- Wright J. F. Quality Control Testing, Characterization and Critical Quality Attributes of Adeno-Associated Virus Vectors Used for Human Gene Therapy. Biotechnol. J. 2021, 16, e2000022 10.1002/biot.202000022. [DOI] [PubMed] [Google Scholar]
- Galibert L.; Hyvonen A.; Eriksson R. A. E.; Mattola S.; Aho V.; Salminen S.; Albers J. D.; Peltola S. K.; Weman S.; Nieminen T.; Yla-Herttuala S.; Lesch H. P.; Vihinen-Ranta M.; Airenne K. J. Functional roles of the membrane-associated AAV protein MAAP. Sci. Rep. 2021, 11, 21698. 10.1038/s41598-021-01220-7. [DOI] [PMC free article] [PubMed] [Google Scholar]
- Dickerson R.; Argento C.; Pieracci J.; Bakhshayeshi M. Separating Empty and Full Recombinant Adeno-Associated Virus Particles Using Isocratic Anion Exchange Chromatography. Biotechnol. J. 2021, 16, e2000015 10.1002/biot.202000015. [DOI] [PubMed] [Google Scholar]
- Worner T. P.; Bennett A.; Habka S.; Snijder J.; Friese O.; Powers T.; Agbandje-McKenna M.; Heck A. J. R. Adeno-associated virus capsid assembly is divergent and stochastic. Nat. Commun. 2021, 12, 1642. 10.1038/s41467-021-21935-5. [DOI] [PMC free article] [PubMed] [Google Scholar]
- Heldt C. L. Scalable method utilizing low pH for DNA removal in the harvest of recombinant adeno-associated virus vectors. J. Chromatogr. B 2019, 1124, 173–179. 10.1016/j.jchromb.2019.06.011. [DOI] [PubMed] [Google Scholar]
- Fu X.; Chen W.-C.; Argento C.; Clarner P.; Bhatt V.; Dickerson R.; Bou-Assaf G.; Bakhshayeshi M.; Lu X.; Bergelson S.; Pieracci J. Analytical Strategies for Quantification of Adeno-Associated Virus Empty Capsids to Support Process Development. Hum. Gene Ther. Methods 2019, 30, 144–152. 10.1089/hgtb.2019.088. [DOI] [PubMed] [Google Scholar]
- Barnes L. F.; Draper B. E.; Chen Y. T.; Powers T. W.; Jarrold M. F. Quantitative analysis of genome packaging in recombinant AAV vectors by charge detection mass spectrometry. Mol. Ther.–Methods Clin. Dev. 2021, 23, 87–97. 10.1016/j.omtm.2021.08.002. [DOI] [PMC free article] [PubMed] [Google Scholar]
- Kishimoto T. K.; Samulski R. J. Addressing high dose AAV toxicity - ’one and done’ or ’slower and lower’?. Expet Opin. Biol. Ther. 2022, 22, 1067. 10.1080/14712598.2022.2060737. [DOI] [PubMed] [Google Scholar]
- Singh N.; Heldt C. L. Challenges in downstream purification of gene therapy viral vectors. Curr. Opin. Chem. Eng. 2022, 35, 100780. 10.1016/j.coche.2021.100780. [DOI] [Google Scholar]
- Grieger J. C.; Soltys S. M.; Samulski R. J. Production of Recombinant Adeno-associated Virus Vectors Using Suspension HEK293 Cells and Continuous Harvest of Vector From the Culture Media for GMP FIX and FLT1 Clinical Vector. Mol. Ther. 2016, 24, 287–297. 10.1038/mt.2015.187. [DOI] [PMC free article] [PubMed] [Google Scholar]
- Joshi P. R. H.; Bernier A.; Moco P. D.; Schrag J.; Chahal P. S.; Kamen A. Development of a scalable and robust AEX method for enriched rAAV preparations in genome-containing VCs of serotypes 5, 6, 8, and 9. Mol. Ther.–Methods Clin. Dev. 2021, 21, 341–356. 10.1016/j.omtm.2021.03.016. [DOI] [PMC free article] [PubMed] [Google Scholar]
- Qu G.; Bahr-Davidson J.; Prado J.; Tai A.; Cataniag F.; McDonnell J.; Zhou J.; Hauck B.; Luna J.; Sommer J. M.; Smith P.; Zhou S.; Colosi P.; High K. A.; Pierce G. F.; Wright J. F. Separation of adeno-associated virus type 2 empty particles from genome containing vectors by anion-exchange column chromatography. J. Virol. Methods 2007, 140, 183–192. 10.1016/j.jviromet.2006.11.019. [DOI] [PubMed] [Google Scholar]
- Hernando-Perez M.; Cartagena-Rivera A. X.; Losdorfer Bozic A.; Carrillo P. J. P.; San Martin C.; Mateu M. G.; Raman A.; Podgornik R.; de Pablo P. J. Quantitative nanoscale electrostatics of viruses. Nanoscale 2015, 7, 17289–17298. 10.1039/c5nr04274g. [DOI] [PubMed] [Google Scholar]
- Losdorfer Bozic A.; Siber A.; Podgornik R. How simple can a model of an empty viral capsid be? Charge distributions in viral capsids. J. Biol. Phys. 2012, 38, 657–671. 10.1007/s10867-012-9278-4. [DOI] [PMC free article] [PubMed] [Google Scholar]
- Buenemann M.; Lenz P. Mechanical limits of viral capsids. Proc. Natl. Acad. Sci. U.S.A. 2007, 104, 9925–9930. 10.1073/pnas.0611472104. [DOI] [PMC free article] [PubMed] [Google Scholar]
- Cole L.; Fernandes D.; Hussain M. T.; Kaszuba M.; Stenson J.; Markova N. Characterization of Recombinant Adeno-Associated Viruses (rAAVs) for Gene Therapy Using Orthogonal Techniques. Pharmaceutics 2021, 13, 586. 10.3390/pharmaceutics13040586. [DOI] [PMC free article] [PubMed] [Google Scholar]
- Mietzsch M.; Barnes C.; Hull J. A.; Chipman P.; Xie J.; Bhattacharya N.; Sousa D.; McKenna R.; Gao G.; Agbandje-McKenna M.; Sandri-Goldin R. M. Comparative Analysis of the Capsid Structures of AAVrh.10, AAVrh.39, and AAV8. J. Virol. 2020, 94, 017699. 10.1128/jvi.01769-19. [DOI] [PMC free article] [PubMed] [Google Scholar]
- Mi X.; Heldt C. L. Single-particle chemical force microscopy to characterize virus surface chemistry. BioTechniques 2020, 69, 363–370. 10.2144/btn-2020-0085. [DOI] [PubMed] [Google Scholar]
- Areo O.; Joshi P. U.; Obrenovich M.; Tayahi M.; Heldt C. L. Single-Particle Characterization of SARS-CoV-2 Isoelectric Point and Comparison to Variants of Interest. Microorganisms 2021, 9, 1606. 10.3390/microorganisms9081606. [DOI] [PMC free article] [PubMed] [Google Scholar]
- Mi X.; Bromley E. K.; Joshi P. U.; Long F.; Heldt C. L. Virus Isoelectric Point Determination Using Single-Particle Chemical Force Microscopy. Langmuir 2020, 36, 370–378. 10.1021/acs.langmuir.9b03070. [DOI] [PubMed] [Google Scholar]
- Xie Q.; Bu W.; Bhatia S.; Hare J.; Somasundaram T.; Azzi A.; Chapman M. S. The atomic structure of adeno-associated virus (AAV-2), a vector for human gene therapy. Proc. Natl. Acad. Sci. U.S.A. 2002, 99, 10405–10410. 10.1073/pnas.162250899. [DOI] [PMC free article] [PubMed] [Google Scholar]
- Mietzsch M.; Barnes C.; Hull J. A.; Chipman P.; Xie J.; Bhattacharya N.; Sousa D.; McKenna R.; Gao G.; Agbandje-McKenna M. Comparative analysis of the capsid structures of AAVrh. 10, AAVrh. 39, and AAV8. J. Virol. 2020, 94, 017699. 10.1128/jvi.01769-19. [DOI] [PMC free article] [PubMed] [Google Scholar]
- Berman H. M.; Westbrook J.; Feng Z.; Gilliland G.; Bhat T. N.; Weissig H.; Shindyalov I. N.; Bourne P. E. The Protein Data Bank. Nucleic Acids Res. 2000, 28, 235–242. 10.1093/nar/28.1.235. [DOI] [PMC free article] [PubMed] [Google Scholar]
- Carrillo-Tripp M.; Montiel-Garcia D. J.; Brooks C. L. 3rd; Reddy V. S. CapsidMaps: protein-protein interaction pattern discovery platform for the structural analysis of virus capsids using Google Maps. J. Struct. Biol. 2015, 190, 47–55. 10.1016/j.jsb.2015.02.003. [DOI] [PMC free article] [PubMed] [Google Scholar]
- Montiel-Garcia D.; Santoyo-Rivera N.; Ho P.; Carrillo-Tripp M.; Iii C. B.; Johnson J. E.; Reddy V. S. VIPERdb v3.0: a structure-based data analytics platform for viral capsids. Nucleic Acids Res. 2021, 49, D809–D816. 10.1093/nar/gkaa1096. [DOI] [PMC free article] [PubMed] [Google Scholar]
- Blocher McTigue W. C.; Perry S. L. Design rules for encapsulating proteins into complex coacervates. Soft Matter 2019, 15, 3089–3103. 10.1039/c9sm00372j. [DOI] [PubMed] [Google Scholar]
- Pettersen E. F.; Goddard T. D.; Huang C. C.; Meng E. C.; Couch G. S.; Croll T. I.; Morris J. H.; Ferrin T. E. UCSF ChimeraX: Structure visualization for researchers, educators, and developers. Protein Sci. 2021, 30, 70–82. 10.1002/pro.3943. [DOI] [PMC free article] [PubMed] [Google Scholar]
- Doane D. P.; Seward L. E.. Measuring Skewness: A Forgotten Statistic?. J. Stat. Educ. 2011, 19 ( (2), ). 10.1080/10691898.2011.1188961. [DOI] [Google Scholar]
- Garcia R. Nanomechanical mapping of soft materials with the atomic force microscope: methods, theory and applications. Chem. Soc. Rev. 2020, 49, 5850. 10.1039/D0CS00318B. [DOI] [PubMed] [Google Scholar]
- Rossi E. M.; Phani P. S.; Guillemet R.; Cholet J.; Jussey D.; Oliver W. C.; Sebastiani M. A novel nanoindentation protocol to characterize surface free energy of superhydrophobic nanopatterned materials. J. Mater. Res. 2021, 36, 2357–2370. 10.1557/s43578-021-00127-3. [DOI] [Google Scholar]
- Dorobantu L. S.; Bhattacharjee S.; Foght J. M.; Gray M. R. Analysis of force interactions between AFM tips and hydrophobic bacteria using DLVO theory. Langmuir 2009, 25, 6968–6976. 10.1021/la9001237. [DOI] [PubMed] [Google Scholar]
- Heldt C. L.; Zahid A.; Vijayaragavan K. S.; Mi X. Experimental and computational surface hydrophobicity analysis of a non-enveloped virus and proteins. Colloids Surf., B 2017, 153, 77–84. 10.1016/j.colsurfb.2017.02.011. [DOI] [PubMed] [Google Scholar]
- Johnson S. A.; Walsh A.; Brown M. R.; Lute S. C.; Roush D. J.; Burnham M. S.; Brorson K. A. The step-wise framework to design a chromatography-based hydrophobicity assay for viral particles. J. Chromatogr. B 2017, 1061–1062, 430–437. 10.1016/j.jchromb.2017.08.002. [DOI] [PubMed] [Google Scholar]
- McNally D. J.; Piras B. A.; Willis C. M.; Lockey T. D.; Meagher M. M. Development and Optimization of a Hydrophobic Interaction Chromatography-Based Method of AAV Harvest, Capture, and Recovery. Mol. Ther.–Methods Clin. Dev. 2020, 19, 275–284. 10.1016/j.omtm.2020.09.015. [DOI] [PMC free article] [PubMed] [Google Scholar]
Associated Data
This section collects any data citations, data availability statements, or supplementary materials included in this article.