Abstract
Background and Objectives
In spinocerebellar ataxia, ataxia onset can be preceded by mild clinical manifestation, cerebellar and/or brainstem alterations, or biomarker modifications. READISCA is a prospective, longitudinal observational study of patients with spinocerebellar ataxia type 1 (SCA1) and 3 (SCA3) to provide essential markers for therapeutic interventions. We looked for clinical, imaging, or biological markers that are present at an early stage of the disease.
Methods
We enrolled carriers of a pathologic ATXN1 or ATXN3 expansion and controls from 18 US and 2 European ataxia referral centers. Clinical, cognitive, quantitative motor, neuropsychological measures and plasma neurofilament light chain (NfL) measurements were compared between expansion carriers with and without ataxia and controls.
Results
We enrolled 200 participants: 45 carriers of a pathologic ATXN1 expansion (31 patients with ataxia [median Scale for the Assessment and Rating of Ataxia: 9; 7–10] and 14 expansion carriers without ataxia [1; 0–2]) and 116 carriers of a pathologic ATXN3 expansion (80 patients with ataxia [7; 6–9] and 36 expansion carriers without ataxia [1; 0–2]). In addition, we enrolled 39 controls who did not carry a pathologic expansion in ATXN1 or ATXN3. Plasma NfL levels were significantly higher in expansion carriers without ataxia than controls, despite similar mean age (controls: 5.7 pg/mL, SCA1: 18.0 pg/mL [p < 0.0001], SCA3: 19.8 pg/mL [p < 0.0001]). Expansion carriers without ataxia differed from controls by significantly more upper motor signs (SCA1 p = 0.0003, SCA3 p = 0.003) and by the presence of sensor impairment and diplopia in SCA3 (p = 0.0448 and 0.0445, respectively). Functional scales, fatigue and depression scores, swallowing difficulties, and cognitive impairment were worse in expansion carriers with ataxia than those without ataxia. Ataxic SCA3 participants showed extrapyramidal signs, urinary dysfunction, and lower motor neuron signs significantly more often than expansion carriers without ataxia.
Discussion
READISCA showed the feasibility of harmonized data acquisition in a multinational network. NfL alterations, early sensory ataxia, and corticospinal signs were quantifiable between preataxic participants and controls. Patients with ataxia differed in many parameters from controls and expansion carriers without ataxia, with a graded increase of abnormal measures from control to preataxic to ataxic cohorts.
Trial Registration Information
The READISCA study is a multinational longitudinal observational study of spinocerebellar ataxias type 1 (SCA1) and 3 (SCA3) with preataxic and early ataxic cohorts. Several prospective cohorts that include ataxic or preataxic participants exist, such as EUROSCA,1 RISCA,3,4 CRC-SCA,5 and BIGPRO,6 but READISCA is the first one to pool European and American participants with SCA. READISCA aims to compare their clinical profiles with control individuals and analyze early clinical, imaging, and blood biomarker features.
The clinical hallmark of SCAs is progressive cerebellar ataxia. The most common among the 48 autosomal, dominantly inherited disease loci are SCA1, SCA2, and SCA3. They are caused by translated unstable CAG repeat expansions in ATXN1, 2, and 3, respectively. Ataxia manifesting as gait disturbance, incoordination of upper limb movements, cerebellar eye movements, and dysarthria in SCA1 and 3 is often associated with pyramidal signs. A nonexhaustive list of other symptoms can appear during the course of the disease including ophthalmoparesis in SCA1, and dystonia and parkinsonism in SCA3.7,8,16 In SCAs with expansions of CAG repeats encoding polyglutamines, ataxia onset usually occurs at age 30–40 years for these SCAs.7,9 Individuals with longer CAG repeats have an earlier onset of ataxia, and the repeat length explains 44%–75% of the variability in age at onset.10
Ataxia onset can be preceded by mild clinical manifestations, such as diplopia in SCA3, nerve conduction abnormalities, and cerebellar and brainstem volume loss.3,11-16 This early preataxic stage is of particular interest because it could provide an intended period for preventive intervention. The optimum time of introducing neuroprotective measures to defer onset or slow the rate of disease progression is likely the preataxic stage.
A sufficient number of study participants are critical to conduct a conclusive clinical trial. Establishing large, well-characterized cohorts is particularly important because of the interindividual variability of age at onset and severity. We report here the baseline clinical and blood biomarker data from this longitudinal study with the aim of identifying the features that distinguish healthy from preataxic and early-stage disease in SCA1 and SCA3.
Methods
Patients
We report the baseline READISCA data. Participants were enrolled between 2018 and 2020, and the clinical database was locked in December 2020 after inclusion of 200 participants. Individuals with SCA1 or SCA3 were recruited from 18 US and 2 European ataxia referral centers (eAppendix 2, links.lww.com/WNL/C644). The recruitment target was 200 individuals, including 60 early-stage patients, 60 preataxic expansion carriers, 60 50% at-risk participants, and 20 patients, who had a Scale for the Assessment and Rating of Ataxia (SARA) score <10 during the previous (2009–2012) natural history study4 (previously early-stage) and additional controls according to eTable 1 (links.lww.com/WNL/C643). The sample size was guided by feasibility to enroll preataxic and very early-stage participants at these sites. Patients were eligible when they had progressive, otherwise unexplained, cerebellar ataxia and a positive molecular genetic test for a pathologic CAG repeat expansion in ATXN1 or ATXN3. Exclusion criteria were a known genotype consistent with other inherited ataxias, concomitant disorder(s) that affects assessment of presence or severity of ataxia during this study, investigational drugs taken in 2 months before participation in the study, changes in coordinative physical and occupational therapy for ataxia in 2 months before study entry, and unwillingness to provide a DNA sample at the enrollment in the study. Confirmatory genotyping for SCA1 and SCA3 was performed on blood samples obtained at the baseline visit. For 50% at-risk participants, genotyping results were released to the participant's designated physician or genetic counselor after a release of information form had been signed. Genetic counseling for the disclosure of DNA results was part of the procedure. Asymptomatic participants, who received positive DNA results, were included in the preataxic carrier group, while those with negative results were included in the control group.
Patients were categorized into 3 groups: patients with ataxia (early-stage and previously early-stage patients), preataxic participants (known preataxic SCA1 or SCA3 expansion carriers and those among the 50% at-risk individuals), and controls (controls and participants who were not expansion carriers among the 50% at-risk individuals) (Figure 1).
Figure 1. Flowchart With the Distribution of the 200 Individuals Included According to the Inclusion Target Groups, the Studied Categories, and the Genotype Groups.
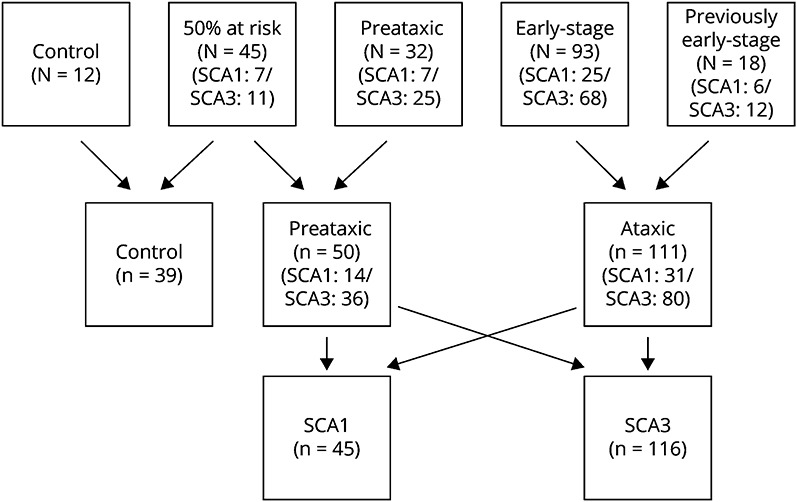
SCA1 = spinocerebellar ataxia type 1; SCA3 = spinocerebellar ataxia type 3.
The study was approved by the ethics committees of the participating centers according to the Declaration of Helsinki. Written informed consent was obtained from all study participants at enrolment. The study protocol is available online.17 The authors have received consent forms from any participant in a study and have them on file in case they are requested by the editor. The study was registered on ClinicalTrials.gov (NCT03487367).
Outcomes
For the reported age at onset, we took the earliest age at onset of any of the following symptoms: walking problems, speech problems, vision, and “other” problems. The predicted age at ataxia onset was calculated based on CAG repeat length as reported for SCA1 carriers18 and for SCA3 carriers.19 For all expansion carriers, we calculated an estimated time from onset as the difference between the age at the visit and the predicted age at ataxia onset. Negative estimated time from onset corresponds to time to onset, while positive estimated time from onset corresponds to the time from ataxia onset. A expansion carrier without ataxia can have a positive estimated time from onset if he has already exceeded his expected onset; meanwhile, a patient with ataxia can have a negative estimated time from onset if ataxia started earlier than expected. This allows aligning all expansion carriers on the same disease timeline.
We used the SARA scale to assess the presence and severity of cerebellar ataxia.20 The SARA axial value was derived from the SARA score by the sum of the gait, stance, sitting, and speech disturbance items of the SARA and SARA appendicular by the sum of the finger-chase, nose-finger test, fast alternating hand movements, and heel-shin items of the SARA. The Composite Cerebellar Functional Severity Score (CCFS) was applied.21 Extra cerebellar signs were assessed during a neurologic examination with the Inventory of Nonataxia Signs (INAS).22 The INAS list signs from neurologic examination, and additional reported symptoms (diplopia, dysphagia, urinary dysfunction, and cognitive complaint) were grouped into 16 nonataxia signs. The presence of each sign was given a score of 1, and absence a score of 0, giving a maximum number of nonataxia signs of 16. To analyze pathways, we grouped several signs: (1) upper motoneuron involvement was defined as at least 1 of these 3 items: hyperreflexia, extensor plantar reflex, and/or spasticity; (2) lower motoneuron as at least 1 of these 3 items: distal paresis, muscle atrophy, and/or fasciculations; (3) extrapyramidal as of at least 1 of these 3 items: rigidity, resting tremor, and dystonia; (4) nystagmus as of at least 1 of these 3 items: Downbeat-nystagmus, gaze-evoked nystagmus on horizontal or vertical testing; (5) ophthalmoparesis as the presence of vertical and/or horizontal gaze limitations; and (6) saccadic dysmetria as the presence of either hypometric or hypermetric saccades.
We assessed cognitive impairment with the Cerebellar Cognitive Affective Syndrome (CCAS) scale,23 fatigue with the Fatigue Severity Scale (FSS),24 and activities of daily living with the Friedreich Ataxia Activities of Daily Living (FARS-ADL) scale.25 Depressive symptoms were assessed with the Patient Health Questionnaire 9 (PHQ-9),26,27 and as a measure of health-related quality of life, we applied the EuroQol 5D (EQ-5D) questionnaire.28 For the present analysis, we used the EQ-5D visual analog scale.29
All investigators were experienced in the use of the applied scales. For the SARA score, a web-based certification was required.
Neurofilament Light Chain Measurements
We collected plasma samples on an EDTA tube anticoagulant, frozen at −80°C, and stored in the local biobank (EU), or BioSEND (biosend.org/) repository (US). Plasma neurofilament light chain (NfL) levels were measured in duplicate using an ultrasensitive single-molecule array on the Simoa HD-1 Analyzer (Quanterix), as previously established.30
Statistical Analysis
Quantitative values are expressed as median (first quartile-third quartile) and qualitative variables as frequency (%). Comparisons between controls, expansion carriers without ataxia, and patients with ataxia were performed using the Kruskal-Wallis test for quantitative variables and the χ2 test for qualitative variables. For significant differences in quantitative values, Dunn adjusted pairwise comparisons were performed. “p_CP,” “p_CA,” and “p_PA,” respectively, refer to the p value of the pairwise test of controls vs preataxics, controls vs ataxic, and preataxics vs ataxic. For significant differences in qualitative values, the 2 degrees of freedom χ2 test was performed for pairwise comparisons. For SARA comparisons, a Wilcoxon test was performed between controls and expansion carriers without ataxia only. For the INAS signs that were significantly different between controls and preataxic participants, NfL levels were compared between those with and without the sign using a Student t test. Correlations between quantitative variables were tested using Pearson correlation tests. To evaluate the agreement between the predicted and the reported age at ataxia onset among the patients with ataxia, Bland-Altman plots were created with marked 95% limits of agreement. Statistical tests were performed at the conventional 2-tailed type I error of 0.05. Data were analyzed using R version 3.4.0 (R Core Team, 2018).
Data Availability
The clinical and imaging data from READISCA are available from the NIMH Data Archive.31
Results
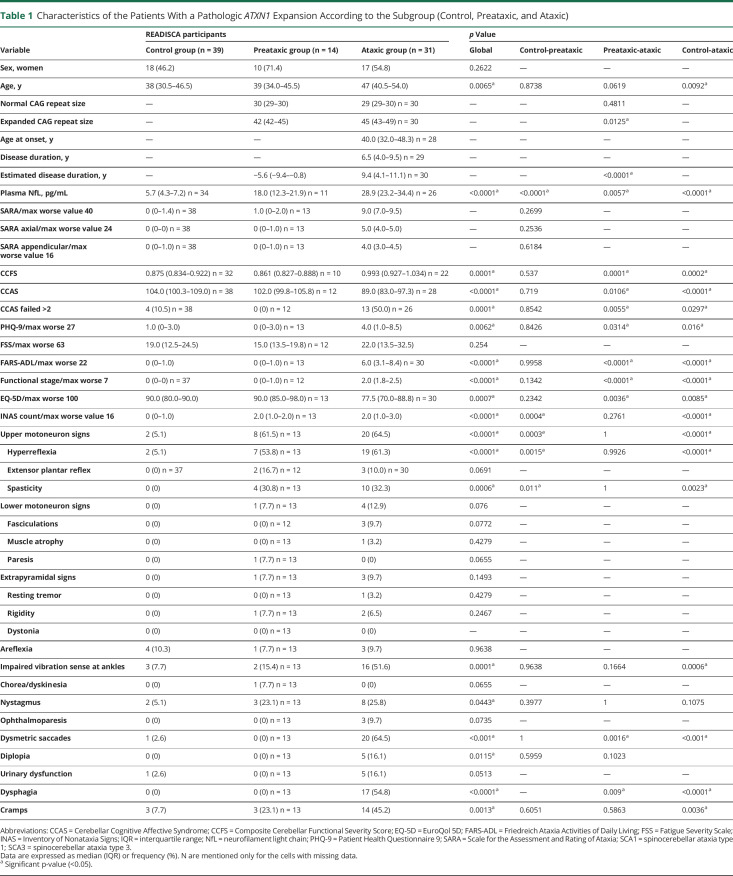
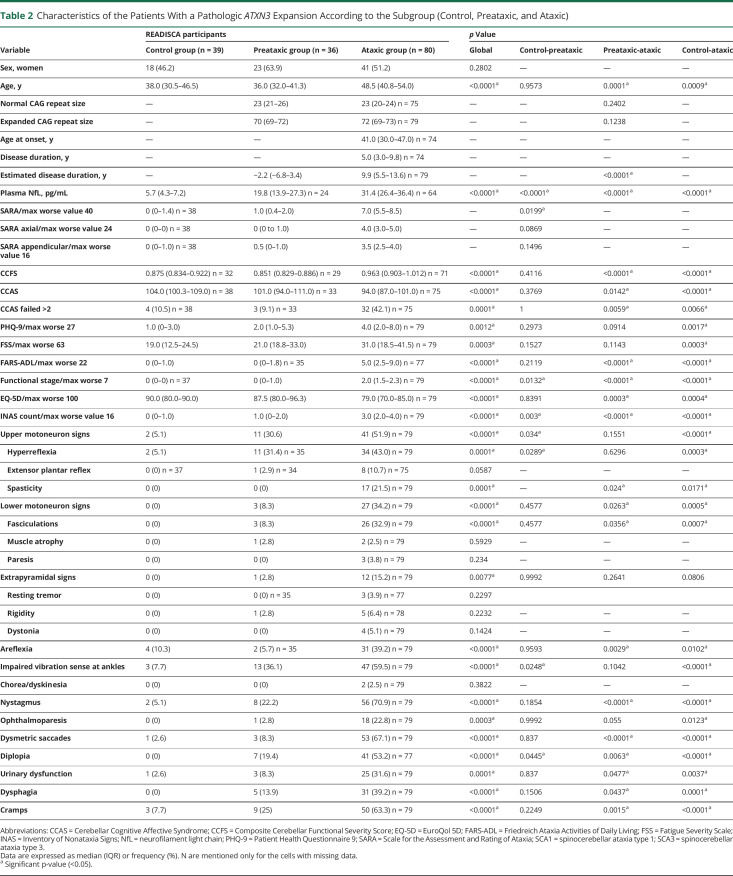
Among the 200 participants (Figure 1), 45 were carriers of a pathologic ATXN1 expansion including 31 patients with ataxia with a median SARA score: 9 (7–10) and 14 expansion carriers without ataxia with a median SARA score of 1 (0–2). There were 116 carriers of a pathologic ATXN3 expansion, including 80 patients with ataxia (SARA 7 [6–9]) and 36 expansion carriers without ataxia (SARA 1 [0–2]). In addition, among the at-risk participants, 27 did not carry a pathologic expansion in ATXN1 or ATXN3 (0 [0–1]) (Tables 1 and 2). One hundred fifty-five participants were included in the United States, 25 in France, and 20 in Germany. The characteristics at baseline were comparable regarding age, sex, age at onset, expanded CAG repeat length, and SARA (eTable 2, links.lww.com/WNL/C643).
Table 1.
Characteristics of the Patients With a Pathologic ATXN1 Expansion According to the Subgroup (Control, Preataxic, and Ataxic)
Table 2.
Characteristics of the Patients With a Pathologic ATXN3 Expansion According to the Subgroup (Control, Preataxic, and Ataxic)
Comparisons Between Controls, Expansion Carriers With and Without Ataxia
For both groups, patients with ataxia were older (SCA1 median: 47 [41–54], SCA3: 49 [41–54]) than both the preataxic participants (SCA1: 39 [34–46], p_PA = 0.0619; SCA3: 36 [32–41], p_PA = 0.0001) and the controls (38 [31–47], SCA1: p_CA = 0.0092, SCA3: p_CA = 0.0009) (Tables 1 and 2). As expected, they had significantly more severe cerebellar and functional scores than expansion carriers without ataxia.
It is of interest that extracerebellar signs were already present in expansion carriers without ataxia with an INAS count significantly higher in expansion carriers without ataxia than in controls for both SCAs (p = 0.0004 for SCA1 and p = 0.003 for SCA3). Expansion carriers without ataxia had significantly more upper motoneuron involvement, mainly hyperreflexia, than the controls (SCA1: p = 0.0003, Figure 2A, SCA3: p = 0.034, Figure 2C). Hyperreflexia was already present in 61% of the preataxic SCA1 and in 31% of the preataxic SCA3 individuals (Tables 1 and 2). Even spasticity at gait was already observed in 31% of the preataxic SCA1 participants. In addition to the corticospinal signs, SCA3 expansion carriers without ataxia showed significantly more impaired posterior column signs indicating the presence of afferent deficit occurring before cerebellar ataxia (36% preataxic patients with decreased vibration sense at ankles, p = 0.0248).
Figure 2. Distribution of Significantly Different Signs.
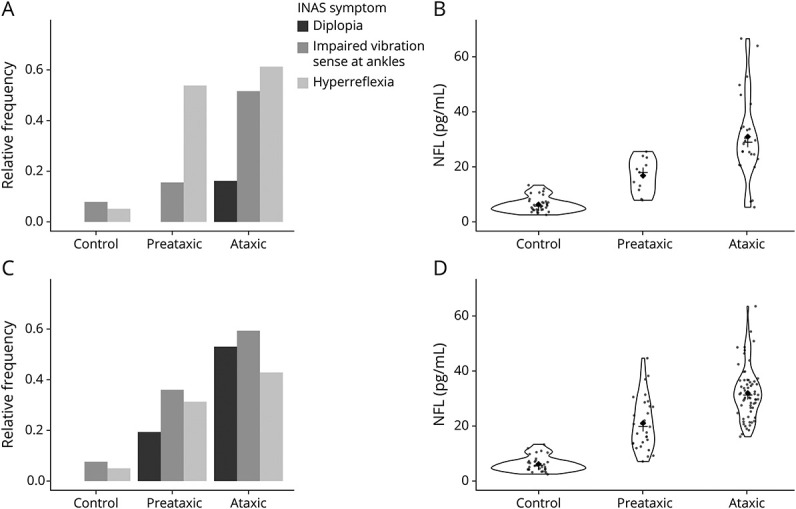
Hyperreflexia (light gray), diplopia (black), and impaired vibration sense at ankle (gray) (panels A and C) and NfL levels (panels B and D) among controls, preataxic and ataxic carriers with a pathologic ATXN1 (panels A and B) and ATXN3 (panels C and D) expansion. INAS = Inventory of Nonataxia Signs; NfL = neurofilament light chain.
Ataxic stages were predominated by upper motor neuron disease and decreased vibration sense as well as cognitive signs on CCAS in addition to cerebellar ataxia in SCA1. SCA3 ataxic individuals had a more diffuse disease, with upper and lower motor neuron, as well as extrapyramidal and oculomotor signs being significantly more frequent compared with controls and preataxic participants. After adjustment for the expanded CAG repeat length, the differences between expansion carriers without ataxia and with ataxia remain similar. In both groups, patients with ataxia had higher PHQ-9 and FARS-ADL scores than controls, while the scores of fatigue and quality of life were significantly higher (worse) in SCA3 but not in SCA1, probably explained by more urinary dysfunction and dysphagia in SCA3 patients with ataxia.
Estimated Age at Onset and Time From Onset
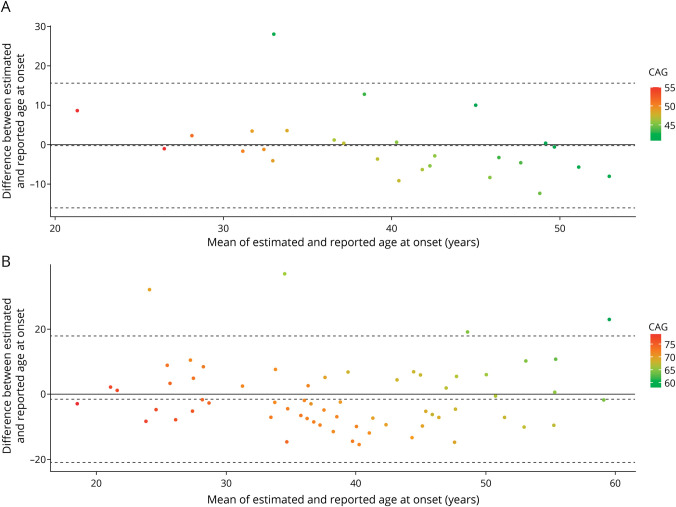
Based on the formulas by Tezenas et al. (SCA1) and Peng et al. (SCA3), the estimated age at onset was derived from the CAG repeats. It explained 42% of the reported age at onset variance for SCA1 and 33% for SCA3. Bland-Altman plots showed no mean bias between reported ages at onset compared with estimated ages for both SCAs, the difference between reported and estimated ages at onset not being significantly different from 0 (SCA1: −0.26 [−16.10 to 15.60], SCA3: −1.54 [−21.00 to 17.91]) (Figure 3). However, in SCA1, patients with older ages at onset had onset later than what was expected (Figure 3A, r = −0.44, p = 0.021).
Figure 3. Plot of Differences Between the Estimated Age at Ataxia Onset and the Reported Age at Onset vs the Mean of the 2 Measurements for Patients With SCA1 (Panel A) and SCA3 (Panel B).
The solid line corresponds to the absence of differences. The bias (dotted lines) is −0.26 (−16.10 to 15.6) for SCA1 and −1.54 (−21.00 to 17.91) for SCA3. SCA1 = spinocerebellar ataxia type 1; SCA3 = spinocerebellar ataxia type 3.
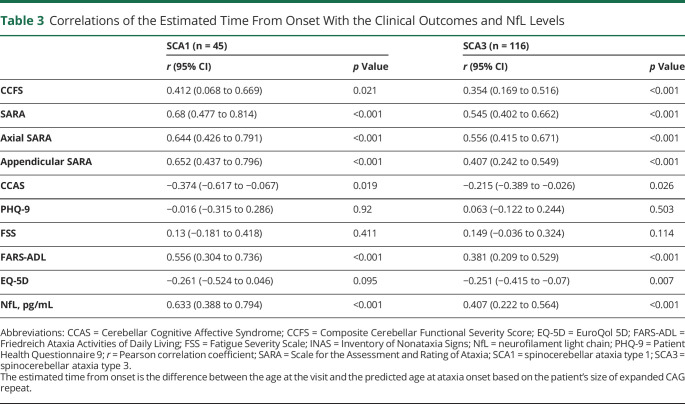
For both SCAs, the estimated time from onset was correlated with all the tested clinical outcomes except for PHQ-9, FSS and EQ-5D for SCA1 (Table 3): the longer the estimated time from onset, the more severe the clinical outcomes.
Table 3.
Correlations of the Estimated Time From Onset With the Clinical Outcomes and NfL Levels
Plasma NfL
The mean NfL values differed significantly between all groups, preataxic participants being intermediate between controls and patients with ataxia (Table 1, Figure 2, B and D). The mean NfL levels were significantly higher at the preataxic stage than in healthy individuals in SCA1 (18.0 pg/mL [12.3–21.9] vs 5.7 [4.3–7.2]; p < 0.0001) and in SCA3 (19.8 pg/mL [13.9–27.3]; p < 0.0001). These differences remain significant after adjustment for the expanded CAG repeat length. This is not explained by age difference; the controls and expansion carriers without ataxia had similar ages. Among carriers (preataxic and patients with ataxia), participants with higher NfL values had longer estimated diseased duration (r = 0.633, p < 0.0001), higer SARA (r = 0.756, p < 0.0001), higher CCFS (r = 0.362, p = 0.0084), and higher INAS count (r = 0.740, p < 0.0001). In addition, the mean NfL levels were higher for SCA1 patients with decreased vibration sense at ankles (35.5 ± 17.9 vs 21.9 ± 10.7, p = 0.023) and SCA3 patients with diplopia (31.6 ± 8.6 vs 18.2 ± 13.3, p = 0.0009) (eTable 3, links.lww.com/WNL/C643).
Discussion
In the READISCA study, 200 individuals, 161 carriers of pathologic repeats in ATXN1 or ATXN3 and 39 controls, were included to be followed over time in a multicenter, international study. The baseline data are reported here. Our findings indicate a separation of the disease course of expansion carriers without ataxia from healthy controls, continuing into very early-stage SCA1 and SCA3. This builds on what we have learned from the RISCA study, that included 50 SCA1 and 26 SCA3 carriers among other CAG repeat SCAs.3 Cramps were present in 23% of the preataxic READISCA SCA1 patients and in 40% of the RISCA carriers.3 The most prevalent sign was early upper motor neuron impairment in 61% of preataxic SCA1 individuals in the READISCA study. In RISCA, corticospinal signs were also significantly more frequent in SCA1 carriers.4 It had been shown that central motor conduction time is increased at the preataxic stage in SCA1.32 This underpins the early corticospinal involvement in SCA1.32 In preataxic SCA3, corticospinal involvement was associated with sensory deficit reflecting a combined alteration of long axons. In addition, diplopia distinguished the preataxic SCA3 group from controls, which could be due to early cerebellar signs that create disconjugated eye movements. Similar eye movement alterations have been evidenced by a video-oculography recording in 28 Brazilian preataxic SCA3 carriers from the BIGPRO cohort.6 These patients were 4.2 years before median predicted onset, and the slow-phase velocity of gaze-evoked nystagmus correlated time to onset.6 Baseline analysis in the RISCA cohort showed a higher rate of horizontal gaze-evoked nystagmus in SCA3 carriers, but no difference of the abnormalities, such as decreased vibration sense and increased reflexes, as found in READISCA. This could be due to the younger age in the RISCA cohort compared with READISCA (28 years vs 36 years) and that RISCA participants were further away from the predicted age at ataxia onset (9 years vs 2 years but with different models used for these predictions). Thus, READISCA preataxic carriers were more advanced in the pathologic disease stage.
In ataxic stages, CCAS showed cognitive alterations in 50% of SCA1 and 43% of SCA3 in line with a previous study using a less specific cognitive evaluation.33 Comorbid depression was also reported common in SCA, up to 26%.34 There were differences according to the geographical origin of the cohorts with suicidal ideation that was present in 65% in SCA3 in the US CRC-SCA cohort5 and major depressive syndrome in 12% in the EUROSCA cohort.35 In READISCA, depression as assessed by PHQ-9 was already present in SCA3 at the preataxic stage, but not significantly different from controls. Both SCA1 and SCA3 patients were more depressed than controls in the ataxic stage. This could be alleviated by early psychological support and treatment with selective serotonin reuptake inhibitors.9
NfL is a very early biomarker that increases either with the speed of neurodegeneration or with its spread in the nervous system.36 In expansion carriers without ataxia, corticospinal and posterior column axons are affected in SCA1 and SCA3, and this could drive the NfL levels at that stage. In a recent study on SCA1 NfL levels, there were 23 SCA1 preataxic carriers and they had lower NfL levels than in our study (aged 25 years and 15.5 pg/mL [10.5–21.1] vs 39 years and 18.0 pg/mL [12.3–21.9]).37 The increase can be explained by older age but not by the clinical stage. Therefore, NfL allows stratification for homogenous groups of expansion carriers without ataxia, and the combination with other biomarkers such as enotaxin can be promising.38
The strong correlations of estimated time from onset with SARA, CCFS, CCAS scale, and NfL measurements suggest that assessments reflected the underlying disease process and might therefore be suitable for therapeutic surveillance. They are correlated with the estimated time from onset that can be negative in carriers and positive in early-stage patients. This result showed that there is a continuous pathologic dysfunction and that the concept of a threshold for disease onset as an event should be abandoned.39 The continuing spread of neurodegeneration in hereditary diseases has been evoked through evident neurodevelopmental deficits observed decades before the “onset” of signs in the closely related Huntington disease.40
As the study included carriers before the onset of ataxia, we did not use the participant-reported disease duration to correlate with the current measures of functional status, which would decrease the sample size, and thus the power, and bias the analysis, omitting the preataxia participants. Instead, we used the estimated time from onset derived from the estimated age at ataxia onset based on the CAG repeat length even if is well known that prediction of age at onset based on the size of expanded CAG repeats can be substantially variable especially in adult-onset patients. For SCA1 carriers, we used our formula, which is the only 1 available.18 For SCA3 carriers, a recently published new formula19 was used instead of our formula.18 This new formula used a linear transformation from the CAG repeat length, while our formulas used an exponential transformation of a quadratic function of the CAG repeat length. With our formula, patients with late estimated and reported onset showed an underestimated age at onset, which was not the case with the Peng formula, indicating a better use of CAG repeat size and its influence on age at onset (data not shown).
A limitation of the study despite the multicenter setting is the small sample size for the preataxic groups with SCA1 and SCA3. Nevertheless, we were able to show differences between preataxic participants and healthy controls, which was the focus of READISCA. Longitudinal data are needed to analyze the predictive value of the presence of these symptoms before ataxia onset.
Predictability of SCAs by the presence of the pathologic CAG repeat makes these diseases accessible for early intervention before pathologic dysfunction. The findings from this study have key relevance for informing strategies to counteract early changes at the right time. They showed that preataxic features could be detected, even in the absence of ataxia. We observed that corticospinal signs for SCA1 and SCA3 and posterior column signs with sensory ataxia for SCA3 are present in the preataxic stage. These results combined with those of the MRI analysis performed on a subset of this cohort41 support the finding that neuronal dysfunction occurs many years before the development of cerebellar ataxia.7 Until today, the presence of cerebellar signs had a diagnostic value in SCAs. The alterations that we describe in preataxic SCA1 and SCA3 carriers who are ∼6 years before estimated ataxia onset, should be considered when selecting participants for future therapeutic trials and not restrict the selection to patients with cerebellar signs.
Acknowledgment
The READISCA investigators thank all participants for their enduring willingness and interest in this research. We extend gratitude to all study coordinators at READISCA sites (readisca.org/readisca-team/#Coordinators) and Chantel Potvin for outstanding project management. We further thank the National Ataxia Foundation for assistance with traveling logistics of participants.
Glossary
- CCAS
cerebellar cognitive affective syndrome
- CCFS
Composite Cerebellar Functional Severity Score
- EQ-5D
EuroQol 5D
- FARS-ADL
Friedreich Ataxia Activities of Daily Living
- FSS
Fatigue Severity Scale
- INAS
Inventory of Nonataxia Signs
- NfL
neurofilament light chain
- PHQ-9
Patient Health Questionnaire 9
- SARA
Scale for the Assessment and Rating of Ataxia
- SCA1
spinocerebellar ataxia type 1
- SCA3
spinocerebellar ataxia type 3
Appendix 1. Authors

Appendix 2. Coinvestigators

Study Funding
This work was supported by the National Institute of Neurological Disorders and Stroke grant U01 NS104326 to T.A., H.L.P., G.O., A.D., and T.K. D. Morgan received a Michigan ADRC grant (P30 AG072931).
Disclosure
S. Tezenas du Montcel receives research support from Biogen. S.H. Subramony receives research support from National Ataxia Foundation, Biohaven, NIH, FDA, MDA, Wyck Foundation, FARA, Reata, PTC therapeutics, Retrotope, Avidity Biosciences, Fulcrum therapeutics, Reneo Pharma, and AAVANTIBio and serves on the Scientific Advisory Board for Reata, Avidity, and Dyne therapeutics. G. Öz consults for IXICO Technologies Limited and uniQure biopharma B.V., serves on the Scientific Advisory Board of BrainSpec Inc., and receives research support from Biogen. T. Ashizawa received grants from NAF and Biogen and participates in Biohaven clinical trials NCT03952806 and NCT03701399. The other authors report no relevant disclosures. Go to Neurology.org/N for full disclosures.
References
- 1.Jacobi H, du Montcel ST, Bauer P, et al. Long-term disease progression in spinocerebellar ataxia types 1, 2, 3, and 6: a longitudinal cohort study. Lancet Neurol. 2015;14(11):1101-1108. doi: 10.1016/S1474-4422(15)00202-1. [DOI] [PubMed] [Google Scholar]
- 2.Diallo A, Jacobi H, Cook A, et al. Prediction of survival with long-term disease progression in most common spinocerebellar Ataxia. Mov Disord. 2019;34(8):1220-1227. doi: 10.1002/mds.27739. [DOI] [PubMed] [Google Scholar]
- 3.Jacobi H, Reetz K, du Montcel ST, et al. Biological and clinical characteristics of individuals at risk for spinocerebellar ataxia types 1, 2, 3, and 6 in the longitudinal RISCA study: analysis of baseline data. Lancet Neurol. 2013;12:650-658. doi: 10.1016/S1474-4422(13)70104-2. [DOI] [PubMed] [Google Scholar]
- 4.Jacobi H, du Montcel ST, Romanzetti S, et al. Conversion of individuals at risk for spinocerebellar ataxia types 1, 2, 3, and 6 to manifest ataxia (RISCA): a longitudinal cohort study. Lancet Neurol. 2020;19(9):738-747. doi: 10.1016/S1474-4422(20)30235-0. [DOI] [PubMed] [Google Scholar]
- 5.Luo L, Wang J, Lo RY, et al. The initial symptom and motor progression in spinocerebellar ataxias. Cerebellum. 2017;16(3):615-622. doi: 10.1007/s12311-016-0836-3. [DOI] [PMC free article] [PubMed] [Google Scholar]
- 6.Oliveira CM, Leotti VB, Bolzan G, et al. Pre-ataxic changes of clinical scales and eye movement in Machado–Joseph disease: BIGPRO study. Mov Disord. 2021;36(4):985-994. doi: 10.1002/mds.28466. [DOI] [PubMed] [Google Scholar]
- 7.Durr A. Autosomal dominant cerebellar ataxias: polyglutamine expansions and beyond. Lancet Neurol. 2010;9:885-894. doi: 10.1016/S1474-4422(10)70183-6. [DOI] [PubMed] [Google Scholar]
- 8.Kuo PH, Gan SR, Wang J, et al. Dystonia and ataxia progression in spinocerebellar ataxias. Parkinsonism Relat Disord. 2017;45:75-80. doi: 10.1016/j.parkreldis.2017.10.007. [DOI] [PMC free article] [PubMed] [Google Scholar]
- 9.Klockgether T, Mariotti C, Paulson HL. Spinocerebellar ataxia. Nat Rev Dis Primer. 2019;5(1):24. doi: 10.1038/s41572-019-0074-3. [DOI] [PubMed] [Google Scholar]
- 10.van de Warrenburg BP, Hendriks H, Durr A, et al. Age at onset variance analysis in spinocerebellar ataxias: a study in a Dutch-French cohort. Ann Neurol. 2005;57:505-512. doi: 10.1002/ana.20424. [DOI] [PubMed] [Google Scholar]
- 11.Velázquez-Perez L, Rodríguez-Labrada R, Canales-Ochoa N, et al. Progression markers of Spinocerebellar Ataxia 2. A twenty years neurophysiological follow up study. J Neurol Sci. 2010;290(1-2):22-26. doi: 10.1016/j.jns.2009.12.013. [DOI] [PubMed] [Google Scholar]
- 12.Velázquez-Pérez L, Rodríguez-Labrada R, Canales-Ochoa N, et al. Progression of early features of spinocerebellar ataxia type 2 in individuals at risk: a longitudinal study. Lancet Neurol. 2014;13(5):482-489. doi: 10.1016/S1474-4422(14)70027-4. [DOI] [PubMed] [Google Scholar]
- 13.Velázquez-Pérez L, Rodríguez-Labrada R, Torres-Vega R, et al. Progression of corticospinal tract dysfunction in pre-ataxic spinocerebellar ataxia type 2: a two-years follow-up TMS study. Clin Neurophysiol. 2018;129(5):895-900. doi: 10.1016/j.clinph.2018.01.066. [DOI] [PubMed] [Google Scholar]
- 14.Christova P, Anderson JH, Gomez CM. Impaired eye movements in presymptomatic spinocerebellar ataxia type 6. Arch Neurol. 2008;65(4):530. doi: 10.1001/archneur.65.4.530. [DOI] [PubMed] [Google Scholar]
- 15.Nanetti L, Alpini D, Mattei V, et al. Stance instability in preclinical SCA1 expansion carriers: a 4-year prospective posturography study. Gait Posture. 2017;57:11-14. doi: 10.1016/j.gaitpost.2017.05.007. [DOI] [PubMed] [Google Scholar]
- 16.Faber J, Schaprian T, Berkan K, et al. Regional brain and spinal cord volume loss in spinocerebellar ataxia type 3. Mov Disord. 2021;36(10):2273-2281. doi: 10.1002/mds.28610. [DOI] [PMC free article] [PubMed] [Google Scholar]
- 17.READISCA Protocol. Accessed June 13, 2022. readisca.org/about/#study-criteria. [Google Scholar]
- 18.Tezenas du Montcel S, Durr A, Rakowicz M, et al. Prediction of the age at onset in spinocerebellar ataxia type 1, 2, 3 and 6. J Med Genet. 2014;51(7):479-486. doi: 10.1136/jmedgenet-2013-102200. [DOI] [PMC free article] [PubMed] [Google Scholar]
- 19.Peng L, Chen Z, Long Z, et al. New model for estimation of the age at onset in spinocerebellar ataxia type 3. Neurology. 2021;96(23):e2885-e2895. doi: 10.1212/WNL.0000000000012068. [DOI] [PubMed] [Google Scholar]
- 20.Schmitz-Hübsch T, du Montcel ST, Baliko L, et al. Scale for the assessment and rating of ataxia: development of a new clinical scale. Neurology. 2006;66(11):1717-1720. doi: 10.1212/01.wnl.0000219042.60538.92. [DOI] [PubMed] [Google Scholar]
- 21.du Montcel ST, Charles P, Ribai P, et al. Composite cerebellar functional severity score: validation of a quantitative score of cerebellar impairment. Brain. 2008;131(5):1352-1361. doi: 10.1093/brain/awn059. [DOI] [PubMed] [Google Scholar]
- 22.Jacobi H, Rakowicz M, Rola R, et al. Inventory of Non-Ataxia Signs (INAS): validation of a new clinical assessment instrument. Cerebellum. 2013;12:418-428. doi: 10.1007/s12311-012-0421-3. [DOI] [PubMed] [Google Scholar]
- 23.Hoche F, Guell X, Vangel MG, Sherman JC, Schmahmann JD. The cerebellar cognitive affective/Schmahmann syndrome scale. Brain. 2018;141(1):248-270. doi: 10.1093/brain/awx317. [DOI] [PMC free article] [PubMed] [Google Scholar]
- 24.Learmonth YC, Dlugonski D, Pilutti LA, Sandroff BM, Klaren R, Motl RW. Psychometric properties of the Fatigue Severity Scale and the Modified Fatigue Impact Scale. J Neurol Sci. 2013;331(1-2):102-107. doi: 10.1016/j.jns.2013.05.023. [DOI] [PubMed] [Google Scholar]
- 25.Lynch DR, Farmer JM, Tsou AY, et al. Measuring Friedreich ataxia: complementary features of examination and performance measures. Neurology. 2006;66(11):1711-1716. doi: 10.1212/01.wnl.0000218155.46739.90. [DOI] [PubMed] [Google Scholar]
- 26.Spitzer RL. Validation and utility of a self-report version of PRIME-MD: the PHQ primary care study. JAMA. 1999;282(18):1737. doi: 10.1001/jama.282.18.1737. [DOI] [PubMed] [Google Scholar]
- 27.Kroenke K, Spitzer RL, Williams JBW. The PHQ-9: validity of a brief depression severity measure. J Gen Intern Med. 2001;16(9):606-613. doi: 10.1046/j.1525-1497.2001.016009606.x. [DOI] [PMC free article] [PubMed] [Google Scholar]
- 28.Rabin R, de Charro F. EQ-SD: a measure of health status from the EuroQol Group. Ann Med. 2001;33(5):337-343. doi: 10.3109/07853890109002087. [DOI] [PubMed] [Google Scholar]
- 29.EuroQol Group. EuroQol: a new facility for the measurement of health-related quality of life. Health Policy. 1990;16(3):199-208. doi: 10.1016/0168-8510(90)90421-9. [DOI] [PubMed] [Google Scholar]
- 30.Kuhle J, Kropshofer H, Haering DA, et al. Blood neurofilament light chain as a biomarker of MS disease activity and treatment response. Neurology. 2019;92(10):e1007-e1015. doi: 10.1212/WNL.0000000000007032. [DOI] [PMC free article] [PubMed] [Google Scholar]
- 31.National Institute of Mental Health Data Archive (NDA). nda.nih.gov/. [DOI] [PubMed]
- 32.Farrar MA, Vucic S, Nicholson G, Kiernan MC. Motor cortical dysfunction develops in spinocerebellar ataxia type 3. Clin Neurophysiol. 2016;127(11):3418-3424. doi: 10.1016/j.clinph.2016.09.005. [DOI] [PubMed] [Google Scholar]
- 33.Klinke I, Minnerop M, Schmitz-Hübsch T, et al. Neuropsychological features of patients with spinocerebellar ataxia (SCA) types 1, 2, 3, and 6. Cerebellum. 2010;9(3):433-442. doi: 10.1007/s12311-010-0183-8. [DOI] [PMC free article] [PubMed] [Google Scholar]
- 34.Lo RY, Figueroa KP, Pulst SM, et al. Depression and clinical progression in spinocerebellar ataxias. Parkinsonism Relat Disord. 2016;22:87-92. doi: 10.1016/j.parkreldis.2015.11.021. [DOI] [PMC free article] [PubMed] [Google Scholar]
- 35.Schmitz-Hübsch T, Coudert M, Tezenas du Montcel S, et al. Depression comorbidity in spinocerebellar ataxia. Mov Disord. 2011;26(5):870-876. [DOI] [PubMed] [Google Scholar]
- 36.Coarelli G, Darios F, Petit E, et al. Plasma neurofilament light chain predicts cerebellar atrophy and clinical progression in spinocerebellar ataxia. Neurobiol Dis. 2021;153:105311. doi: 10.1016/j.nbd.2021.105311. [DOI] [PubMed] [Google Scholar]
- 37.Wilke C, Mengel D, Schöls L, et al. Levels of neurofilament light at the preataxic and ataxic stages of spinocerebellar ataxia type 1. Neurology. 2022;98(20):e1985-e1996. doi: 10.1212/WNL.0000000000200257. [DOI] [PMC free article] [PubMed] [Google Scholar]
- 38.da Silva Carvalho G, Saute JAM, Haas CB, et al. Cytokines in Machado Joseph disease/spinocerebellar ataxia 3. Cerebellum. 2016;15(4):518-525. doi: 10.1007/s12311-015-0719-z. [DOI] [PubMed] [Google Scholar]
- 39.Maas RPPWM, van Gaalen J, Klockgether T, van de Warrenburg BPC. The preclinical stage of spinocerebellar ataxias. Neurology. 2015;85(1):96-103. doi: 10.1212/WNL.0000000000001711. [DOI] [PubMed] [Google Scholar]
- 40.Barnat M, Capizzi M, Aparicio E, et al. Huntington's disease alters human neurodevelopment. Science. 2020;369(6505):787-793. doi: 10.1126/science.aax3338. [DOI] [PMC free article] [PubMed] [Google Scholar]
- 41.Chandrasekaran J, Petit E, Park YW, et al. Clinically meaningful magnetic resonance endpoints sensitive to preataxic spinocerebellar ataxia types 1 and 3. Ann Neurol. Published online December 13, 2022. doi: 10.1002/ana.26573. [DOI] [PMC free article] [PubMed] [Google Scholar]
Associated Data
This section collects any data citations, data availability statements, or supplementary materials included in this article.
Data Availability Statement
The clinical and imaging data from READISCA are available from the NIMH Data Archive.31


