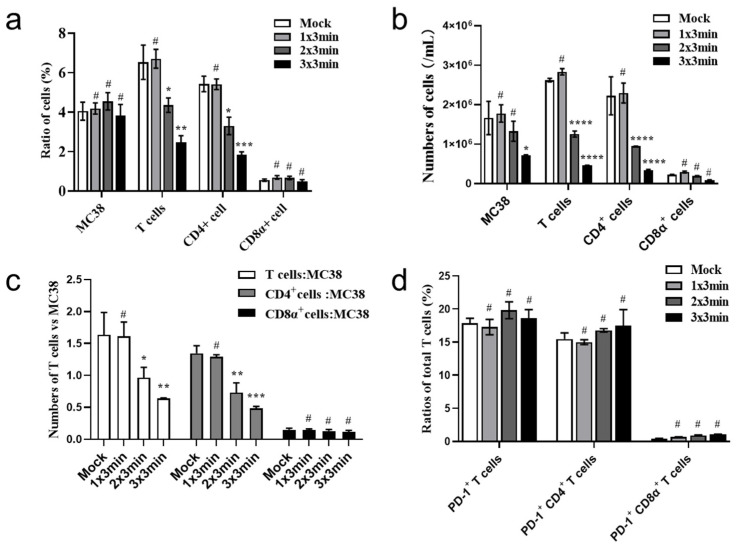
Figure 7.
A high CAP treatment-generated ROS/RNS dose in vitro suppresses T cells more than tumor cells. The MC38 cells and splenic lymphocytes are cultured in DMEM containing 10% FBS, 1% penicillin-streptomycin, 3 µg/mL CD3, and 2 µg/mL CD28, and then treated with different exposure times and frequencies of CAP treatment (on-3, tw-3, and th-3), as illustrated in Figure 1a. (b) Flow cytometry analysis to determine the number and proportion of MC38 cells and T cell subsets in the mock and PT groups, n = 3. (c) Ratio of T cell subsets to MC38 cells determined based on the results in (a,d). Flow cytometry analysis of the proportion of PD-1+ T cell subsets in the total T cell populations, n = 3. The data are representative of three independent experiments (mean ± SD). The statistical analysis is performed using two-sided unpaired t-tests relative to the mock group (# insignificant, * p < 0.05, ** p < 0.01, *** p < 0.001, and **** p < 0.0001).

