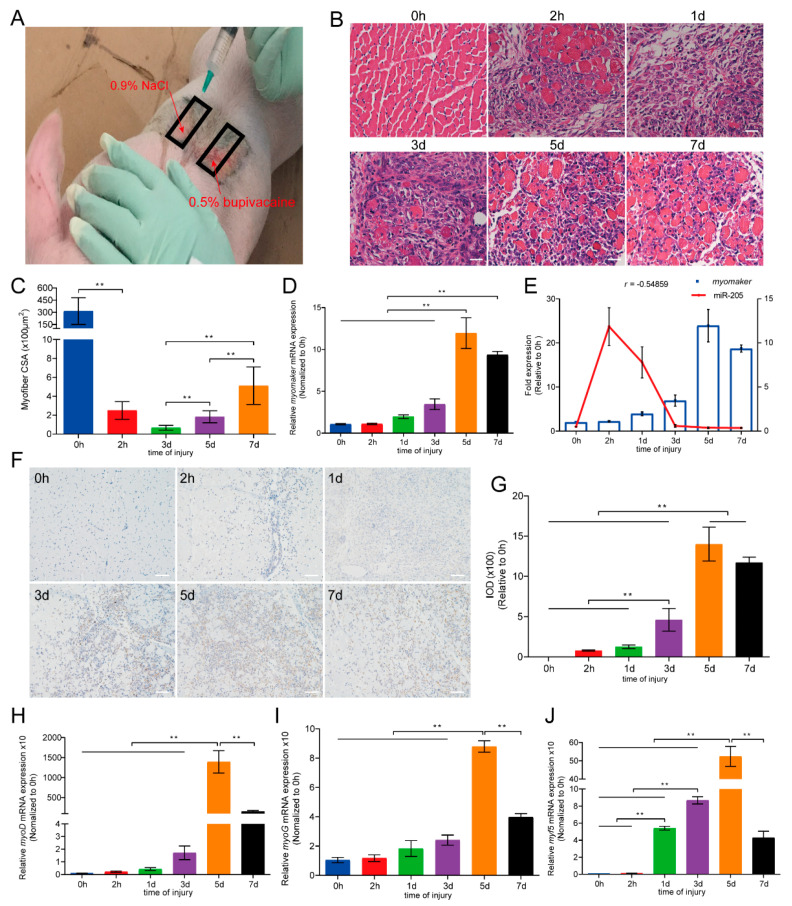
Figure 6.
Expression profiles of Myomaker during muscle regeneration. (A) Skeletal muscle acute injury model of pig longissimus dorsi muscle by injecting 0.5% bupivacaine; (B,C) H&E staining of longissimus dorsi muscle and the quantification of muscle fiber CSA. Bars, 20 µm; (D,E) the relative expression levels of Myomaker mRNA was examined by quantitative real-time PCR and correlation between expression of Myomaker and miR-205; (F,G) immunohistochemistry with Myomaker and the quantification of IOD. Bars, 50 µm; (H–J) The relative expression levels of marker genes of skeletal muscle differentiation (early phase: MyoD and Myf5, later phase: MyoG). Results are represented as mean ± S.D. of three independent experiments. ** p < 0.01 compared between the indicated groups.

