Abstract
Cherenkov images can be used for the quality assurance of dose homogeneity in total skin electron therapy (TSET). For the dose mapping purpose, this study reconstructed the patient model from 3D scans using registration algorithms and computer animation techniques. The Cherenkov light emission of the patient’s surface was extracted from multi-view Cherenkov images, converted into dose distribution, and projected onto the patient’s 3D model, allowing for dose cumulation and evaluation. The projected result from multiple Cherenkov cameras provides additional information about Cherenkov emission on the sides of the patients, which improves the agreement between the Cherenkov converted dose and the OSLD measurements.
Keywords: total skin electron therapy, Cherenkov imaging, computer graphics, biomedical optics
1. INTRODUCTION
Total skin electron beam therapy (TSET) is a widely utilized treatment for cutaneous lymphoma and leukemia[1–6]. The Stanford standing technique is employed in Penn’s clinic to position patients for TSET. The patient needs to stand in six different postures while being irradiated by the high-energy electron beam[7]. For each posture, the patient receives the beams from two gantry angles to ensure adequate dose coverage of the upper and lower body[8]. The goal for the setting is to obtain a uniform dose distribution (within 10%) on the patient’s whole skin surface, with exception of the region where the beam must incident obliquely due to the curvature of the body contour.
However, dose verification of the patient’s entire surface could be challenging in this context. Typical dosimetry tools, such as diodes, TLDs, and OSLDs, can only measure the dose at certain points of the body. Recent studies have demonstrated that Cherenkov imaging can be a promising optical imaging method to evaluate the 2D dose distribution for TSET patients[9–11]. The Cherenkov light emits when the speed of the electron exceeds the light speed in tissue during the radiation and can be captured by a specific intensified camera[12, 13]. Studies have indicated a linear relationship between the intensity of the Cherenkov signal and the surface dose of tissue with uniform optical properties[9]. As such, Cherenkov emission can be utilized as a surrogate for superficial dose, allowing for the derivation and visualization of the 2D surface dose distribution[11]. The Cherenkov-converted dose can then be projected onto the reconstructed patient 3D model for each posture. As for the cumulative dose analysis, computer animation techniques have been proposed to generate different models for different postures with the same vertex index for the same part of the body. The cumulative dose can be calculated by summation and displayed on the single body surface[14].
This study extends the methods by combining Cherenkov projections from three different views. The side cameras can capture the side Cherenkov emissions that are missed by the front camera and give a more accurate dose prediction on top of the single-view projection method.
2. MATERIALS AND METHODS
2.1. Setup of the treatment, camera and measurements
For TSET treatment, Truebeam Linac (Varian, Palo Alto, CA) is used to produce 6 MV electron beam. The Linac gantry is rotated to 90° and a TSE box (120 × 120 × 240 cm) is placed 400 cm away from the isocenter, right in the center of the radiation field. The patient stands in the center of the TSE box with a source-surface-distance (SSD) of 500 cm and is postured in six different positions throughout the treatment according to the Stanford standing setup. The treatment is administered in two-day cycles with three dual fields to treat three postures each day. For each posture, the gantry angle was set at 74° and 106° to deliver the upper and lower fields. Each field consists of 2226 Monitor Units (MU) of electron beam (HDTSE) at a dose rate of 2500 MU/Min. For every TSET treatment, optically stimulated luminescent dosimeters (OSLDs) are taped on the patient skin for the cumulative dose monitoring purpose. For the single-projection studies, six OSLDs are taped to the patient’s vertex, chest, umbilicus, perineum, right hand and right shin. For the multi-projection studies, two additional OSLDs are used to record the dose on the two sides of the patient, which can be later used for Cherenkov-to-dose conversion for side cameras.
To collect the Cherenkov emissions from the patient’s surface, three time-gated intensified cameras (CDose Camera System, DoseOptics, Lebanon, NH) are employed (Figure 1(a)). The front camera (Figure 1(b)) is mounted on the wall of the clinic room behind the Linac head and at the same height as the radiation isocenter. The distance between the front camera and the patient is around 7.5 meters. The two side cameras (Figure 1(c)&(d)) are as well mounted on the wall capturing the left and right side Cherenkov emissions. The door-side camera is 90 cm higher than the radiation isocenter, whereas the wall-side camera is 70 cm higher. All three cameras are angled to point at the patient to provide a full view of the TSE box.
Figure 1.
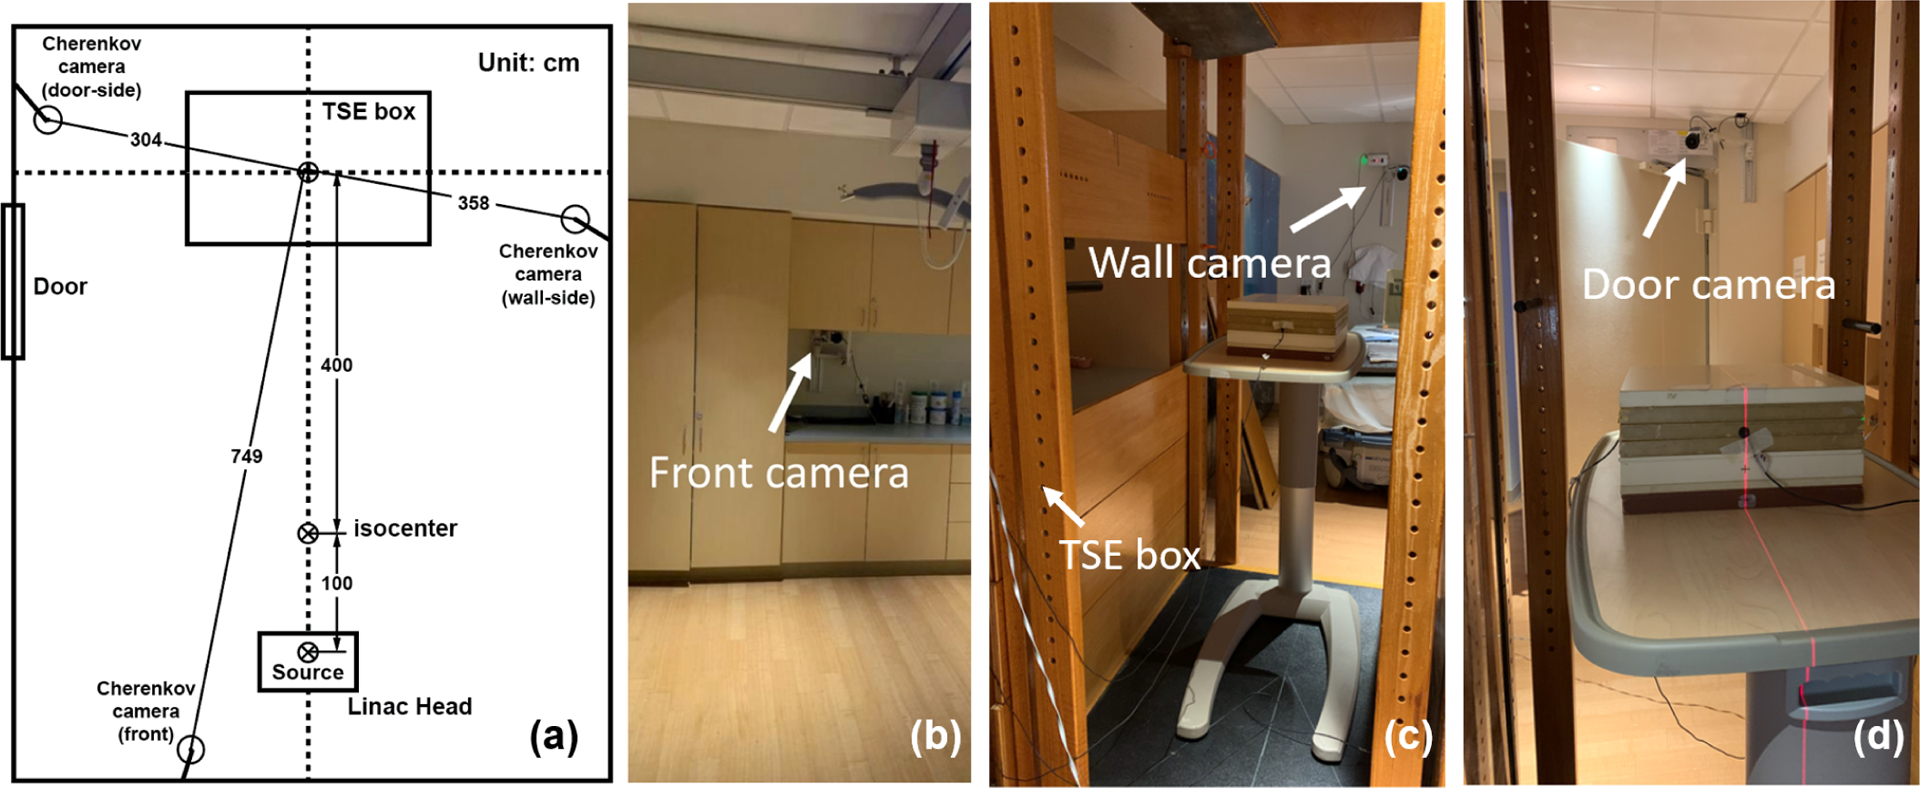
(a) Schematics of the location of the Cherenkov cameras and treatment setup. (b) Cherenkov camera in the front. (c) Cherenkov camera on the door side (viewing from the TSE box). (d) Cherenkov camera on the wall side.
Two 3D surface cameras are placed in front of the patient to acquire the patient’s position during the treatment. After the patient is postured and held still as the therapist instructs, the two 3D cameras will scan the patient’s surface contour in two perspective views. The room light is dimmed for less contamination to the Cherenkov signals and the therapist can monitor the patient through an infrared camera. During the treatment, the Cherenkov cameras will record the Cherenkov light triggered by the electron pulse and provide a video about the real-time Cherenkov emission during this whole section. Then the Cherenkov image for each field can be acquired by accumulating each frame of the recorded video after background subtraction.
2.2. Corrections and conversions for the Cherenkov signals
In addition to the dose-response relationship, the Cherenkov intensity may also be affected by camera properties, such as cameras’ vignetting effect and sensitivity variations. To this end, flood correction (Figure 2(a)) is applied to address the different responses of the pixels. Subsequently, perspective correction (Figure 2(b)) is applied to account for the vertical inconsistency between the Cherenkov signals and the dose readings based on the diode measurement.
Figure 2.

(a) Flood image corrections (normalized to 1 at max point) for Cherenkov cameras at door (cam0, left), front (cam1, middle), and wall (cam2, right). (b) Plot of perspective geometrical correction factors (red line) used to correct the Cherenkov intensities, with reference point at the isocenter. The dotted lines are the measured data (ratio between the diode measurements and the Cherenkov readings) for different MUs, and the red line is the averaged result.
After applying the full corrections, the Cherenkov image for each view is converted to a 2D dose map. The Cherenkov-to-dose conversion factor corresponds to the optical properties of the patient skin and must be calculated daily, for each camera, and for each patient. For the front camera, the conversion factor can be derived by taking the ratio of the OSLD measured data and the corrected Cherenkov reading of the umbilicus point. As for the side cameras, the conversion factor can also be determined according to the OSLD measurements and the Cherenkov readings on the sides of AP, LPO, RPO postures for day 1, and PA, LAO, RAO postures for day 2.
2.3. Reconstruction of the patient model and dose mapping
A general workflow is developed to generate the patient finite element mesh (FEM) from the 3D scanned data (Figure 3) using deformable registration[15] and computer animation technique[14]. Because of the limitations of the camera view, two 3D scanners are used to acquire partial of the patient’s surface meshes. Then the two meshes, along with additional meshes cut from other postures to fill the missing surface, are registered and combined according to the positions of the TSE box and the continuity of the patient’s surface. Due to the low quality of the 3D scanners, the meshes need some manual editing, such as surface reconstruction and smoothing, to get the target FEM for the registration (Figure 3(a)). Deformable registration is then performed to a template FEM, with each vertex labeled, to generate the 3D model of the actual patient during the treatment (Figure 3(b)). Computer animation technique (i.e., Rigging, Blender is used in the study, Blender Foundation, Amsterdam) is applied to move the arms and the limbs of the patient’s model to get the other 5 postures (Figure 3(c)&(d)). This process will ensure the vertices index of the same body part remains the same for different postures, allowing for the summation to get the cumulative dose. Finally, manual modifications are made to better align the patient’s model to the 3D scans for each posture.
Figure 3.
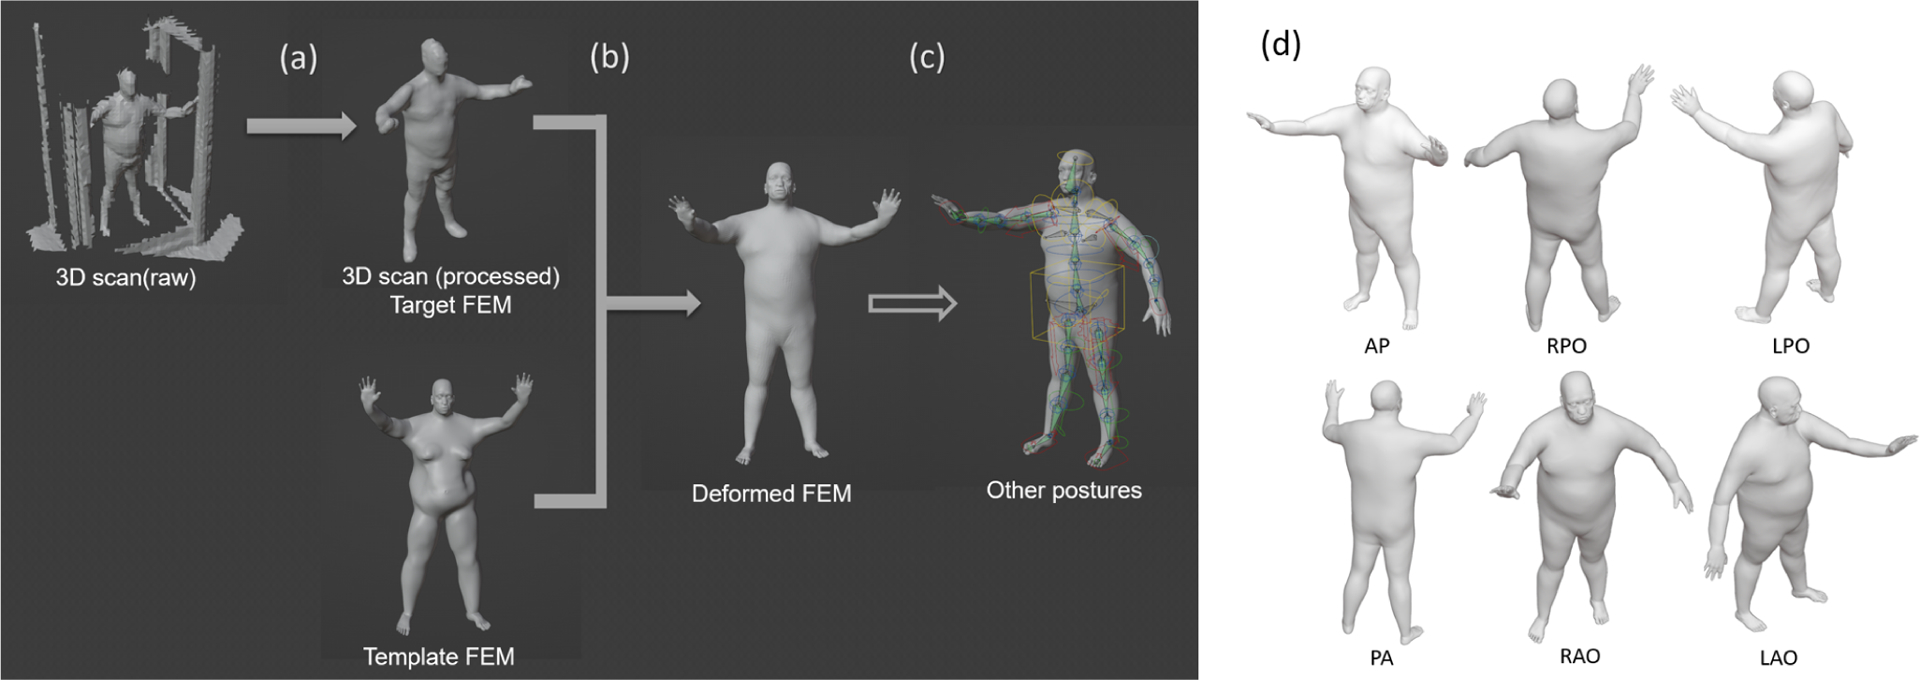
The general workflow of reconstructing patient models. (a) Basic processing of raw data (b) Conversion of the template FEM to patient model, (c) Rigging the patient model to match all six postures (using Blender3.0). (d) The six postures of a patient undergoing TSET
For the dose mapping, a MATLAB code is developed to simulate the Cherenkov camera. The perspective view of the patient can be generated according to the location and orientation of the camera using the pin-hole camera model. Manual registration can be performed to align the perspective projection of the 3D model and the Cherenkov images. Then the Cherenkov converted dose can be projected onto each vertex of the patient model by 2D interpolation. For each view, code is developed to identify the back side of the patient according to the camera position and force the value to be zero. Then the projection result from different views is combined using the average and maximum function. Finally, the cumulative dose distribution is obtained by the summation of six postures and the analysis and evaluation for the 3D cumulative dose distribution can be made for each patient.
3. RESULTS
Figure 4 is the comparison of single-view projection and multi-view projection on the AP fields. Figure 5 is the comparison of the cumulative Cherenkov dose surface histogram of the two methods. Figure 6 is the dose comparison and profiles of the accumulated dose of six fields. Table 1 is the comparison of the relative dose to the umbilicus point between two projection methods based on OSLD measurements.
Figure 4.
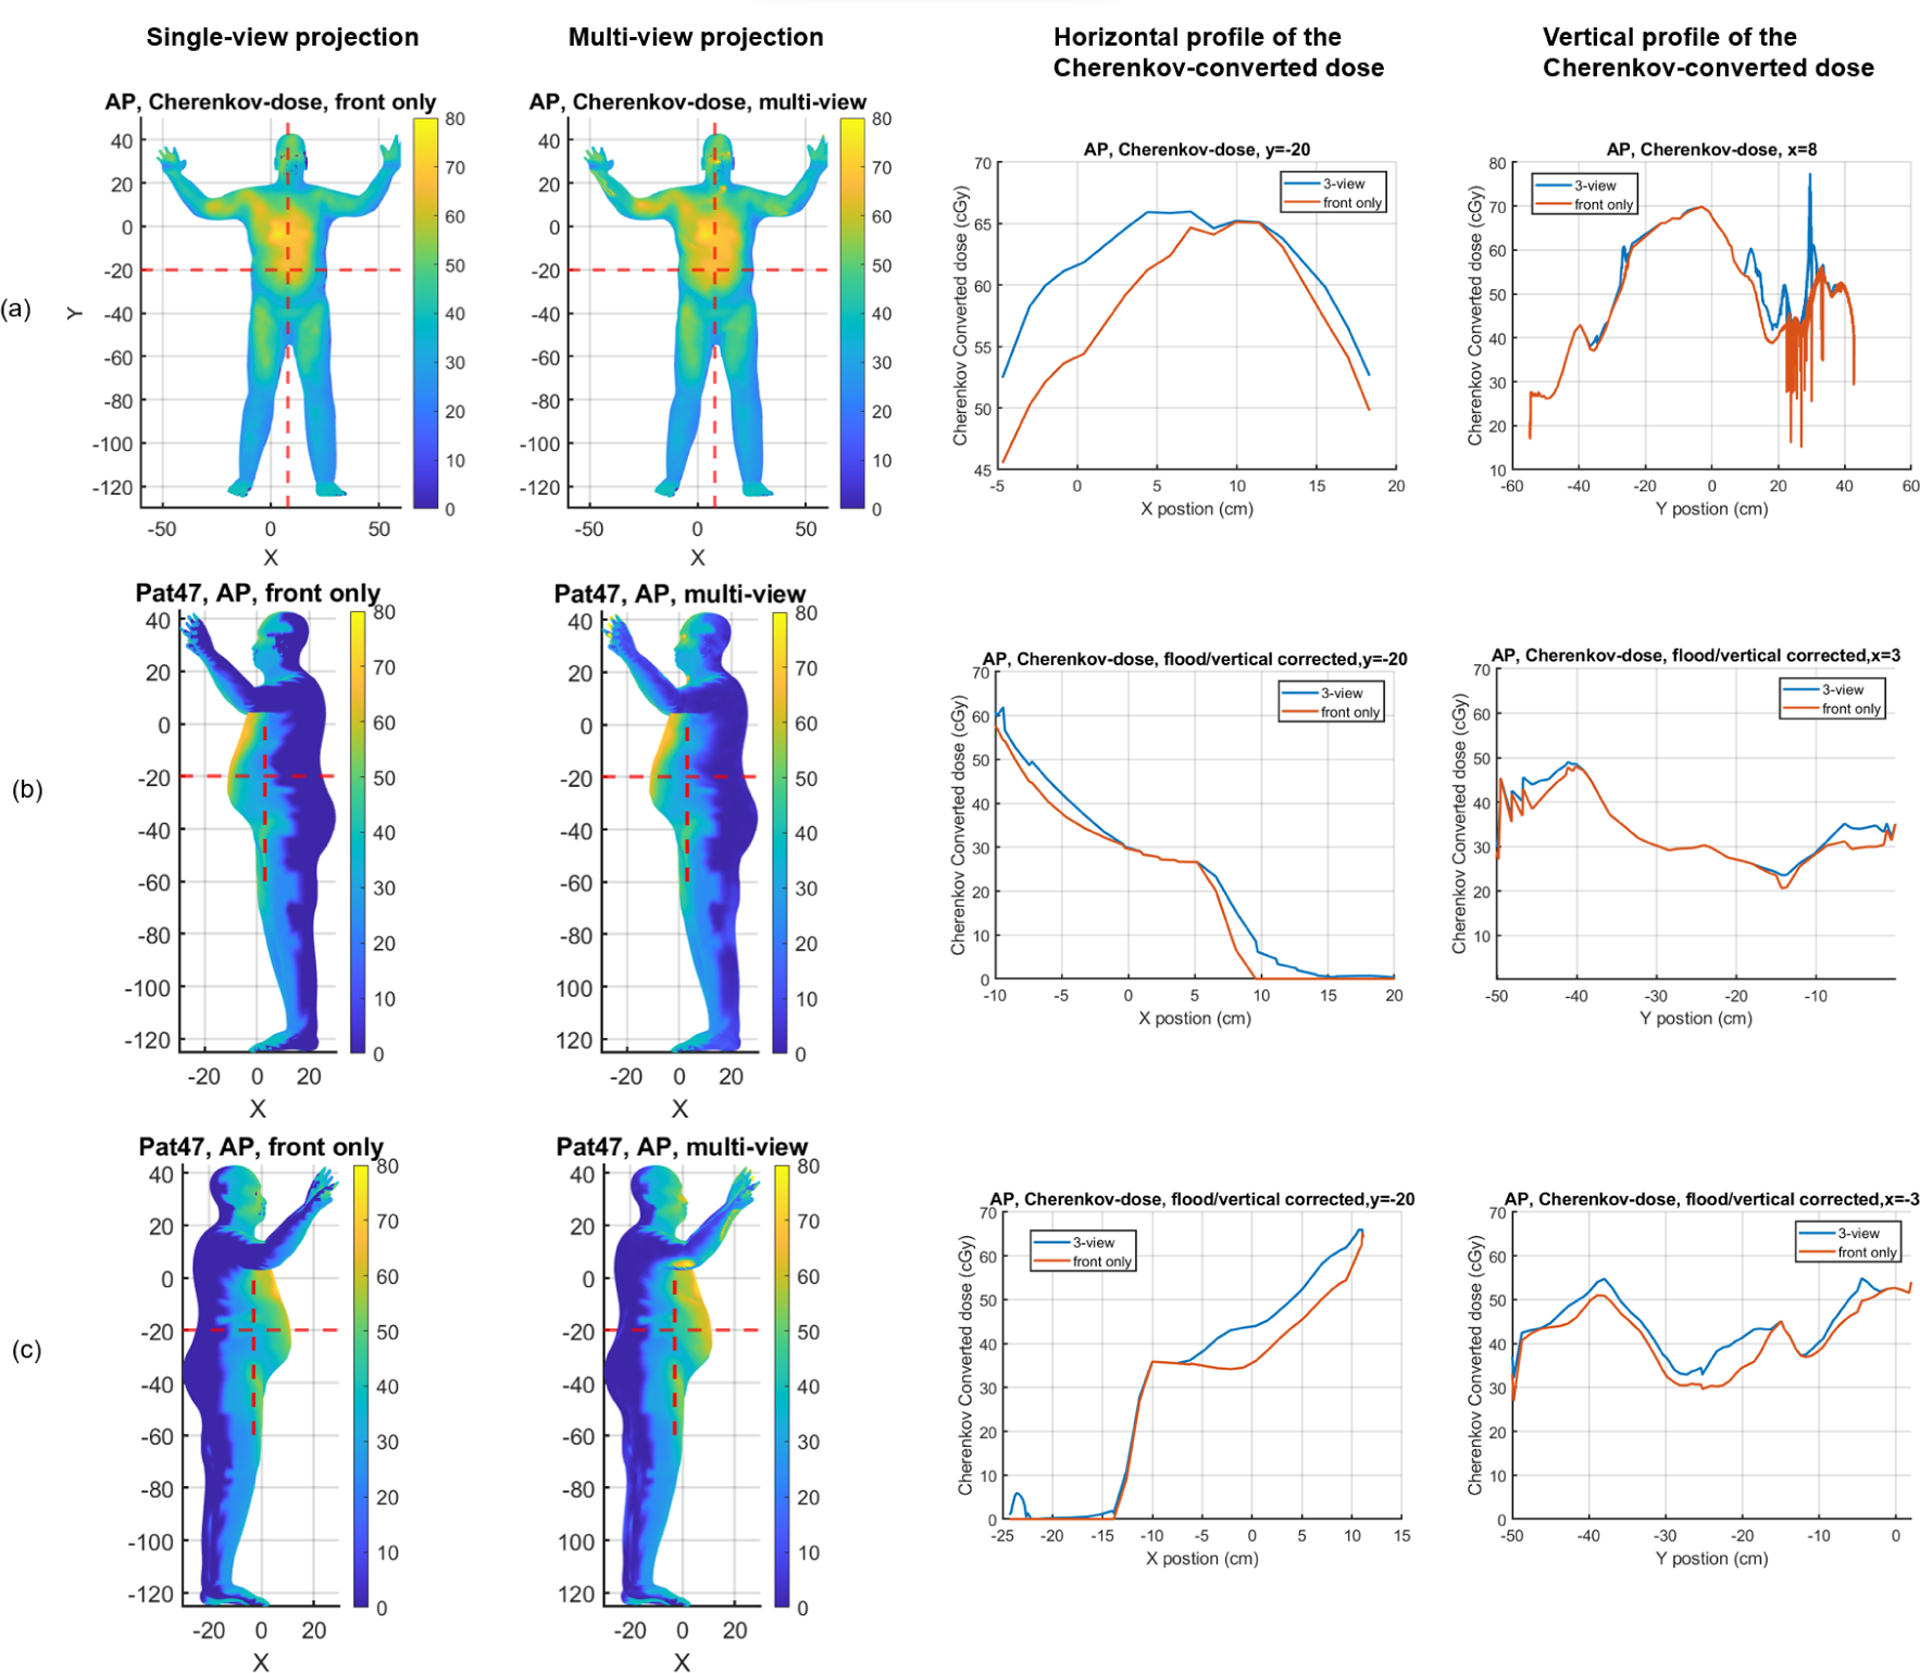
The comparison of the Cherenkov converted dose for the AP field of patient #47. (a) is the front view, (b) is the patient’s left side view, and (c) is the patient’s right side view. The left two columns are the projected result displayed on the patient’s model using single-view and multi-view methods respectively. The red dotted lines indicate the location where we got the dose profiles. The right two columns are the horizontal and vertical profiles of Cherenkov converted dose on the outer surface of the patient. The blue solid lines are the multi-view projected result and the orange lines are the projected result only using the front view. The unit of colormap is in cGy.
Figure 5.
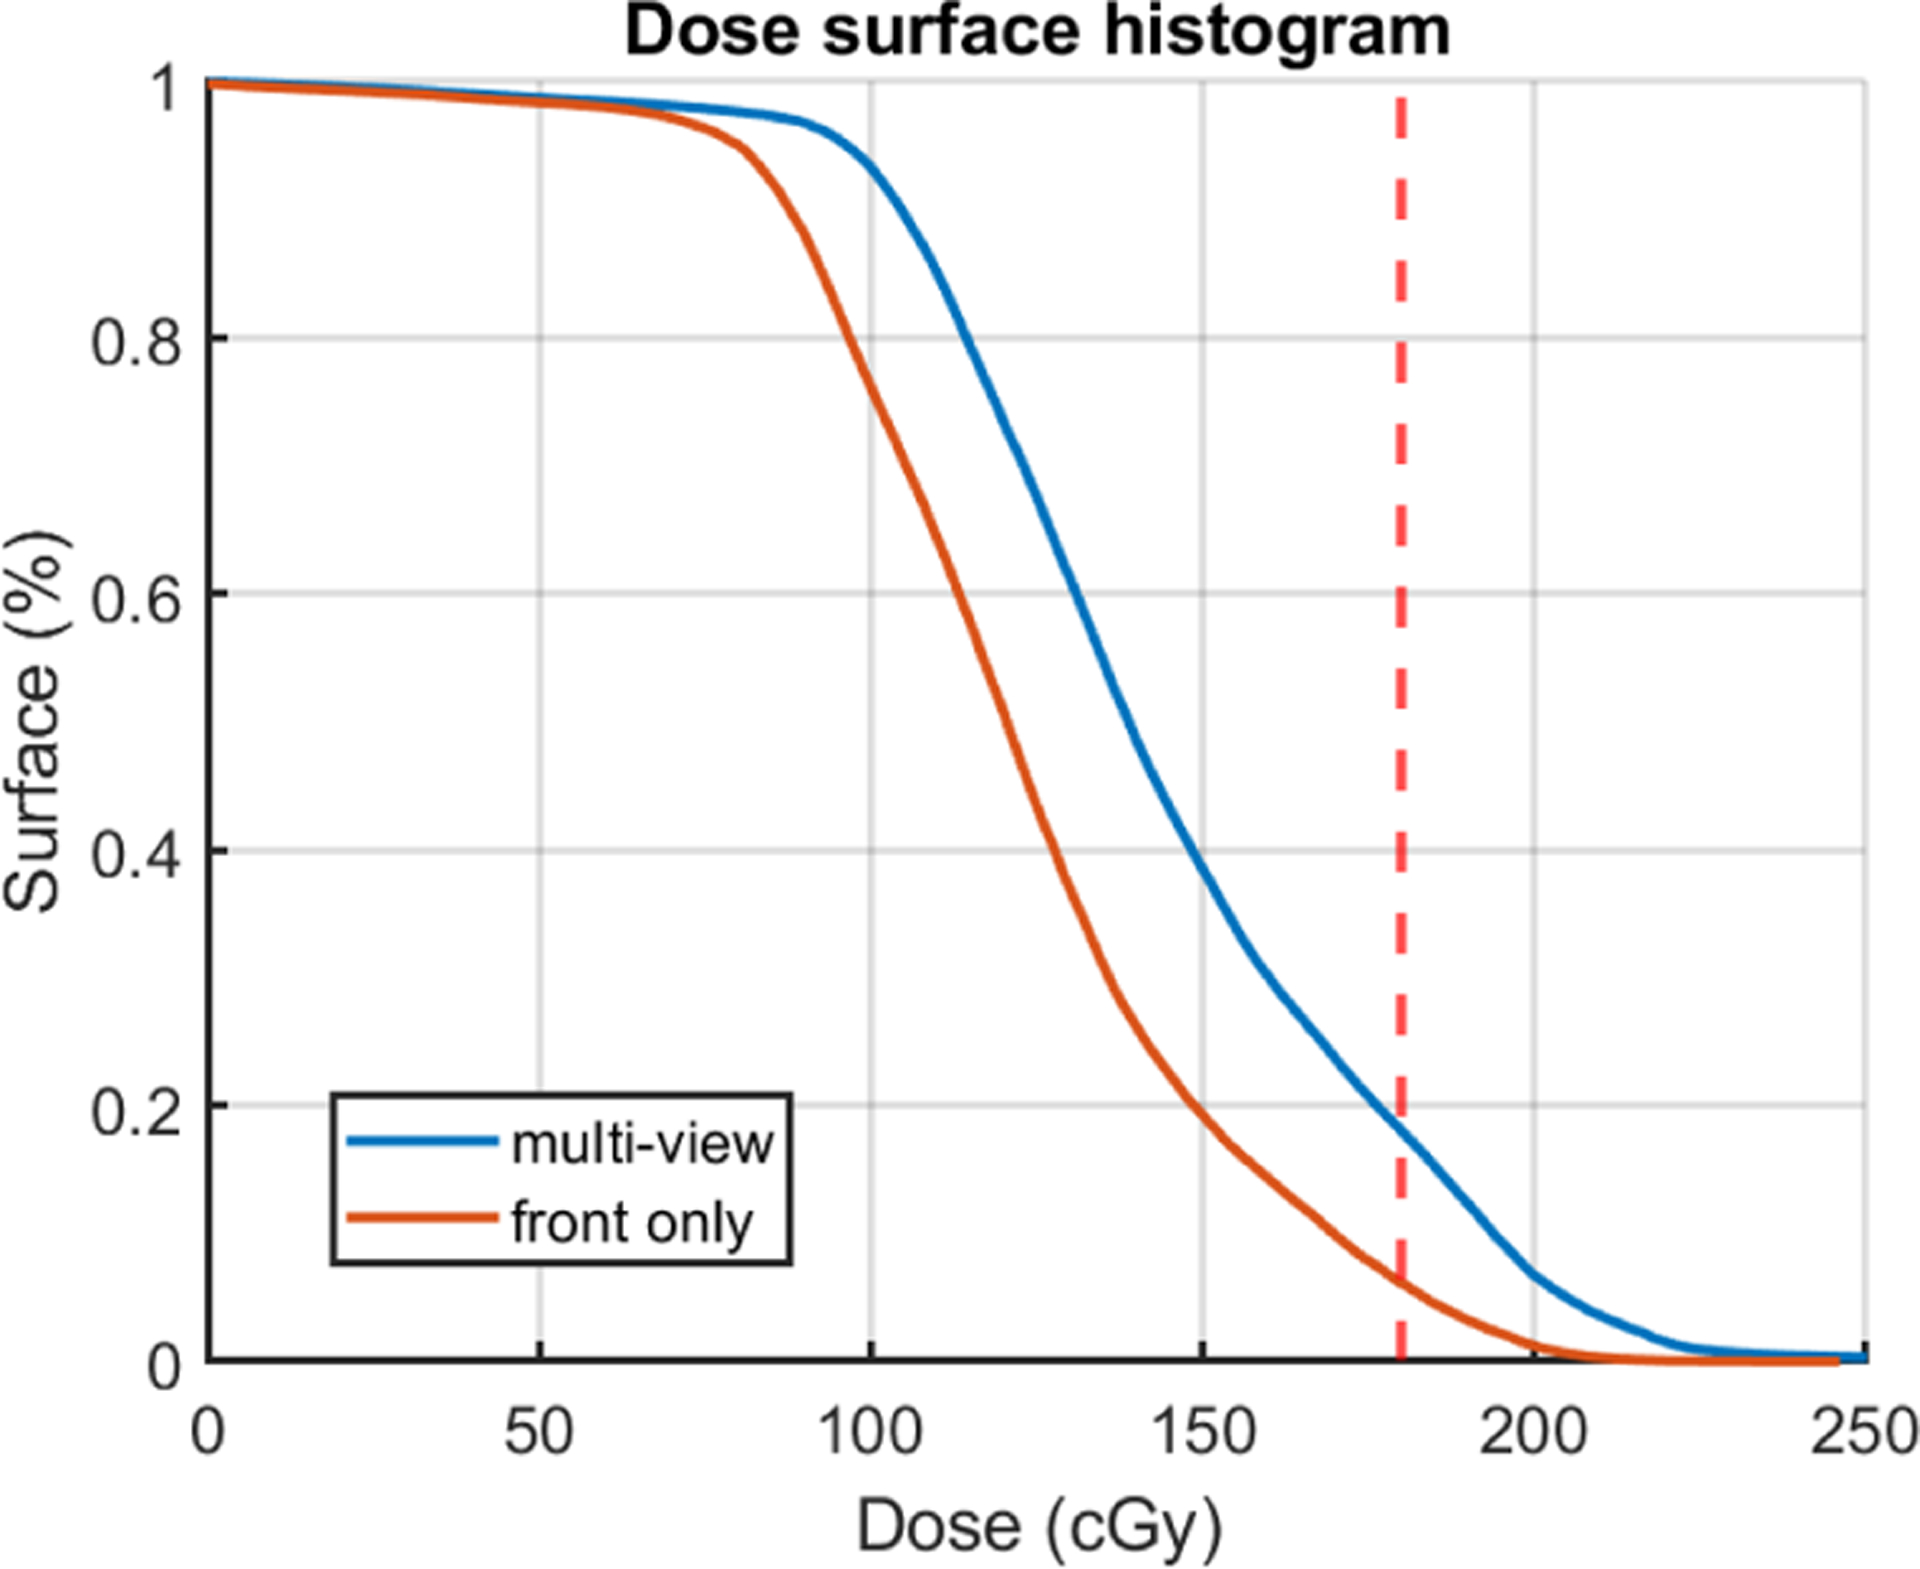
The dose surface histogram (DSH) of the cumulative Cherenkov converted dose for patient 47 using single-view and multi-view projection. The blue solid lines are the multi-view projected result and the orange lines are the projected result only using the front view.
Figure 6.
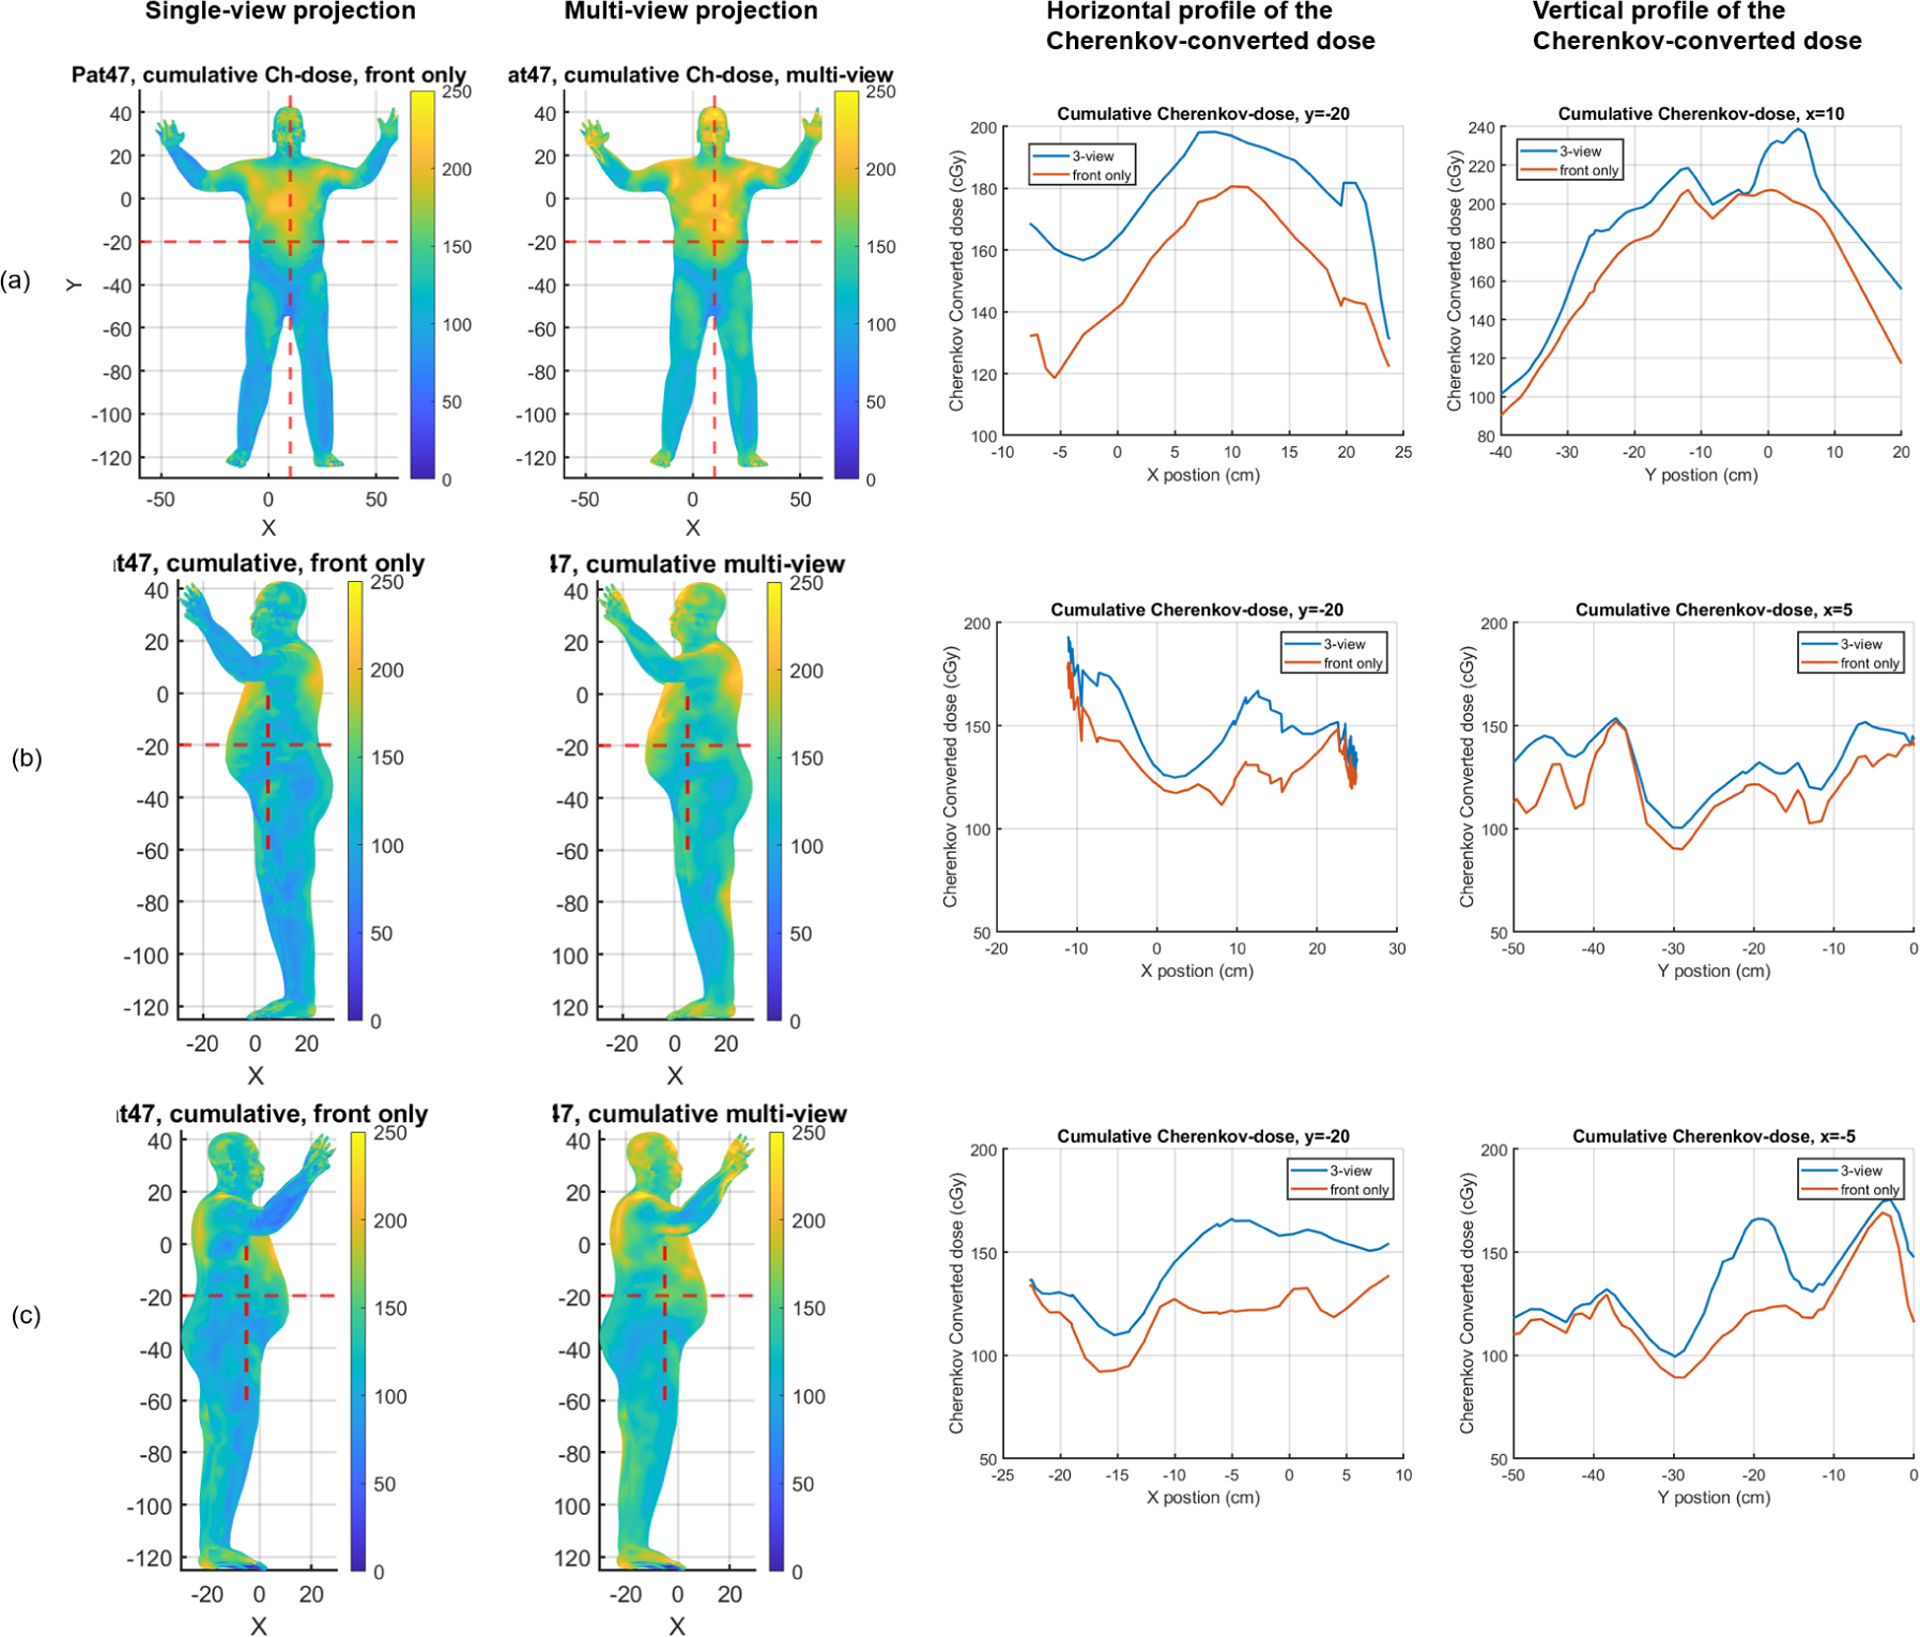
The comparison of the cumulative Cherenkov converted dose for the six fields of patient #47. (a) is the front view, (b) is the patient’s left side view, and (c) is the patient’s right side view. The left two columns are the projected result displayed on the patient’s model using single-view and multi-view methods respectively. The right two columns are the horizontal and vertical profiles. The unit of colormap is in cGy.
Table 1.
Comparison of relative dose to umbilicus based on Cherenkov cumulative dose and OSLD measurements (Day1 + Day2) for single-view and multi-view projection methods
| Locations | OSLD data | Cherenkov-dose (single-view) | Cherenkov-dose (multi-view) |
|---|---|---|---|
| Umbilicus | 1.000 | 1.000 | 1.000 |
| Vertex | 1.070 | 0.886 | 1.004 |
| Top of R. Shin | 0.811 | 0.512 | 0.543 |
| Chest | 1.019 | 1.166 | 1.139 |
| Mid R. Trunk | 0.827 | 0.697 | 0.768 |
| Mid L. Trunk | 0.869 | 0.719 | 0.822 |
4. DISCUSSIONS
Figure 4 demonstrates that the multi-view projection method yields substantially higher dose distribution on the patient’s side compared to the single-view method. The horizontal profile indicates that the side cameras provide a higher dose estimation than the front camera, especially on the patient’s right side. The vertical profile shows that the two methods have a similar dose distribution in the middle of the torso, as expected due to the majority of the dose being captured by the front camera. However, extra noise is observed near the chest for the multi-view method, which could be attributed to the arm blocking Cherenkov side emissions. Figure 4(b) and 4(c) further indicate that the dose could be at a maximum of 10 cGy higher for the multi-view method. Notice that the jagged pattern on the patient’s side is the result of the front projection, where we pixelate the patient’s mesh, and then manually set the back of the model to zero.
Figure 5 shows that the multi-view method would give a substantially better dose estimation based on the dose surface histogram. However, we find that the overall Cherenkov-converted dose is still lower based on our simulation studies. The DSH is affected by the errors and artifacts introduced by Cherenkov imaging, and it is not indicating the true dose that the patient got. The correction method for the Cherenkov images is still under investigation.
Figure 6 shows the cumulative dose distribution for patient 47 using each method. The multi-view method gives a more uniform and overall higher dose distribution. Hot spots are found over the body, which is expected to be due to the noise from Cherenkov projection, as well as the overlap of different fields based on simulation studies. From the profile (Figure 6(b), Figure 6(c)), we could also find that there is almost a 20% to 30% percent dose increase on the patient’s sides. Table 1 also indicates a 10% increase of the relative dose in the vertex and the side when using the multi-view method. However, the Cherenkov dose on the right shin is still about 30% lower and needed to be corrected for the real dose.
Besides the correction for the Cherenkov signal, there are two major errors in our approach. One is the inaccuracy of the patient model. The intensity of Cherenkov signals largely depends on the patient’s geometry. However, the quality of 3D scanner used in this study is relatively low and detailed parts of the patient body, such as the hands, are ignored. In the future, we’ll improve the scan quality and get more accurate patient geometry. Second, errors from the dose mapping process could attribute to significant uncertainties at the edge of the patient body contour, which could lead to a 100% dose error if the lateral position is not accurately obtained during the projection. Utilizing multiple views in the projection process could reduce these uncertainties, as the position could be double-checked by the light features on the patient’s body.
Furthermore, We assume that the Cherenkov signal is isotopically emitted from the patient’s surface and then make corrections to the Cherenkov image to get the surface Cherenkov emission. However, the geometry relationship between the patient’s surface and the camera hasn’t been considered yet. We’ll conduct more studies to determine the Cherenkov distribution not only that emit from the patient skin but also received by the camera. In this study, we simply use the average and the maximum function to combine different views. We will improve our method to better combine different views and get a more accurate measurement of the dose.
5. CONCLUSIONS
The single-camera Cherenkov projection is a reasonable method to visualize the total dose distribution for TSET patients. However, it has large errors on the edge of the patient’s body contour and would give a low prediction on the side of the patient. Multiple-camera projection provides a good way to validate the dose mapping process and can give a substantially better dose prediction of the side and the vertex based on relative dose measurement. More patient cases are being investigated and further studies are needed for the reliable use of the Cherenkov imaging method.
ACKNOWLEDGEMENTS
The authors would like to thank DoseOptics and Dartmouth College for their technical support for the Cherenkov camera and the associated equipment. We thank Upenn medical physics residents for taking OSLD measurements. We thank Vivin Mathew and Kathy Ransone for consenting the patients. We thank Siovana Sorber, Meghan Minner, and Dexter Wilson for TSET treatment delivery and patient coordination. This research is supported by National Institute of Health (NIH) grant R21CA239127-01A1 and R01CA274411-01.
References
- [1].Safai B and Kim JH, “Effectiveness of once weekly total skin electron beam therapy in mycosis fungoides and sezary syndrome,” Cancer 47, 870–6 (1981). [DOI] [PubMed] [Google Scholar]
- [2].Kaye FJ, Bunn PA, Steinberg SM, Stocker JL, Ihde DC, Fischmann A, Glatstein EJ, Schechter GP, Phelps RM, Foss FM, Parlette HL, Anderson MJ, and Sausville EA, “A randomized trial comparing combination electron-beam radiation and chemotherapy with topical therapy in the initial treatment of mycosis fungoides,” The New England journal of medicine 321, 1784–1790 (12 1989). [DOI] [PubMed] [Google Scholar]
- [3].Wilson LD, Jones GW, Kim D, Rosenthal D, Christensen IR, Edelson RL, Heald PW, and Kacinski BM, “Experience with total skin electron beam therapy in combination with extracorporeal photopheresis in the management of patients with erythrodermic (t4) mycosis fungoides,” Journal of the American Academy of Dermatology 43, 54–60 (2000). [DOI] [PubMed] [Google Scholar]
- [4].Blasko J, Becker L, Griffin TW, Tong DY, and Groudine M, “Electron beam therapy of mycosis fungoides,” California Medicine 95, 292 (1961). [DOI] [PubMed] [Google Scholar]
- [5].Jones GW, Kacinski BM, Wilson LD, Willemze R, Spittle M, Hohenberg G, Handl-Zeller L, Trautinger F, and Knobler R, “Total skin electron radiation in the management of mycosis fungoides: Consensus of the european organization for research and treatment of cancer (eortc) cutaneous lymphoma project group,” Journal of the American Academy of Dermatology 47, 364–370 (9 2002). [DOI] [PubMed] [Google Scholar]
- [6].Harrison C, Young J, Navi D, Riaz N, Lingala B, Kim Y, and Hoppe R, “Revisiting low-dose total skin electron beam therapy in mycosis fungoides,” International journal of radiation oncology, biology, physics 81 (11 2011). [DOI] [PubMed] [Google Scholar]
- [7].El-Khatib E, Hussein S, Nikolic M, Voss NJ, and Parsons C, “Variation of electron beam uniformity with beam angulation and scatterer position for total skin irradiation with the stanford technique,” International journal of radiation oncology, biology, physics 33, 469–474 (9 1995). [DOI] [PubMed] [Google Scholar]
- [8].Weaver RD, Gerbi BJ, and Dusenbery KE, “Evaluation of dose variation during total skin electron irradiation using thermoluminescent dosimeters,” International journal of radiation oncology, biology, physics 33, 475–478 (9 1995). [DOI] [PubMed] [Google Scholar]
- [9].Zhang R, Gladstone DJ, Jarvis LA, Strawbridge RR, Hoopes PJ, Friedman OD, Glaser AK, and Pogue BW, “Real-time in vivo cherenkoscopy imaging during external beam radiation therapy,” Journal of biomedical optics 18, 1 (11 2013). [DOI] [PMC free article] [PubMed] [Google Scholar]
- [10].Zhang R, Fox CJ, Glaser AK, Gladstone DJ, and Pogue BW, “Superficial dosimetry imaging of Cerenkov emission in electron beam radiotherapy of phantoms,” Physics in Medicine & Biology 58, 5477 (7 2013). [DOI] [PMC free article] [PubMed] [Google Scholar]
- [11].Xie Y, Petroccia H, Maity A, Miao T, Zhu Y, Bruza P, Pogue BW, Plastaras JP, Dong L, and Zhu TC, “Cherenkov imaging for total skin electron therapy (tset),” Medical physics 47, 201–212 (1 2020). [DOI] [PMC free article] [PubMed] [Google Scholar]
- [12].Tien PK, Ulrich R, and Martin RJ, “Optical second harmonic generation in form of coherent cerenkov radiation from a thin-film waveguide,” Applied Physics Letters 17, 447 (10 2003). [Google Scholar]
- [13].Andreozzi JM, Zhang R, Glaser AK, Jarvis LA, Pogue BW, and Gladstone DJ, “Camera selection for real-time in vivo radiation treatment verification systems using cherenkov imaging,” Medical physics 42, 994–1004 (2 2015). [DOI] [PMC free article] [PubMed] [Google Scholar]
- [14].Miao T, Petroccia H, Xie Y, Jermyn M, Perroni-Scharf M, Kapoor N, Mahoney JM, Zhu TC, Bruza P, Williams BB, Gladstone DJ, and Pogue BW, “Computer animation body surface analysis of total skin electron radiation therapy dose homogeneity via cherenkov imaging,” Journal of Medical Imaging 7, 1 (6 2020). [DOI] [PMC free article] [PubMed] [Google Scholar]
- [15].Amberg B, Romdhani S, and Vetter T, “Optimal step nonrigid icp algorithms for surface registration,” Proceedings of the IEEE Computer Society Conference on Computer Vision and Pattern Recognition (2007). [Google Scholar]


