Abstract
For quantitative NASBA-based viral load assays using homogeneous detection with molecular beacons, such as the NucliSens EasyQ HIV-1 assay, a quantitation algorithm is required. During the amplification process there is a constant growth in the concentration of amplicons to which the beacon can bind while generating a fluorescence signal. The overall fluorescence curve contains kinetic information on both amplicon formation and beacon binding, but only the former is relevant for quantitation. In the current paper, mathematical modeling of the relevant processes is used to develop an equation describing the fluorescence curve as a function of the amplification time and the relevant kinetic parameters. This equation allows reconstruction of RNA formation, which is characterized by an exponential increase in concentrations as long as the primer concentrations are not rate limiting and by linear growth over time after the primer pool is depleted. During the linear growth phase, the actual quantitation is based on assessing the amplicon formation rate from the viral RNA relative to that from a fixed amount of calibrator RNA. The quantitation procedure has been successfully applied in the NucliSens EasyQ HIV-1 assay.
INTRODUCTION
In recent years, HIV-1 viral load measurement has become a generally applied tool for anti-retroviral therapy monitoring and evaluation of clinical trials. Three main application areas have been identified. First, a baseline level of HIV-1 predicts efficacy of treatment, second, the level of viral load drop upon treatment is an important predictor for the durability of the treatment and, third, the absolute value of HIV-1 RNA upon treatment has prognostic significance (1–4). Commercially available quantitative HIV-1 viral load assays are based on NASBA, bDNA and RT–PCR (5–7). We have developed a system based on combining NASBA amplification and real-time detection utilizing molecular beacons in order to meet increasing needs with respect to analytical assay performance as well as user convenience and high throughput.
Molecular beacons are hairpin-shaped oligonucleotides (Fig. 1). The stem of the beacon is formed by complementary sequences at both ends of the oligonucleotide. A fluorescent label and a quenching group are attached at the two ends of the molecule. The stem holds these two groups in close proximity to each other, causing the fluorescence of the fluorophore to be quenched by energy transfer. When the molecular beacon encounters a target molecule containing a sequence that is complementary to the loop sequence, a hybrid is formed. This hybridization forces the stem apart and causes the fluorophore and the quencher to move away from each other. Now a fluorescence signal can be generated that is not quenched (see for example 8).
Figure 1.
Mode of action of a molecular beacon. In the closed form (left) the fluorophore F and quencher Q are in close proximity, preventing generation of a signal. After binding to amplicon RNA (right) the beacon opens and a signal can be generated that is not quenched.
In recent papers (9,10) we reported the development of a quantitative HIV-1 viral load assay based on NASBA using molecular beacons that hybridize to single-stranded amplicons. The NASBA-driven RNA growth and the subsequent beacon binding yield a fluorescence signal that reflects the events occurring in the reaction tube. As such, detection is performed during the amplification and not afterwards, as is done in former NASBA-based assays (11,12). Analogous to these former assay systems, a fixed amount of calibrator RNA is added to the sample to serve as an internal quantitation standard. This calibrator RNA differs from the sample HIV-1 RNA by only a small part of the sequence, which enables specific hybridization with a sequence-specific molecular beacon. In the assay two different molecular beacons are used, each with a different loop structure to ensure specific binding to either the HIV-1 sample RNA or calibrator amplicons, and each labeled with a different fluorophore to allow specific detection. These two molecular beacons are present at the start of the NASBA reaction and as both the endogenous sample RNA and the calibrator RNA are amplified, two fluorescence signals are produced concomitantly with amplification. Based on these observed fluorescence profiles, the amount of HIV-1 RNA in the original sample is quantified. We have developed a mathematical tool to achieve this goal, which is described below.
QUALITATIVE DESCRIPTIONS OF THE PROCESSES
Molecular biology of the NASBA process
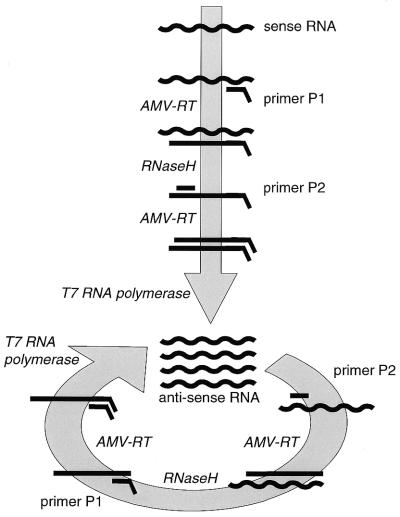
The generally accepted scheme describing the NASBA process is presented in Figure 2 (12–14). The process makes use of two primers, which are short single-stranded DNA fragments, and three enzymes. The viral RNA strands that are present in the original sample are indicated as being the sense strand. Primer P1, after binding to the RNA, is elongated by reverse transcriptase (AMV-RT) to yield a DNA:RNA hybrid, the RNA strand of which is hydrolyzed by RNase H. Then primer P2 can bind, which is elongated by AMV-RT activity to yield a double-stranded DNA molecule.
Figure 2.
Schematic overview of the NASBA process.
Primer P1 is designed such that it contains a nucleotide sequence that, once it is double-stranded, forms a T7 RNA polymerase promoter site so that antisense RNA copies can be generated using the DNA template. From this RNA new copies of DNA are formed in a process similar to that described for the sense strand, but now P2 is the first primer to bind. The final product is a DNA species with a double-stranded promoter region which is sufficient to allow T7 RNA polymerase to use it as a template, so generating more copies of the antisense RNA. Although the reaction sequences starting from the sense and antisense RNA strands form biochemically somewhat different forms of DNA (Fig. 2), they are considered to be kinetically identical and are both referred to as copy DNA (cDNA).
As long as the concentrations of the primers are not rate limiting, the formation of antisense RNA proceeds exponentially with time (see below), although quantitatively important amounts are not yet formed due to the efficiency of the cDNA-producing but RNA-consuming machinery.
Initially, the concentration of primer relative to the total concentration of amplifiable RNA is very high. When assaying a high viral load sample, the number of RNA copies entering amplification is of the order of 105–106, whereas the number of P1 and P2 oligonucleotides is 1012. Therefore, the concentration of primer is not rate limiting and relatively small amounts of primer are consumed in depletion of the initially present pool of sense RNA copies. At some time point, obviously, the primer concentrations do become rate limiting, and decline to practically zero. At this time point the cDNA levels have reached their maximum and antisense RNA production proceeds at high speed, so this transition time interval is short. From now on the only reaction that can proceed is T7 RNA polymerase-mediated formation of antisense RNA from the cDNA templates. As will be shown below, accumulation of RNA is linear with time and quantitatively important amounts of RNA are actually produced. This phase is referred to as the transcriptional phase and lasts for a considerable amount of time. Typically, more than 1014 RNA molecules can be generated in a NASBA reaction.
If amplification is allowed to proceed over a long enough time period, the RNA formation rate starts to decrease due to depletion of the nucleotide pool and due to (thermal) degradation of the enzyme activity. For the current assay system, however, this moment is so late that there is no need to include it in the models.
Principles of quantitation
During the amplification process two types of RNA are present: the endogenous viral HIV-1 RNA (WT RNA) and a calibrator RNA (Q RNA) that is added to the sample in a fixed amount prior to extraction of the RNA from the sample. Both types of RNA are converted into cDNA, so that there is competition between the RNA types for the primer pool, and the relative amounts of RNA that were originally present in the sample determine the relative amounts of cDNA formed. As the amount of cDNA formed determines the RNA production rate in the transcriptional phase, the relative rates of RNA formation in this phase directly reflect the relative concentrations of WT and Q RNA in the sample. As the concentration of Q RNA is known, the WT level can be computed.
The antisense RNA molecules themselves are not detectable. Therefore, molecular beacons are added that bind to the RNA amplicons. This binding takes time. The shape of the fluorescence curve that is obtained depends on two processes: the NASBA-driven time-dependent growth in RNA levels and binding of the beacon to this RNA. In order to allow quantitation, both processes are modeled, yielding an equation for the fluorescence curve. The transcription rates are derived from this curve. A number of reference samples of which the HIV-1 RNA content is known are subjected to the assay to assess the relation between the transcription rates ratio on the one hand and the WT RNA concentration in the sample on the other.
MATHEMATICAL MODELING
In this part of the paper the relevant processes will be modeled. For the quantitation procedure the combined early exponential and late linear growth in RNA levels is crucial, so these properties will be dealt with first. Then the development of the fluorescence signal over time will be discussed.
NASBA-driven RNA growth
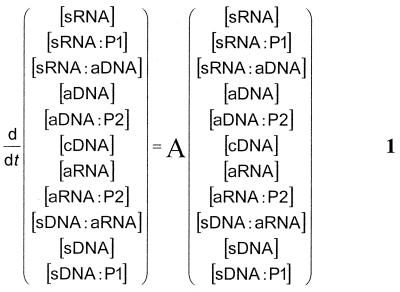
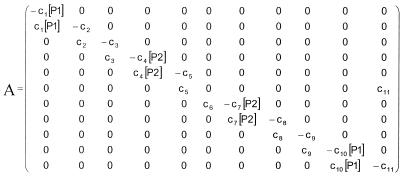
To model the major kinetic properties of the amplification process as depicted in Figure 2, a set of reaction rate equations has to be derived. As noted above, the initial concentrations of primers is at least 106 times higher than the total concentration of amplifiable RNA, so during the first phases of amplification they can be considered to be constant and not rate limiting. If in addition (pseudo) first order kinetics is assumed for each reaction, a set of linear differential equations is obtained. In the derivations below, the individual nucleic acid species are represented by abbreviations, with the prefix s for sense, a for antisense and c for copy. The individual reaction rate constants are represented by the symbols c1–c11 and the brackets [ ] indicate concentrations. The set of differential equations can be written in matrix notation as equation 1
with the matrix A defined according to 1
As noted, the primer concentrations [P1] and [P2] are considered to be constant in this phase of the amplification, hence their appearance in the matrix A. In general, the solution of such a set of linear first order differential equations can be written as ![]() νiexp(ξit), with ξi the eigenvalues of matrix A and νi reflecting eigenvectors. It can be shown that exactly one of the eigenvalues is positive and that the others are either real negative numbers or complex numbers with a negative real part. This latter is due to the fact that the T7 polymerase catalyzed reaction, reflected by c6, is considerably slower than the primer binding reactions reflected by c7[P2] and c10[P1]. It follows, after an initialization phase, that the single positive exponent term remains and growth is essentially exponential.
νiexp(ξit), with ξi the eigenvalues of matrix A and νi reflecting eigenvectors. It can be shown that exactly one of the eigenvalues is positive and that the others are either real negative numbers or complex numbers with a negative real part. This latter is due to the fact that the T7 polymerase catalyzed reaction, reflected by c6, is considerably slower than the primer binding reactions reflected by c7[P2] and c10[P1]. It follows, after an initialization phase, that the single positive exponent term remains and growth is essentially exponential.
When the primer pool is depleted, the reaction rate equations become much simpler. The only terms remaining for antisense RNA growth are
d[aRNA]/dt = c6[cDNA] 2
Since at this time point the concentration of cDNA is constant, it follows that the increase in antisense RNA levels is linear with time.
Obviously, between the phases described by equations 1 and 2 there is a transition phase in which the primer concentrations cannot be considered to be constant, as they decrease to zero. The set of equations 1 is no longer linear and the equations cannot be solved in general anymore. For the current modeling studies this is of minor importance; the distinction of the exponential and linear growth phases is the relevant issue. The time point of primer depletion marks the transition of these two growth phases.
Beacon binding to RNA: the central differential equation
Quantitation in the assay is based on detection of the molecular beacon signal that is generated after formation of the RNA:beacon hybrid (Fig. 1). This binding can be described by the simple chemical reaction scheme:
k2
R + B Z RB
k1
with R the antisense RNA species, B the molecular beacon and RB the RNA:beacon complex. The symbols k1 and k2 are the two reaction rate constants that describe the association and dissociation rates.
As the beacon binding reaction follows second order kinetics (8), the system can be described by the differential equation
d[RB(t)]/dt = k1[R(t)][B(t)] – k2[RB(t)] 3
with the brackets [ ] indicating concentrations, t the time and (t) indicating time dependency.
The design of the beacon is such that binding of the beacon to RNA proceeds rapidly, whereas dissociation proceeds relatively slowly. In addition, the RNA levels increase rapidly with time. Therefore, the contribution of the dissociation reaction can be ignored and k2 can be set to zero. The total concentration of beacon is constant and is referred to as Btot. These two considerations can be applied to differential equation 3, yielding
d[RB(t)]/dt = k1[R(t)]{Btot – [RB(t)]}.
This is a simple differential equation, which can be solved in general. It follows that
[RB(t)] = Btot – Iexp{–k1∫[R(t)]dt} 4
with I an integration constant, to be defined later.
The fluorescence signal
The total fluorescence signal is determined by the concentration of the RNA:beacon complex and the amount of signal generated by this hybrid. In addition, the free beacon contributes a signal and there is (potentially) some background signal. Therefore, the total fluorescence signal is given by
Y(t) = ɛ0 + ɛ1[B(t)] + ɛ2[RB(t)] = ɛ0 + ɛ1{Btot – [RB(t)]} + ɛ2[RB(t)], 5
with Y(t) the fluorescence signal as a function of time t, ɛ0 the background level signal and ɛ1 and ɛ2 the coefficients giving the amount of signal for the free and RNA-bound beacons. Note that it follows that ɛ1 < ɛ2 as the fluorescence signal increases after opening of the beacon.
Combining equations 4 and 5 yields
Y(t) = ɛ0 + ɛ2Btot –(ɛ2 – ɛ1)Iexp{–k1∫[R(t)]dt}. 6
An equation to describe NASBA-driven RNA growth
It is clear that equation 6 is not practically useful as long as no mathematically manageable equation can be given for the RNA levels [R(t)]. There is no need to include all individual reaction rate constants of equation 1 in this RNA growth describing equation, but it is of importance that this equation combines an initial exponential growth phase with a later linear growth phase. As the fluorescence levels start to plateau long before the nucleotide pool becomes rate limiting, there is no need to include a late plateau phase of the RNA levels in the equations.
An equation that combines an early exponential with a late linear growth and that is integratable as well is
[R(t)] = α1α2[eα2(t – α3)/(1 + eα2(t – α3))]ln(1 + eα2(t – α3)), 7
with α1, α2 and α3 the parameters that describe the growth (all positive). Equation 7 can be approximated by [R(t)] = α1α2e2α2(t – α3) for α2(t – α3) < –5.1 (exponential growth) and by [R(t)] = α1α22(t – α3) for α2(t – α3) > +4.4 (linear growth) with errors <1%. It follows that the transcription rate is given by α1α22. From equation 7 it follows that
∫[R(t)]dt = α1[ln(1 + eα2(t – α3))]2. 8
No integration constant is needed here as it can be incorporated in the constant I of equation 4.
Overall equations
Combining equations 6 and 8 yields an equation that describes the development of the fluorescence signal over time:
Y(t) = λY0 – (λ – 1)Y0exp{–k1α1[ln(1 + eα2(t – α3))]2}, 9
with λY0 = ɛ0 + ɛ2Btot and (λ – 1)Y0 = (ɛ2 – ɛ1)I, hence characterizing the integration constant I from equation 4. Equation 9 describes a fluorescence curve with horizontal asymptotes given by ![]() Y(t) = Y0 and
Y(t) = Y0 and ![]() Y(t) = λY0. The exact shape of the curve is defined by the values of α1 and α2, whereas α3 defines the location of the curve on the time axis.
Y(t) = λY0. The exact shape of the curve is defined by the values of α1 and α2, whereas α3 defines the location of the curve on the time axis.
Note that in equations 7–9 the time appears only relative to α3; the exact moment of the start of the reaction is not part of the equations. Note that the parameters k1 and α1 make their appearance as the product k1α1 only.
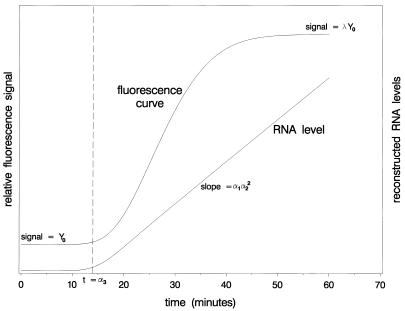
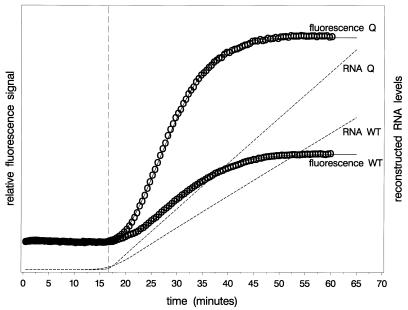
An example of a fluorescence curve and the corresponding RNA levels according to equations 7 and 9 is presented in Figure 3. Note that the fluorescence levels reach a plateau after ∼50 min due to exhaustion of the beacon pool, whereas the RNA levels still increase linearly with time.
Figure 3.
Theoretical example of a fluorescence curve with corresponding RNA growth curve according to equations 7 and 9. Some relevant quantities are indicated.
Interpretation of the α3 parameter
The parameter referred to as α3 has a clear physical interpretation. Using Matlab Simulink a simulation tool was developed (not shown) to quantitatively simulate the processes involved in the NASBA reaction. This simulation tool confirmed the initial exponential and later linear growth in RNA levels and revealed that the overall RNA curves could be described adequately by equation 7. In addition, it showed that the value of α3 is a good approximation of the time that the primer pool is depleted. Therefore, it is referred to as the ‘time to primer depletion’. Since WT and Q RNA make use of the same primer pool, it will be clear that a single value of α3 is used to describe both the WT and calibrator fluorescence curves.
THE QUANTITATION PROCEDURE
Determining the values of the kinetic parameters in an individual amplification result
During an amplification reaction with molecular beacons, the fluorescence signals of the WT and calibrator RNA are measured continuously. Both the time and the observed signals are monitored. When data collection is complete, the WT and calibrator curves are fitted using non-linear regression methods using equation 9. The two fluorescence curves are fitted simultaneously, as they share a common value of α3. In total nine different parameter values are fitted: Y0, λ, k1α1 and α2 for the WT curve, Y0, λ, k1α1 and α2 for the calibrator curve and the common value of α3. After the fit has been completed, the RNA growth curve according to equation 7 can be reconstructed.
Assessing the value of the quantitation variable
Now that the values of the relevant kinetic parameters have been assessed and the RNA growth curve reconstructed, the formation rate of RNA in the transcriptional phase can be computed. The ratio of the WT over Q RNA transcription rates defines the quantitation variable. From equation 7 it follows that the transcription rate is given by α1α22 (see also Fig. 3). As the values of k1 and α1 cannot be estimated separately (equation 9), it follows that the quantitation variable is defined as the k1α1α22 ratio.
Quantitation
From equation 2 it follows that the ratio of the transcription rates (i.e. the α1α22 ratio) depends on the ratio of the cDNA levels formed from both species of RNA (endogenous virus RNA and calibrator RNA). The ratio of the cDNA levels depends directly on the ratio of the concentrations entering amplification. As long as the ratio of the values of the k1 parameters for the two species of RNA is constant for a given batch, it follows that there is a direct relation between the RNA input ratio and the k1α1α22 ratio. To assess the exact relation with the concentration ratio in the original sample, a series of samples with known input levels and a fixed concentration of calibrator was subjected to the assay. The logarithm of the observed transcription rate ratio is plotted against the logarithm of the nominal input and a straight line is fitted through the data. The slope and intercept so obtained are used as batch parameters and are used for quantitation of unknown samples. The exact values depend on batch-dependent reagent properties, like the exact concentration of calibrator that is used, the quality of the enzymes, the properties of the molecular beacons (such as the value of the k1 parameter ratio) and others.
MATERIALS AND METHODS
To study the kinetics of RNA and DNA formation, the NASBA procedure as described elsewhere was used (11,12). The kinetics were studied using a well-defined RNA species used as calibrator Qa in the NucliSens HIV-1 QT assay, a non-homogeneous NASBA-based assay using end-point detection based on electrochemiluminescence (ECL). This calibrator RNA was subjected to amplification directly, without using any sample pretreatment steps like extraction. Using specific ECL probes, the total amount of antisense RNA and sense DNA formed can be studied. Amplification was performed under standard conditions (11,12) and was terminated after the required time period by placing the tubes on ice. For the current study the exact amounts formed are of minor importance, only the time dependency being relevant. The results are expressed as ECL counts.
Experiments using the molecular beacon-based assay were performed as described elsewhere (10,15).
RESULTS
Kinetics of NASBA-driven DNA and RNA growth
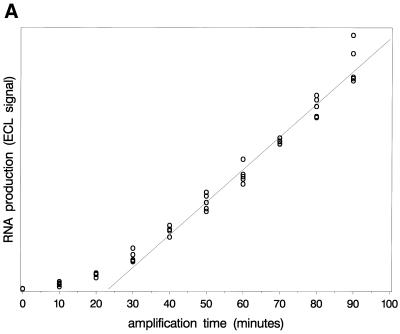
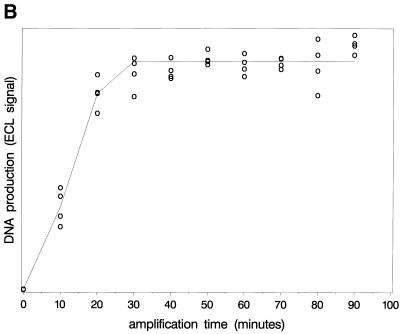
Figure 4 shows the observed ECL signals reflecting DNA and RNA growth. Note that the results confirm the predicted linear RNA growth after longer time periods. A straight line is fitted through the linear part, which crosses the time axis at ∼23 min. According to the principles described above, this is approximately the time point of primer depletion (α3). RNA production in the early phase is quantitatively too low to allow confirmation of the exponential growth phase. The DNA levels reach a plateau. Note that the observed value of α3 based on RNA growth is in line with the start of the plateau of the DNA levels.
Figure 4.
Observed levels of RNA (upper) and DNA (lower) during amplification. The amount of product formed was determined by measuring the ECL signal (arbitrary units). The figure shows the linear RNA growth and the timing of the plateau in DNA levels.
Beacon-based assay properties
An example of a set of fluorescence curves as obtained in a single amplification reaction using endogenous WT RNA and calibrator is presented in Figure 5. The figure is similar to Figure 3, but now real data are presented for both fluorescence curves simultaneously. The fluorescence curves were fitted to the model of equation 9 and the RNA growth curves were reconstructed using the parameter values so obtained with equation 7. Note that the parameter fitted is k1α1, whereas it is α1 that makes its appearance in the RNA growth equation (equation 7). Therefore, the reconstructed RNA growth curves as presented are defined up to some multiplication factor. The figure shows the linear increase in RNA levels with time. The slope of this part of the RNA growth curve forms the basis of quantitation.
Figure 5.
Example of a test result: two fluorescence curves and reconstructed RNA growth curves. The individual fluorescence measurements are indicated by circles, the fitted fluorescence curves by solid lines and the reconstructed RNA growth curves by dashed lines. The vertical reference line indicates the value of α3.
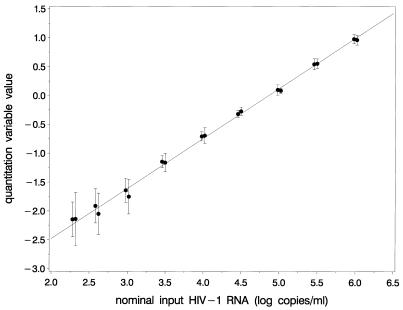
To study the relation between the logarithm of the estimated transcription rate ratio (the quantitation variable) and the logarithm of the input level, a dilution series of an in vitro cultured HIV-1 viral stock solution, in which the number of particles was quantitated by electron microscopy (11,16), was subjected to the beacon-based assay at two different test sites. A typical example is shown in Figure 6. A linear relation is obtained between the logarithm of the input and the quantitation variable value. The slope and intercept of this line are assessed using straightforward linear regression techniques and are used as batch parameters. In Figure 6 the dose–response relations as obtained using a single batch at two different sites are presented.
Figure 6.
The relation between the nominal HIV-1 RNA input tested and the observed logarithm of the k1α1α22 ratio (the quantitation variable) as obtained by assaying dilution series of a viral stock at two different sites with one batch. The results (means ± SD) are shifted somewhat to the left or right to increase readability.
DISCUSSION
In the current paper modeling has been described that forms the basis of quantitation procedures that can be used in a viral load assay using NASBA as the amplification technique and homogeneous detection using molecular beacons. A mathematical description of the processes involved yielded an equation that describes the dynamics of fluorescence signal development with time as a function of several kinetic parameters. The modeling is complicated by the fact that all processes proceed simultaneously. Kinetic measurements are often performed by monitoring the rate of (to take an example in this field) binding of beacon to a fixed amount of target RNA. The very nature of the NASBA system is of course that the RNA levels are not constant with time, so their levels should be modeled as well. The overall fluorescence curve is the combined result of NASBA-driven RNA growth and binding of the beacon to these continuously changing RNA levels. A number of approximations and assumptions were required to obtain a manageable equation describing the fluorescence. For example, Figure 2 represents a model of the complete NASBA scheme and in equation 1 all individual reactions are assumed to follow first order kinetics. In the light of this, an RNA growth curve (equation 7) could be designed that combines the major properties of early exponential and late linear growth with mathematical manageability (reflected by equation 8). Nevertheless, in spite of the approximations and assumptions, overall an equation was derived that gives an adequate description of the observed fluorescence curve. Also, it was found to provide a good basis for quantitation.
Figure 4 shows, amongst others, that the RNA levels are still increasing after 90 min amplification and that deviation from linear growth is not yet detectable. The amplification time used in the beacon-based NucliSens assay is only 60 min. This supports the claim that it is of no use to include in the equations the late plateau in RNA levels due to depletion of the nucleotide pool. The RNA growth curve as given by equation 7 does not include such a plateau.
The results shown in Figure 6 indicate that the dose–response relation is linear over at least 3.5 log. In addition, it shows that the lines are identical for both study sites, indicating that reader-to-reader differences and similar sources of variation play no role of any relevance.
A single fluorescence curve is described by five parameters, while for the simultaneous fit procedure nine parameters are used. Although this is quite a large number, it is clear that it cannot be reduced. After all, a curve is defined by the level of its start signal, its final plateau signal, the time point of the start of fluorescence growth and the steepness of the fluorescence curve. This already yields four parameters for a single curve. Then the shape of the lower bend is different from that of the upper bend and they bear no relation to one another as the molecular biological processes responsible for the two bends are fundamentally different. This introduces a fifth parameter.
As indicated, time makes its appearance in the equations in terms of t – α3 only. This is important from an experimental point of view. Due to this, it is not required to monitor the time between the start of the amplification (mixing of the components) and the start of the fluorescence measurements. Obviously, it is necessary to have a value of α3 large enough to allow estimation of the Y0 parameter values.
Note that the parameters k1 and α1 make their appearance in the final fluorescence describing equation only as the product k1α1. As a result, the quantitation variable is defined as the k1α1α22 ratio, although the k1 value has nothing whatsoever to do with the transcription rate. As long as the ratio of the k1 values for the endogenous WT RNA and the calibrator RNA can be considered to be constant, it does not matter due to the use of the batch parameters.
Apart from the NASBA-based system, other amplification-based systems using real-time detection are being developed making use of PCR technology (for example 17–21). Quantitation using (RT–)PCR and molecular beacons can be based on the so-called ‘cycle threshold’ CT, which is the number of cycles required to obtain a measurable signal (19–21). Due to the fundamentally different nature of the processes in NASBA, where all reactions proceed simultaneously and continuously, a different quantitation strategy is required. In addition, in the NASBA-based real-time assay a calibrator is used throughout the procedure to monitor procedural losses and to monitor the effects of unknown sample factors that might interfere with the amplification kinetics.
In conclusion, the major processes in the NASBA process and homogeneous detection using molecular beacons could be modeled and incorporated in a manageable mathematical model. This model was found to provide a good basis for quantification of endogenous WT RNA.
REFERENCES
- 1.O’Brien T.R., Blattner,W.A., Waters,D., Eyster,E., Hilgartner,M.W., Cohen,A.R., Luban,N., Hatzakis,A., Aledort,L.M., Rosenberg,P.S., Miley,W.J., Kroner,B.L. and Goedert,J.J. (1996) Serum HIV-1 RNA levels and time to development of AIDS in the Multicenter Hemophilia Cohort Study. J. Am. Med. Assoc., 276, 105–110. [PubMed] [Google Scholar]
- 2.O’Brien W.A., Hartigan,P.M., Martin,D., Esinhart,J., Hill,A., Benoit,S., Rubin,M., Simberkoff,M.S. and Hamilton,J.D. (1996) Changes in plasma HIV-1 RNA and CD4+ lymphocyte counts and the risk of progression to AIDS. N. Engl. J. Med., 334, 426–431. [DOI] [PubMed] [Google Scholar]
- 3.Mellors J.W., Munoz,A., Giorgi,J.V., Margolick,J.B., Tassoni,C.J., Gupta,P., Kingsley,L.A., Todd,J.A., Saah,A.J., Detels,R., Phair,J.P. and Rinaldo,C.R.,Jr (1997) Plasma viral load and CD4+ lymphocytes as prognostic markers of HIV-1 infection. Ann. Intern. Med., 126, 946–954. [DOI] [PubMed] [Google Scholar]
- 4.Aleman S., Visco-Comandini,D., Loré,K. and Sönnerborg,A. (1999) Long-term effects of antiretroviral combination therapy on HIV Type 1 DNA levels. AIDS Res. Hum. Retroviruses, 15, 1249–1254. [DOI] [PubMed] [Google Scholar]
- 5.Ginocchio C.C., Tetali,S., Washburn,D., Zhang,F. and Kaplan,M.H. (1999) Comparison of levels of human immunodeficiency virus type 1 RNA in plasma as measured by the NucliSens nucleic acid sequence-based amplification and Quantiplex branched-DNA assays. J. Clin. Microbiol., 37, 1210–1212. [DOI] [PMC free article] [PubMed] [Google Scholar]
- 6.Dyer J.R., Pilcher,C.D., Shepard,R., Schock,J., Eron,J.J. and Fiscus,S. (1999) Comparison of NucliSens and Roche Monitor assays for quantitation of levels of human immunodeficiency virus type 1 RNA in plasma. J. Clin. Microbiol., 37, 447–449. [DOI] [PMC free article] [PubMed] [Google Scholar]
- 7.Murphy D.G., Côté,L., Fauvel,M., René,P. and Vincelette,J. (2000) Multicenter comparison of Roche COBAS AMPLICOR MONITOR Version 1.5, Organon Teknika NucliSens QT with Extractor and Bayer Quantiplex Version 3.0 for quantification of human immunodeficiency virus type 1 RNA in plasma. J. Clin. Microbiol., 38, 4034–4041. [DOI] [PMC free article] [PubMed] [Google Scholar]
- 8.Tyagi S. and Kramer,F.R. (1996) Molecular beacons: probes that fluoresce upon hybridization. Nat. Biotechnol., 14, 303–308. [DOI] [PubMed] [Google Scholar]
- 9.Van de Wiel P., Top,B., Weusten,J. and Oosterlaken,T. (2000) A new, high throughput NucliSens assay for HIV-1 viral load measurement based on real-time detection with molecular beacons. XIII International AIDS conference, 9–14 July 2000, Durban, South Africa.
- 10.Van Beuningen R., Marras,S.A., Kramer,F.R., Oosterlaken,T., Weusten,J., Borst,G. and Van de Wiel,P. (2001) Development of a high throughput detection system for HIV-1 using real-time NASBA based on molecular beacons. In Raghavachari,R. and Tan,W. (eds), Genomics and Proteomics Technologies, Proceedings of SPIE. Society of Photo-Optical Instrumentation Engineers, Washington, DC, Vol. 4264, pp. 66–72.
- 11.Van Gemen B., Van Beuningen,R., Nabbe,A., Van Strijp,D., Jurriaans,S., Lens,P. and Kievits,T. (1994) A one-tube quantitative HIV-1 RNA NASBA nucleic acid amplification assay using electrochemiluminescent (ECL) labelled probes. J. Virol. Methods, 49, 157–168. [DOI] [PubMed] [Google Scholar]
- 12.Van Gemen B., Kievits,T., Nara,P., Huisman,H.G., Jurriaans,S., Goudsmit,J. and Lens,P. (1993) Qualitative and quantitative detection of HIV-1 RNA by nucleic acid sequence-based amplification. AIDS, 7 (suppl. 2), S107–S110. [DOI] [PubMed]
- 13.Compton J. (1991) Nucleic acid sequence-based amplification. Nature, 350, 91–92. [DOI] [PubMed] [Google Scholar]
- 14.Sooknanan R. and Malek,L.T. (1995) NASBA—a detection and amplification system uniquely suited for RNA. Biotechnology, 13, 563–564. [Google Scholar]
- 15.Leone G., Van Schijndel,H., Van Gemen,B., Kramer,F.R. and Schoen,C.D. (1998) Molecular beacon probes combined with amplification by NASBA enable homogeneous, real-time detection of RNA. Nucleic Acids Res., 26, 2150–2155. [DOI] [PMC free article] [PubMed] [Google Scholar]
- 16.Layne S.P., Merges,M.J., Dembo,M., Spouge,J.L., Conley,S.R., Moore,J.P., Raina,J.L., Renz,H., Gelderblom,H.R. and Nara,P.L. (1992) Factors underlying spontaneous inactivation and susceptibility to neutralization of human immunodeficiency virus. Virology, 189, 695–714. [DOI] [PubMed] [Google Scholar]
- 17.Nazarenko I.A., Bhatnagar,S.K. and Hohman,R.J. (1997) A closed tube format for amplification and detection of DNA based on energy transfer. Nucleic Acids Res., 25, 2516–2521. [DOI] [PMC free article] [PubMed] [Google Scholar]
- 18.Whitcombe D., Theaker,J., Guy,S.P., Brown,T. and Little,S. (1999) Detection of PCR products using self-probing amplicons and fluorescence. Nat. Biotechnol., 17, 804–807. [DOI] [PubMed] [Google Scholar]
- 19.Heid C.A., Stevens,J., Livak,K.J. and Williams,P.M. (1996) Real time quantitative PCR. Genome Res., 6, 986–994. [DOI] [PubMed] [Google Scholar]
- 20.Gibson U.E.M., Heid,C.A. and Williams,P.M. (1996) A novel method for real time quantitative RT-PCR. Genome Res., 6, 995–1001. [DOI] [PubMed] [Google Scholar]
- 21.Lewin S.R., Vesanen,M., Kostrikis,L., Herley,A., Duran,M., Zhang,L., Ho,D.D. and Markowitz,M. (1999) Use of real-time PCR and molecular beacons to detect virus replication in human immunodeficiency virus type 1-infected individuals on prolonged effective antiretroviral therapy. J. Virol., 73, 6099–6103. [DOI] [PMC free article] [PubMed] [Google Scholar]


