


Abstract
We have established the use of a primer extension/mass spectrometry method (the PinPoint assay) for high-throughput SNP genotyping of the human Y chromosome. 118 markers were used to define 116 haplogroups and typing was organised in a hierarchical fashion. Twenty multiplex PCR/primer extension reactions were set up and each sample could be assigned to a haplogroup with only two to five of these multiplex analyses. A single aliquot of one enzyme was found to be sufficient for both PCR and primer extension. We observed 100% accuracy in blind validation tests. The technique thus provides a reliable, cost-effective and automated method for Y genotyping, and the advantages of using a hierarchical strategy can be applied to any DNA segment lacking recombination.
INTRODUCTION
Single nucleotide polymorphisms (SNPs, a term which we use to include small insertions and deletions) are the markers of choice for many applications in medical and evolutionary genetics and even forensics. They are common, widespread and stable and can cause, or be linked to, phenotypes of interest. Nevertheless, the limited number of alleles present at each variable position (usually two) often necessitates the analysis of large numbers of SNPs, sometimes in large numbers of individuals. Many SNP genotyping methods have now been developed (1). The choice of method depends on the investigation, in particular the number of SNPs and the number of individuals entering the study. Some technologies are preferred when a small number of SNPs is tested in a large population, for example the TaqMan assay (2). High density DNA arrays have proved to be a powerful tool in large-scale analyses where hundreds or thousands of SNPs are typed in a few individuals (3) and represent a promising technology, but have the disadvantage that they cannot be constructed by individual laboratories or modified to include new markers. Matrix-assisted laser desorption ionization time-of-flight (MALDI-TOF) mass spectrometry (MS) has recently been developed as a tool for SNP analysis and, although it requires a major item of equipment, several MALDI-based assays have been described (4–10). Among these methods the PinPoint assay (5) is particularly promising since it allows a high degree of multiplexing. This method is based on the addition of a single nucleotide to a genotyping primer complementary to a PCR target. The 3′-end of the genotyping primer terminates immediately upstream of the polymorphic site. Determination of the mass of the primer extension product reveals which nucleotide has been added. However, this approach has two limitations. Firstly, the mass difference between the nucleotides added can be as small as 9 Da (the difference between ddA and ddT) and, while a mass difference of this size can readily be detected, it can be difficult to distinguish between the A/T and the A/A or T/T genotypes (7). The second problem is the high level of purification required for the analysis of DNA by MALDI.
We wished to establish a genotyping method for the human Y chromosome. The absence of recombination along most of its length makes it a powerful tool to study human evolution, forensics and Y-associated diseases (11). Although the discovery of Y sequence variation has been slow until recently, a large number of SNPs are now available (12). These binary markers define a well-supported and stable phylogenetic tree, which allows a simple screening strategy to be used. We designed our typing method with two features in mind. Firstly, we needed to type all of the chosen markers, so that all branches of the tree would be included: a method that typed, for example, 90% of markers would not be adequate. Secondly, it would be used to type the same set of markers in a large number of samples, so it would be worth investing time and effort in establishing an efficient method.
Here we have adapted the PinPoint assay for this purpose. The problem of A-T heterozygosity does not arise since the Y chromosome is haploid; Y genotypes are thus haplotypes and are referred to here as ‘haplogroups’. The purification requirement was overcome using a commercial kit which allows sample preparation for MALDI in 96-well format. We have therefore been able to establish an efficient method and validate it by blind typing of well-characterised samples from diverse world-wide populations.
MATERIALS AND METHODS
Multiplex PCRs
Most of the PCR primers (Table S1) were redesigned using the Primer3 program (http://www-genome.wi.mit.edu/cgi-bin/primer/primer3_www.cgi). A modified version of the protocol described by Belgrader and colleagues (13) was used for PCR. In this procedure the amplification takes place in two stages. In the first, primers consisting of a common 5′-end corresponding to zip code primer sequences of 21 or 22 bases, followed by a locus-specific sequence, are used at very low concentration. After 15 cycles, these primers are expected to be entirely incorporated into PCR products which thus have similar concentrations and the same 5′-end sequences. In the second stage, a high concentration of the zip code primers is added and the reaction is continued for another 30 cycles. In this way, even concentrations of the different products are maintained. The reaction was performed under universal conditions in a volume of 12.5 µl containing Bioline buffer [16 mM (NH4)2SO4, 67 mM Tris–HCl, pH 8.8, 0.01% Tween-20], 5 mM MgCl2, 400 µM each dNTP, ∼0.08 µM each primer, 1.25 U Biolase Diamond DNA Polymerase (Bioline) and 60 ng genomic DNA. The reaction consisted of denaturation at 94°C for 3 min, followed by 15 cycles of 94°C for 30 s, 59°C for 30 s and 72°C for 1 min, with a final extension at 72°C for 3 min. An equal volume of complete PCR buffer containing 1 µM zip code primers (ZipALg1, ggagcacgctatcccgttagac; ZipBLg2, cgctgccaactaccgcacatg) and 1.25 U enzyme was added and cycled for an additional 30 rounds as above, except that the annealing temperature was 55°C. The only modifications found to be necessary to this standard procedure were adjustments of the primer concentrations, described below, and use of the hot-start enzyme Immolase DNA Polymerase (Bioline) for multiplex PCRs numbers 11 and 15, which required an initial cycle of 7 min at 95°C. Thus, in establishing a new multiplex reaction, an initial trial would be carried out with all primers at 0.08 µM and the products examined on a gel. Primers corresponding to faint or undetectable bands were then increased in concentration and the products re-examined; this step was repeated until all bands were clearly visible and differed in molar concentration by less than 5-fold. Once established, the required primer concentrations (Table S1) were highly reproducible, except for degraded samples.
Multiplex primer extensions
PCR primers and dNTPs were removed by adding a ‘polishing reagent’, consisting of a phosphatase and an exonuclease (0.5 µl of Applied Biosystems 4313751 or 1 µl of Amersham Pharmacia USB 78201), to 2.5 µl of PCR products and incubation for 20 min at 37°C followed by inactivation for 20 min at 85°C. The primer extension reaction was performed by adding to the ‘polished’ PCR product a mixture containing the Biolase Diamond buffer, 5 mM MgCl2, 20 µM each ddNTP, 1 µM each genotyping primer in a final volume of 10 µl. The reaction consisted of 30 cycles of 94°C for 30 s, 37°C for 30 s and 72°C for 20 s. The genotyping primers were designed manually and are listed in Table S1. They were checked for self/cross-extension using a web-run program (http://eatworms.swmed.edu/~tim/primerfinder/) and tested experimentally in a ‘self-extension reaction’, where no PCR template was added to the primer extension mixture. Generally, no enzyme was added, but 1 U Biloase Diamond was included in the extension mix when the PCR products were obtained with Immolase DNA Polymerase.
The primer extension products were desalted using a nucleic acid purification kit (Applied Biosystems 4313108) with 96-well spin plates (Applied Biosystems 4315438) following the manufacturer’s instructions.
Mass spectrometry
One microlitre of each sample was transferred from the microtitre plate to the inner 64 wells of a 100-well mass spectrometry plate (only these wells were fully accessible to the laser) using an eight channel Impact2 Equalizer 384 pipette (Matrix) and mixed with 1 µl of 2,4,6-trihydroxyacetophenone (THAP) (Applied Biosystems 4315786). Masses of genotyping primers and extension products were determined using a Voyager Elite DE MALDI-TOF MS workstation (PerSeptive Biosystems) in linear mode. Spectrum acquisition was completely automated, set to accumulate the first three spectra passing the acceptance criterion of a signal-to-noise ratio of 10:1. Each spectrum was derived from 35 laser shots in the same position, and after acquisition the plate was moved according to a search pattern to a different position in the same sample spot until the three spectra had been obtained. The spectra were analysed with the Data Explorer software package (PerSeptive Biosystems), using a macro that labels the primer peaks and then finds and labels the extension peaks. A macro for each multiplex was created resulting in a completely automated calling of the primers and the extension products.
DNA samples
Thirty samples of male genomic DNA, representing world-wide diversity (http://www.arl.arizona.edu/lmse/lmseycc.html) and previously assigned to haplogroups using other methods, were tested with this assay.
Sequencing
Sequencing was carried out by the sequencing service of the Department of Biochemistry, University of Oxford (http://polaris.bioch.ox.ac.uk/dnaseq/index.cfm).
RESULTS
Strategy
Our genotyping strategy is based on the known stable phylogeny of the Y chromosome. There is no recombination on the Y chromosome outside the pseudo-autosomal regions and SNP mutation rates are low, so screening can be carried out in a hierarchical fashion, starting at the most basal branches of the tree and proceeding along the relevant branch to the tip (Fig. 1). A collection of 167 SNPs, incorporating many of those previously published, has recently been described (12), and these define 116 haplogroups. We first selected 118 markers (103 base substitutions, 11 deletions, three insertions and one complex rearrangement) which allowed all 116 haplogroups to be identified. We next assembled them into moderately sized multiplexes for both PCR amplification and primer extension. We could then place any Y chromosome into one of the 116 haplogroups using between two and five successive genotyping reactions.
Figure 1.

Hierarchical screening strategy. The tree shows the Y chromosomal phylogeny defined by 167 markers, represented here by 118 SNPs (numbers on tree) identifying 116 haplogroups (italic numbers on the right side). The SNPs included in each multiplex are grouped in a grey area marked with the multiplex number (large bold type) from Table S1.
Genotyping procedure
The genotyping procedure involves the following steps: multiplex PCR of the regions spanning the markers, enzymatic purification of the PCR products (‘polishing’), multiplex single base primer extension, DNA purification and analysis of primer extension products by MALDI-TOF MS.
Twenty different multiplex reactions were designed. Each multiplex amplified between three and eight fragments and allowed the typing of between three and nine markers, because some fragments contained more than one SNP. Most locus-specific PCR primers differed from those published and were redesigned so that they would produce bands of distinguishable sizes (in the range 135–567 bp), allowing amplification to be monitored by gel electrophoresis (Fig. 2).
Figure 2.
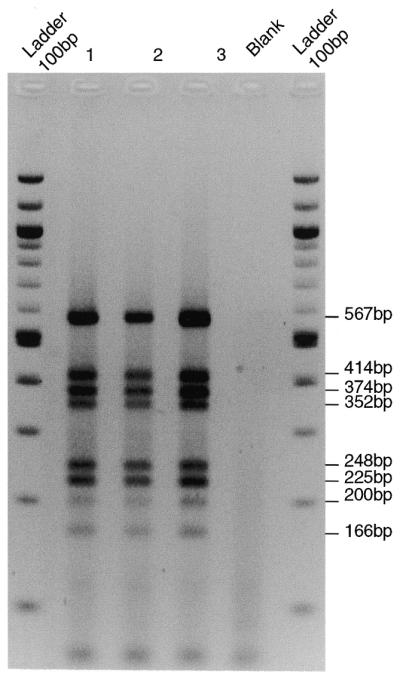
Multiplex PCR products. Products generated with multiplex 9 from three individuals (tracks 1–3) or a sample lacking DNA (Blank) were analysed by electrophoresis on a 3% agarose gel and visualised by ethidium bromide staining. Eight bands are seen, as expected (right side).
Genotyping primers between 15 and 20 bases long were designed so that the masses of all primers and extension products in a multiplex were separated by at least 40 Da and were thus readily distinguished in the mass spectrometer. A suitable primer could be found on one or the other strand in most cases. For 11 primers it was necessary to introduce a mismatch near the 5′-end (where it would have little effect on primer binding) in order to achieve this separation, or to reduce complementarity detected in silico. When we needed to increase the separation of primers and extension products, the mass of the heavier one was increased by replacing a light base with a heavier one or, alternatively, the mass of the lighter primer was decreased. Substitutions that introduced a T were favoured because T is resistant to fragmentation during MALDI-TOF (14), e.g. C→T to increase mass and A→T or G→T to decrease mass. To reduce complementarity to no more than 3 bp between the 3′-end of a primer and a second region of any primer in the same mix, a base substitution was made in the second region, again favouring the introduction of a T. The pools were then tested experimentally for self-extension arising from self- or cross-complementarity. In two cases self-extension was seen, and for both a primer from the complementary strand was satisfactory. Primer sequences and multiplex combinations are shown in Table S1.
Three aspects of the genotyping reaction were then explored: the enzymes used for PCR and primer extension, the matrix and the acquisition of data from the mass spectrometer. We tested five enzymes for PCR [Biolase Diamond DNA Polymerase (Bioline), Immolase DNA Polymerase (Bioline), AmpliTaq Gold (Applied Biosystems), AmpliTaq DNA Polymerase Stoffel Fragment (Applied Biosystems) and HotStarTaq DNA Polymerase (Qiagen)] and four for primer extension [Tth DNA Polymerase (Applied Biosystems), AmpliTaq DNA Polymerase Stoffel Fragment (Applied Biosystems), Biolase Diamond DNA Polymerase (Bioline) and HotStarTaq DNA Polymerase (Qiagen)]. Immolase, a hot-start enzyme, gave the best amplification, but Biolase Diamond DNA Polymerase was used preferentially because it provided satisfactory amplification in most cases and also performed multiplex extension. Indeed, the Biolase enzyme survived the polishing purification step between amplification and extension. It was thus unnecessary to add additional enzyme for extension, leading to a significant cost reduction. When a hot-start enzyme was used for PCR, no extension was seen with the recommended enzymes Tth DNA Polymerase (Sequazyme Pinpoint SNP Assay Kit; Applied Biosystems) and DNA Polymerase Stoffel Fragment (5), but extension was obtained with Biolase Diamond DNA Polymerase. Two MALDI matrices were compared: THAP and 3-hydroxypicolinic acid. THAP was preferred because it gave more even crystallization, increasing the data acquisition speed in automated mode, as also reported elsewhere (15). Different mass spectrometer data acquisition modes were investigated. Each spectrum takes ∼12 s to acquire and over 100 spectra can be generated from different positions in the same sample spot. The mass spectrometer was therefore set to accumulate and save the first three spectra that passed our chosen acceptance criterion. This took 1 min/sample, on average.
Validation
All 20 pools showed the expected extension products. Typical results are presented in Figure 3. To test the accuracy of this assay, we carried out blind typing of 30 diverse samples which had previously been genotyped with the entire set of markers by other methods. These individuals required between two and four multiplex reactions each and used 15 of the 20 multiplexes, requiring just 78 PCRs/extensions in all. Samples were assigned to 14 different haplogroups. Twenty-nine out of the 30 samples gave the expected results, but one showed a single discrepancy at a single locus, where our typing revealed the derived C allele instead of the expected ancestral G allele at the M35 locus [according to the terminology of Underhill et al. (12), which uses the opposite strand from Table S1 for this locus]. Sequencing showed that a C was indeed present at this position (S.Paracchini, unpublished observations) and thus that the discrepancy was a result of previous mistyping or sample mix-up; the accuracy of the MS method was 100%. The complete set of 3540 SNPs (118 in 30 chromosomes) was evaluated, but only 492 needed to be tested experimentally because of our hierarchical strategy.
Figure 3.

Multiplex primer extension products analysed by mass spectrometry. (A) Multiplex 1, individual 1. (B) Multiplex 1, individual 2. (C) Multiplex 4, individual 3. Automatic calling of primers (-P) or SNPs (-A, -C, -G, -T) is shown within the body of each section and the expected positions are shown at the top. Asterisks indicate prominent depurination products. The allelic differences for the same multiplex between individuals 1 and 2 can be seen.
DISCUSSION
We have established a quick and efficient method for SNP genotyping of the human Y chromosome which places samples in one of 116 haplogroups after between two and five multiplex reactions. All 118 markers investigated could be typed by this method, although for 2/118 the first genotyping primer tested was unsatisfactory because of extension in the absence of template due to self-complementarity, and it was necessary to use the primer from the complementary strand. The proportion of SNPs that cannot be typed at all because both primers are unsatisfactory is likely to be very low.
Our typing strategy maximises efficiency by its hierarchical organisation, but does this sacrifice information? Recurrent mutations on branches that are not typed will be missed, but haplogroup assignment will always be correct. Such recurrent mutations are rare and generally the large benefits of saving DNA, time and expense will outweigh any small loss of information. For samples where typing of all 118 markers is required, this can still be achieved in 20 reactions. The use of multiplexes has the additional advantage of reducing the risk of errors in associating SNP allelic states into haplogroups, and the automated calling of the peaks further reduces opportunities for human error.
Typing is thus very accurate. Haplogroup assignment, implying correct typing of all 118 markers, was 100% correct in all samples tested and actually revealed an error in the previous data. Several factors contribute to this accuracy. Failure to amplify or extend produces only the primer peak in the mass spectrum and cannot be misinterpreted as the presence of one of the alleles. Spurious peaks are sometimes generated by depurination (Fig. 3A and B, asterisks), but can all be distinguished from primers and extension products by their mass. Mixed samples are sometimes encountered, usually as a result of unintentional sample contamination, and these can readily be recognised. Heterozygotes, where A and T extensions can be difficult to distinguish, do not occur on the Y chromosome. Nevertheless, duplicated Y loci can potentially produce two extension products from a single primer, which might lead to similar confusion. Duplicated loci were rare among the Y markers used and none involved the addition of an A or a T to the same primer. If there was such a case, a mass-tagged ddA analogue could be used (7). Potential A/T confusion is avoided in different ways by other MALDI-TOF methods (4,10), but it is unclear whether a high degree of multiplexing can be achieved using such methods.
Throughput is high: at 1 min/sample, an average of six SNPs per multiplex and automated sample spotting and MS plate changing, more than 8000 SNPs/day could be typed. The major expenses are the enzymes and purification kit; we estimate that the consumables cost per SNP was ∼30 p (∼US$ 0.4) under the conditions used. This could be reduced to ∼17 p (∼US$ 0.24) per SNP by reducing the PCR volume to 2.5 µl (the minimum required) and re-using the 96-well spin plates. These costs compare favourably with other methods. All PCRs are carried out under the same standard conditions and we have found that additional loci can be incorporated into the multiplex reactions, making it flexible enough to accommodate new markers that may be discovered in the future.
Although access to a MALDI-TOF mass spectrometer is required, our strategy of hierarchical multiplex PCR and primer extension reactions can readily be adapted for other platforms, for example by using fluorescently labelled ddNTPs. A hierarchical screening strategy can be applied to any non-recombining DNA segment. While this would seem to limit it to the Y chromosome and mitochondrial DNA in humans, it has recently been suggested that recombination in autosomal DNA is largely or entirely confined to small ‘hot-spots’, so that most SNPs lie in discrete segments where there is little or no recombination (16). If this is true, each segment could be screened in a hierarchical fashion. In our analysis complete information for 30 individuals with 118 markers (3450 SNPs) was obtained by typing only 492 SNPs and inferring the state at the remainder: a 7-fold reduction. In a large-scale genotyping project this would produce significant savings.
We conclude that this method provides a high-throughput assay to genotype the Y chromosome that is accurate, robust, reliable, flexible, cost-effective and lends itself to automation.
SUPPLEMENTARY MATERIAL
Supplementary Material is available at NAR Online.
Acknowledgments
ACKNOWLEDGEMENTS
We thank Ed Southern for discussions and comments on the manuscript, M. Sohail for advice and Martin Johnson for maintaining the mass spectrometer. S.P and C.T.-S. were supported by the CRC. B.A. was supported by the Immunohematology Laboratory, Istituto di Medicina Legale, Università Cattolica del Sacro Cuore, Rome, Italy.
REFERENCES
- 1.Gut I.G. (2001) Automation in genotyping of single nucleotide polymorphisms. Hum. Mutat., 17, 475–492. [DOI] [PubMed] [Google Scholar]
- 2.Ranade K., Chang,M.S., Ting,C.T., Pei,D., Hsiao,C.F., Olivier,M., Pesich,R., Hebert,J., Chen,Y.D., Dzau,V.J. et al. (2001) High-throughput genotyping with single nucleotide polymorphisms. Genome Res., 11, 1262–1268. [DOI] [PMC free article] [PubMed] [Google Scholar]
- 3.Wang D.G., Fan,J.B., Siao,C.J., Berno,A., Young,P., Sapolsky,R., Ghandour,G., Perkins,N., Winchester,E., Spencer,J. et al. (1998) Large-scale identification, mapping and genotyping of single-nucleotide polymorphisms in the human genome. Science, 280, 1077–1082. [DOI] [PubMed] [Google Scholar]
- 4.Buetow K.H., Edmonson,M., MacDonald,R., Clifford,R., Yip,P., Kelley,J., Little,D.P., Strausberg,R., Koester,H., Cantor,C.R. et al. (2001) High-throughput development and characterization of a genomewide collection of gene-based single nucleotide polymorphism markers by chip-based matrix-assisted laser desorption/ionization time-of-flight mass spectrometry. Proc. Natl Acad. Sci. USA, 98, 581–584. [DOI] [PMC free article] [PubMed] [Google Scholar]
- 5.Haff L.A. and Smirnov,I.P. (1997) Single-nucleotide polymorphism identification assays using a thermostable DNA polymerase and delayed extraction MALDI-TOF mass spectrometry. Genome Res., 7, 378–388. [DOI] [PMC free article] [PubMed] [Google Scholar]
- 6.Little D.P., Braun,A., Darnhofer-Demar,B., Frilling,A., Li,Y., McIver,R.T.,Jr and Koster,H. (1997) Detection of RET proto-oncogene codon 634 mutations using mass spectrometry. J. Mol. Med., 75, 745–750. [DOI] [PubMed] [Google Scholar]
- 7.Fei Z., Ono,T. and Smith,L.M. (1998) MALDI-TOF mass spectrometric typing of single nucleotide polymorphisms with mass-tagged ddNTPs. Nucleic Acids Res., 26, 2827–2828. [DOI] [PMC free article] [PubMed] [Google Scholar]
- 8.Griffin T.J., Hall,J.G., Prudent,J.R. and Smith,L.M. (1999) Direct genetic analysis by matrix-assisted laser desorption/ionization mass spectrometry. Proc. Natl Acad. Sci. USA, 96, 6301–6306. [DOI] [PMC free article] [PubMed] [Google Scholar]
- 9.Kokoris M., Dix,K., Moynihan,K., Mathis,J., Erwin,B., Grass,P., Hines,B. and Duesterhoeft,A. (2000) High-throughput SNP genotyping with the Masscode system. Mol. Diagn., 5, 329–340. [DOI] [PubMed] [Google Scholar]
- 10.Sauer S., Lechner,D., Berlin,K., Lehrach,H., Escary,J.L., Fox,N. and Gut,I.G. (2000) A novel procedure for efficient genotyping of single nucleotide polymorphisms. Nucleic Acids Res., 28, e13. [DOI] [PMC free article] [PubMed] [Google Scholar]
- 11.Jobling M.A. and Tyler-Smith,C. (2000) New uses for new haplotypes: the human Y chromosome, disease and selection. Trends Genet., 16, 356–362. [DOI] [PubMed] [Google Scholar]
- 12.Underhill P.A., Shen,P., Lin,A.A., Jin,L., Passarino,G., Yang,W.H., Kauffman,E., Bonne-Tamir,B., Bertranpetit,J., Francalacci,P. et al. (2000) Y chromosome sequence variation and the history of human populations. Nature Genet., 26, 358–361. [DOI] [PubMed] [Google Scholar]
- 13.Belgrader P., Marino,M., Lubin,M. and Barany,F. (1996) A multiplex PCR-ligase detection reaction assay for human identity testing. Genome Sci. Tech., 1, 77–87. [Google Scholar]
- 14.Haff L.A. and Smirnov,I.P. (1997) Multiplex genotyping of PCR products with MassTag-labelled primers. Nucleic Acids Res., 25, 3749–3750. [DOI] [PMC free article] [PubMed] [Google Scholar]
- 15.Bray M.S., Boerwinkle,E. and Doris,P.A. (2001) High-throughput multiplex SNP genotyping with MALDI-TOF mass spectrometry: practice, problems and promise. Hum. Mutat., 17, 296–304. [DOI] [PubMed] [Google Scholar]
- 16.Goldstein D.B. (2001) Islands of linkage disequilibrium. Nature Genet., 29, 109–111. [DOI] [PubMed] [Google Scholar]
Associated Data
This section collects any data citations, data availability statements, or supplementary materials included in this article.