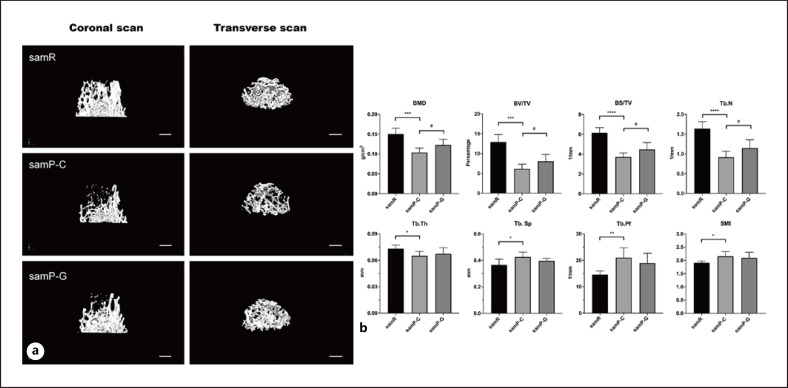
Fig. 1.
a Representative images of trabecular microarchitecture of distal femurs in mice evaluated by micro-CT. Both coronal and transverse image reconstruction demonstrate the bone loss in SAMP6 mice relative to SAMR1 mice, while the bone loss was alleviated after administration of GLP-2 in SAMP6 mice. n = 11 for samR and n = 6 per group for samP-C and samP-G mice. Bar: 500 μm. b Quantitative histomorphometric analysis of bone mineral density (BMD), bone volume/tissue volume (BV/TV), bone surface/tissue volume (BS/TV), trabecular number (Tb.N), trabecular thickness (Tb.Th), trabecular separation (Tb.Sp), trabecular pattern factor (Tb.Pf), and structure model index (SMI) in each group. n = 6 for samR and n = 8 per group for samP-C and samP-G mice. Data are presented as mean ± SD *p < 0.05, **p < 0.01, ***p < 0.001, and ****p < 0.0001 versus samR group, #p < 0.05 versus samP-G group. samR, senescence-accelerated mouse resistant 1 (SAMR1); samP-C, senescence-accelerated mouse prone 6 treated with normal saline (SAMP6+NS); samP-G, senescence-accelerated mouse prone 6 treated with GLP-2 (SAMP6+GLP-2).

