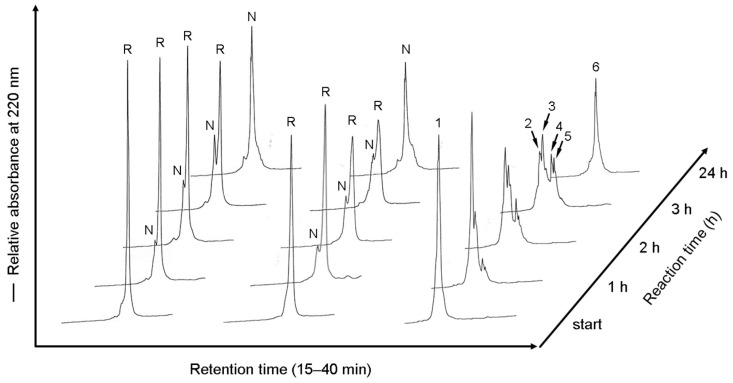
Figure 4.
RP-HPLC profiles of refolding mixtures of the [K8D]-proCCN′ protein. Reaction mixtures without treatments are shown in the left lane. The refolding mixtures were treated with N-ethylmaleimide (middle) or the Male-Arg5-Tyr-NH2 reagent (right) at each time point. “R” and “N” represent the fully reduced and native forms of the [K8D]-proCCN′ protein. RP-HPLC analyses were performed using a TSKgel Protein C4-300 column and the acetonitrile concentration was increased from 27.5% to 40% for 25 min. Peaks 1–5 (right column) were determined by mass spectrometric analyses, as summarized in Table 1.

