

Abstract
Background:
Elexacaftor/tezacaftor/ivacaftor (ETI) improves pulmonary disease in people with cystic fibrosis (PwCF), but its effect on gastrointestinal symptoms, which also affect quality of life, is not clear.
Methods:
PROMISE is a 56-center prospective, observational study of ETI in PwCF >12 years and at least one F508del allele. Gastrointestinal symptoms, evaluated by validated questionnaires: Patient Assessment of Upper Gastrointestinal Disorders-Symptom (PAGI-SYM), Patient Assessment of Constipation-Symptom (PAC-SYM), Patient Assessment of Constipation-Quality of Life (PAC-QOL)), fecal calprotectin, steatocrit and elastase-1 were measured before and 6 months after ETI initiation. Mean difference and 95% confidence intervals were obtained from linear regression with adjustment for age and sex.
Results:
438 participants fully completed at least 1 questionnaire. Mean (SD) for baseline PAGI-SYM, PAC-SYM, and PAC-QOL total scores were 0.56 (0.59), 0.47 (0.45), and 0.69 (0.53) out of maximum 5, 4, and 5, respectively (higher score indicates greater severity). Corresponding age- and sex-adjusted 6 months mean changes (95% CI) in total scores were −0.15 (−0.21, −0.09) for PAGI-SYM, −0.14 (−0.19, −0.09) for PAC-SYM, and −0.15 (−0.21, −0.10) for PAC-QOL. While statistically significant, changes were small. More robust improvements were found in participants with higher baseline symptom scores. Fecal calprotectin showed a change (95% CI) from baseline of −66.2 μg/g (−86.1, −46.2) at 6 months, while fecal elastase and steatocrit did not meaningfully change.
Conclusions:
After 6 months of ETI, fecal markers of inflammation decreased. Gastrointestinal symptoms improved, but the effect size was small except for PwCF with severe symptoms at baseline. Pancreatic insufficiency did not improve.
Keywords: Modulators, Patient-reported outcomes measures, Inflammation, Pancreatic insufficiency
Introduction1
Cystic fibrosis (CF) is an autosomal recessive inherited disease that affects many organs of the body and significantly reduces lifespan(1). While death in CF is usually associated with pulmonary disease, gastrointestinal disease is a central feature of CF(2). PwCF may experience pancreatic insufficiency, dehydrated intestinal secretions, dysmotility, and/or chronic intestinal inflammation(3). Abdominal pain, bloating, abnormal stools, constipation, and gastroesophageal reflux are found in as many as 80% of PwCF(4). These problems impact quality of life and maintenance of optimal nutrition in PwCF(2, 3).
CFTR modulators are designed to improve the function of CFTR protein produced by mutated genes(5). Elexacaftor/tezacaftor/ivacaftor (ETI) improves processing and trafficking of the defective Phe508del CFTR protein, and augments channel gating at the cell surface(5). ETI improved forced expiratory volume in one second percent predicted (FEV1pp) and body mass index (BMI) with minimal serious side effects in children and adults homozygous or heterozygous for Phe508del(6).
The PROMISE study is designed to investigate the clinical effectiveness of ETI on biological and clinical outcomes in PwCF, including gastrointestinal outcomes such as intestinal inflammation, pancreatic function, and gastrointestinal symptoms(7). The effect of ETI as treatment for PwCF on gastrointestinal disease, which may begin early in life, or in utero(8, 9), is unknown. Herein, we report 6-month outcomes of ETI on gastrointestinal symptoms, pancreatic exocrine function and intestinal inflammation.
Methods
Target population:
Study procedures for PROMISE (NCT04038047) were approved by the appropriate Institutional Review Board for all sites. Briefly, 56 U.S. CF Foundation-accredited CF centers participated in the study(7, 10). Participants were 12 years of age or older, had at least one Phe508del mutation and had qualified for and been prescribed ETI after it was FDA-approved. There were no unique exclusion or inclusion criteria for PROMISE-GI. Use of key gastrointestinal medications, such as pancreatic enzyme replacement therapy, acid suppression, antibiotics, probiotics, and laxatives, were recorded and were unchanged for 2 weeks before and during study. Baseline measurements were taken before the initiation of ETI (baseline) and at 1, 3 and 6 months. PROMISE included a liver component, which will be reported separately.
Anthropometric measures:
Weight and height were measured by the CF clinic scales and stadiometer. BMI was calculated as weight (kg)/height (m)2. Report of 6 month anthropometrics are published (10).
Gastrointestinal symptom frequency and severity:
Gastrointestinal symptom frequency and severity were measured using Patient-Reported Outcome Measures (PROMs) using three validated gastrointestinal questionnaires and one stool-specific questionnaire (SSQ). The Patient Assessment of Upper Gastrointestinal Disorders-Symptom severity Index (PAGI-SYM) is a 20-item questionnaire scored on a 6-point Likert response scale ranging from 0 (none) to 5 (very severe) that focuses on upper gastrointestinal symptoms(11). The Patient Assessment of Constipation-Symptom Severity Index (PAC-SYM) is a constipation specific questionnaire that focuses on characteristics of constipation and contains 12 separate questions rated on a 5-point Likert scale from 0 (absent) to 4 (very severe)(12). The Patient Assessment of Constipation-Quality of Life (PAC-QOL) is a 28-question instrument focused on the impact of constipation on patients’ quality of life during a two-week period, rated on a 6-point Likert scale from 0 (lowest QOL) to 5 (highest QOL)(13). The SSQ consists of 4 questions referring to the previous week: stool type using the Bristol Stool Scale, number of bowel movements, self-assessed bowel patterns, and stool leakage(14). Participants completed the PROMs electronically within the specified questionnaire completion windows using the Medidata ePro application onto their smartphones or tablet computers(14). The Minimal Clinically Important Difference (MCID) for PAGI-SYM is not established, but for PAC-SYM, using anchor-based methodology, the MCID was −0.6(15).
Stool studies:
A subset of PROMISE sites (N=18) participated in collection of fecal specimens. The PROMISE participants at these sites collected fecal specimens at home, using supplies provided by the study. The specimens were stored briefly in the home freezer, transferred to −80° storage at a central lab, batched and measured for fecal calprotectin (marker of intestinal inflammation), steatocrit (a measure of stool fat; for participants on adequate pancreatic enzyme therapy elevated steatocrit suggests non-pancreatic fat malabsorption), and pancreatic elastase-1 (marker of exocrine pancreatic function). Fecal samples were collected at baseline, 1, 3, and 6 months. Fecal calprotectin was performed using PhysiCal ELISA Test (Genova Diagnostics, Inc., USA), reported in μg/g feces. Steatocrit was performed as previously described, reported as fat % of total fecal volume(16). Fecal elastase-1 was performed using ScheBo-Biotech monoclonal assay (Glessen, Germany), reported as μg/g feces.
Statistical Analysis
Participants meeting all eligibility criteria and with at least one fully completed PROM were considered in our analysis. The distributions of total and domain scores on the PAGI-SYM, PAC-SYM, and PAC-QOL, as well as the frequencies of items on the SSQ were summarized for baseline and follow-up visits. Baseline PROM results were reported descriptively. Our primary analysis focused on the changes in PROM scores at 6 months, which were evaluated in linear regression models with adjustments for age group at enrollment (<18, ≥18 to <30, and ≥30 years) and sex at birth. Similar results were derived for earlier follow-up times at 1 month and 3 months. Additionally, we reported 6-month changes in 6 subgroups defined by age groups and sex at birth.
For the participants with data on fecal biomarkers, distributions of fecal data were summarized overall and in subgroups defined by age group at enrollment, sex at birth, or prior modulator use (none vs. any modulator at baseline). Reportable range for fecal calprotectin is from 15.625 to 250 μg/g, with all values <15.625 being set to half of the lower limit (7.8125) and all values >250 being set to 251. Calprotectin concentration is classified as either Normal (<15.625 – 50), Borderline (>50 – 120), or Abnormal (>120). Normal fecal steatocrit is <10%(17). Reportable range for fecal elastase is from 15 to 500 μg/g, with all values <15 being set to half of the lower limit (7.5) and all values >500 being set to 501. Elastase concentration is classified as either Normal (>200) or Abnormal (≤200). Results at 1 month and 6 months compared to baseline values were evaluated among participants with data available at both baseline and corresponding follow-up visits. Estimates were obtained from linear regression models with adjustments for age group at enrollment, sex at birth, and prior modulator use.
Finally, we also examined the associations between changes in fecal calprotectin and changes in several core outcomes at 1 month and 6 months, which included FEV1pp, weight (absolute values for adults ≥18 years old and z-score for pediatric participants <18 years old). We evaluated the relationship between change in fecal calprotectin and change in PROM scores at 6 months. These relationships were statistically evaluated using linear regressions adjusted for age group (if appropriate), sex at birth, and prior modulator use.
Statistical significance was evaluated at level 0.05 with no correction for multiple testing. All statistical analyses were performed using the R statistical packages version 4.0.3(18).
Results
Population
At baseline, before ETI initiation, 487 eligible participants were enrolled; complete demographic data are available in Nichols et al(10). There were 11 participants who became pregnant during the study and were eliminated from analysis. Completion rates for each PROM by visit are shown in Supplement Table (S)1; Table 1 shows the demographic characteristics of the remaining 438 participants who fully completed at least 1 PROM. The mean (SD) age at enrollment was 25.0 (10.6) and 49.3% were male at birth. The majority were white (93.8%), while 2.5% identified as Black or African American, and 5.5% as Hispanic or Latino. Prior to ETI initiation, 48.6% did not use any modulator (modulator naive), 44.5% were on lumacaftor/ivacaftor or tezacaftor/ivacaftor, and 6.8% were on ivacaftor, which generally corresponded to genotype. Table 1 also summarizes the demographic data of the 137 participants who had any available data for fecal biomarkers.
Table 1:
Summary of demographic and baseline characteristics of study participants.
| Fully Completed at Least 1 PROMs (N=438) |
Had Any Fecal Data (N=137) |
|
|---|---|---|
|
| ||
| Age (years) - Mean (SD) | 25.0 (10.6) | 23.2 (10.0) |
| Age Group - n (%) | ||
| >=12 to <18 | 143 (32.6%) | 56 (40.9%) |
| >=18 to <30 | 172 (39.3%) | 55 (40.1%) |
| >=30 | 123 (28.1%) | 26 (19.0%) |
| Sex at Birth, Male - n (%) | 216 (49.3%) | 73 (53.3%) |
| Race - n (%) | ||
| White | 411 (93.8%) | 129 (94.2%) |
| Black or African American | 11 (2.5%) | 2 (1.5%) |
| Asian | 0 (0%) | 0 (0%) |
| American Indian or Alaska Native | 1 (0.2%) | 1 (0.7%) |
| Native Hawaiian or Other Pacific Islander | 1 (0.2%) | 0 (0%) |
| More than One Race | 11 (2.5%) | 4 (2.9%) |
| Missing | 3 (0.7%) | 1 (0.7%) |
| Hispanic or Latino - n (%) | 24 (5.5%) | 7 (5.1%) |
| Prior Modulator Use - n (%) | ||
| Naive | 213 (48.6%) | 66 (48.2%) |
| Tezacaftor/Ivacaftor or Lumacaftor/Ivacaftor | 195 (44.5%) | 60 (43.8%) |
| Ivacaftor | 30 (6.8%) | 11 (8.0%) |
Data from 11 participants who were pregnant at the time of data cut were not included.
Frequency and severity of GI symptoms measured by PROMs
The mean (SD) for PAGI-SYM, PAC-SYM, and PAC-QOL total scores at baseline were 0.56 (0.59), 0.47 (0.45), and 0.69 (0.53), respectively, with higher score indicating greater severity. We further summarized the mean (SD) of total and domain scores in subgroups defined by prior modulator use (Table S2), age group at enrollment (Table S3), and sex at birth (Table S4). Notably, mean scores for several domains were higher at baseline among older age groups, including post-prandial fullness, bloating, upper abdominal pain (PAGI-SYM), and abdominal symptoms (PAC-SYM). Mean scores for all domains were substantially higher among female participants compared to male participants across all 3 PROMs.
Figure 1 shows the 6-month estimated mean changes from baseline among those who completed the PROMs at both baseline and 6-month visits. The corresponding age- and sex-adjusted 6-month mean changes (95% CI) in total scores were −0.15 (−0.21, −0.09) for PAGI-SYM, −0.14 (−0.19, −0.09) for PAC-SYM, and −0.15 (−0.21, −0.10) for PAC-QOL. For all domains, except PAGI-SYM Bloating and PAC-SYM Rectal Symptoms, the adjusted changes were statistically significant and were negative, indicating less severity in symptoms. Both PAGI-SYM Bloating and PAC-SYM Rectal Symptoms had adjusted changes higher than those at baseline, although these changes were not statistically significant. These 6-month changes in PROM scores were consistent with changes at 1 month and 3 months after ETI initiation, as shown in Table S5. We further looked at the 6-months changes in 6 subgroups defined by age group at enrollment and sex at birth (<18 males, <18 females, ≥18 to <30 males, ≥18 to <30 females, ≥30 males, and ≥30 females), with the detailed results report in Table S6. More substantial reductions in symptom severity were observed in older females, as shown by the magnitude of the estimated changes in domain scores among ≥18 to <30 females and among ≥30 females. Both PAGI-SYM Bloating and PAC-SYM Rectal Symptoms had adjusted changes in males that were higher than those at baseline, although not statistically significant. The MCID standard of −0.6 for PAC-SYM was not met by the participant group as a whole nor by any subgroup, suggesting that the observed changes are unlikely to be clinically significant over the total population of participants.
Figure 1. Changes in PAGI-SYM, PAC-SYM, and PAC-QOL scores at 6 months.
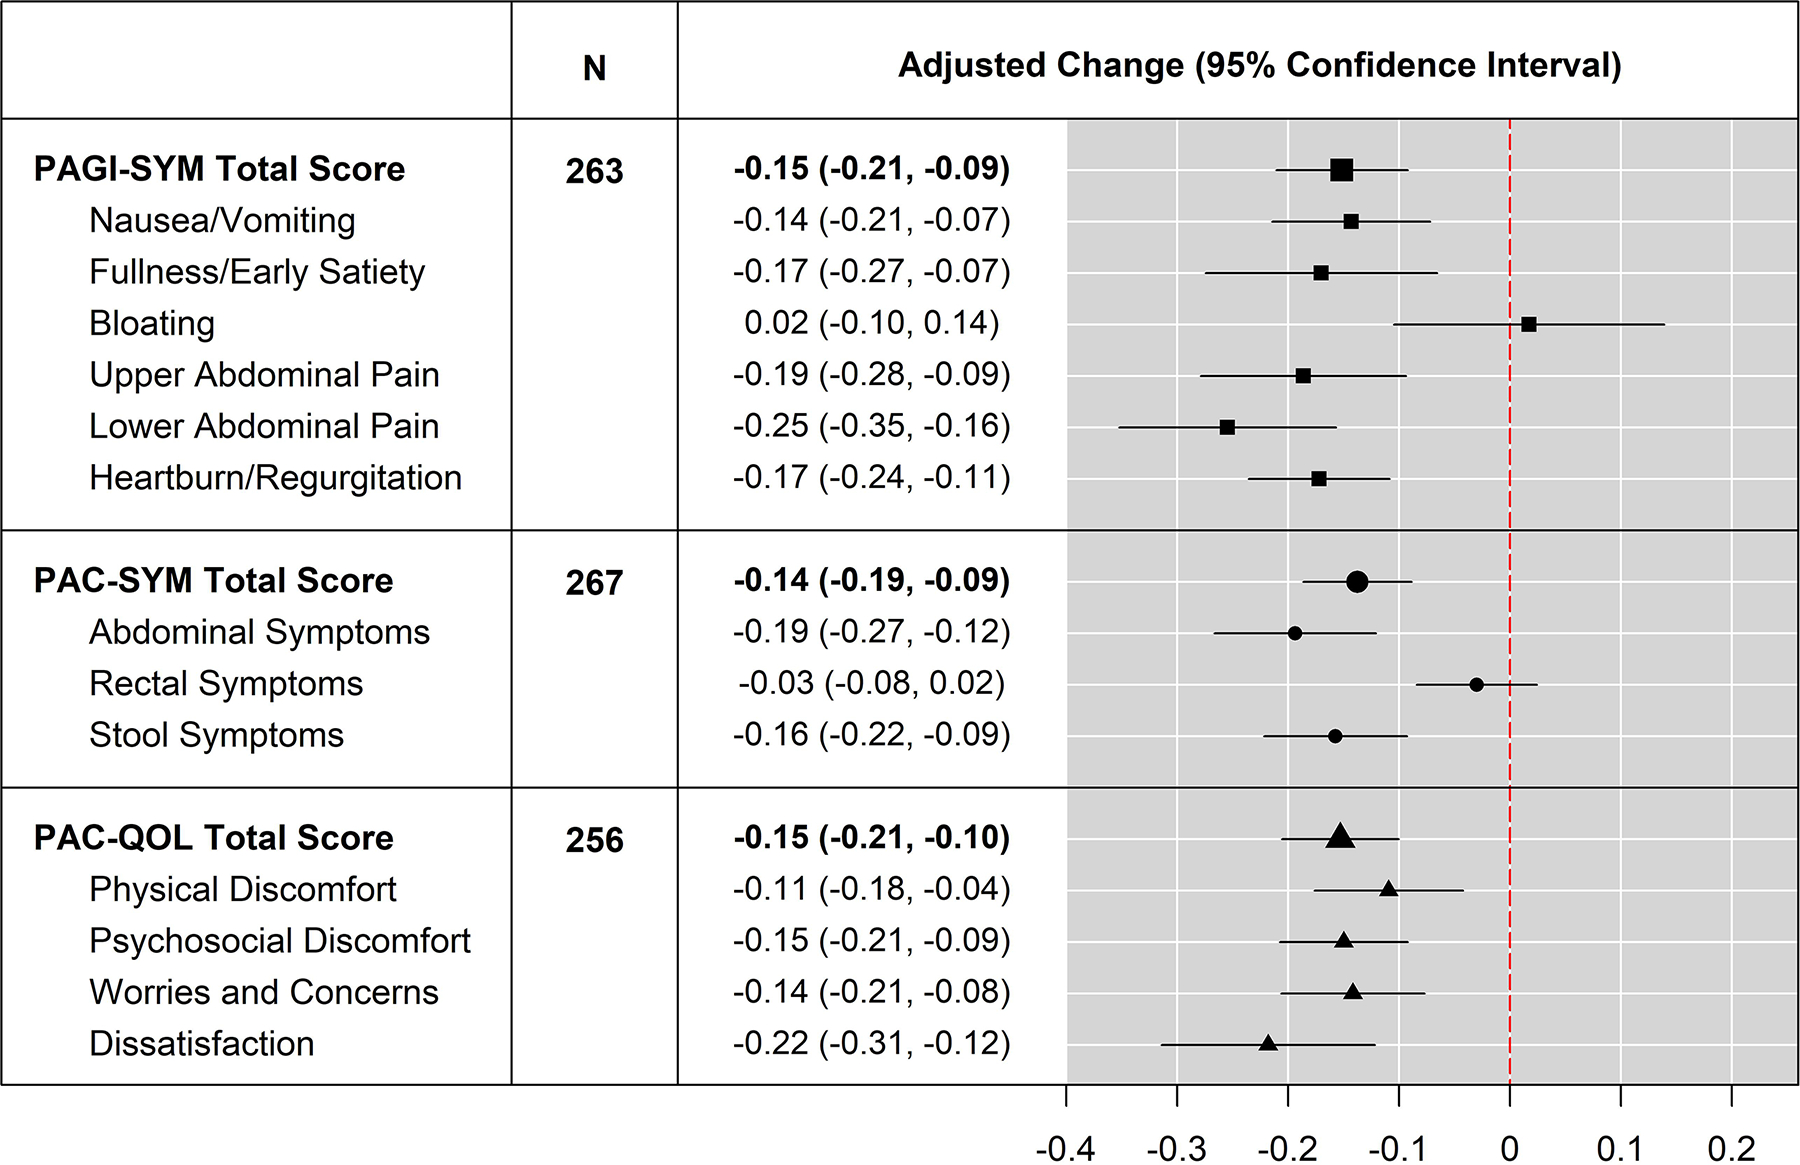
: Changes from baseline in total and domain scores for PAGI-SYM, PAC-SYM, and PAC-QOL at 6 months were evaluated in linear regression models with adjustments for age group at enrollment and sex at birth. Positive value of adjusted change indicates lower score (symptom improvement) at 6 months compared to baseline.
We next examined changes in participants reporting moderate to very severe symptoms for the baseline total and domain scores of PAGI-SYM, PAC-SYM, and PAC-QOL. Data only included those that had fully completed PROMs at both baseline and 6-months. Moderate to very-severe scores were classified as >2 for PAGI-SYM domains, and >1 for PAC-SYM or PAC-QOL domains (Table S7). Given the small numbers, statistical analysis was not performed. All PAC-SYM and PAGI-SYM domains improved over the 6 months of ETI treatment, except for those reporting moderate to severe Rectal Symptoms and Bloating; these were unchanged. The total PAC-QOL did not change, but improvement was seen in the PAC-QOL Dissatisfaction score. In this subgroup with more bothersome symptoms, the MCID standard of −0.6 for PAC-SYM was met for Total Score, Abdominal Symptoms and Stool Symptoms.
At baseline among 390 participants who fully completed the SSQ, 22 (5.6%) reported Bristol stool type 1 or 2, 23 (5.9%) had self-described constipation, 7 (1.8%) reported diarrhea, 10 (2.6%) had less than 3 bowel movements per week, and 10 (2.6%) reported stool leakage. Table S8 reports the frequencies on the SSQ items at 1 month, 3 months, and 6 months. None of the changes were significant.
Analyses of fecal biomarkers
Table 2 shows the distributions of fecal biomarkers at baseline overall and in subgroups by prior modulator use. Consistent with prior reports(19), mean (SD) for fecal calprotectin across all participants was 127.4 μg/g (86.7), with 50.4% of participants having abnormal values (>120 μg/g) and 26.7% having borderline values (>50 to ≤120 μg/g). Mean (SD) of fecal calprotectin was 144.4 μg/g (82.8) among those who were modulator naive, 120.4 μg/g (84.7) among F508del/F508del PwCF on baseline tezacaftor/ivacaftor or lumacaftor/ivacaftor, and 68.5 μg/g (95.4) among those who were on ivacaftor. At baseline, fecal elastase-1 was normal (>200 μg/g) for only 2 participants, with no substantial difference among modulator groups. Mean fecal steatocrit (SD) was 34.5% (17.7), with a normal steatocrit (<10%) in 12.5%(17). Fecal steatocrit was not statistically different between the ivacaftor group with mean (SD) of 26.7% (20.3) and all other participants 35.8% (18.9). Distributions of fecal biomarkers at baseline by age group at enrollment and by sex at birth are shown in Tables S9 and S10. Overall, older and male participants had higher levels of fecal calprotectin, and there were slightly higher levels of fecal steatocrit in the youngest group and among males, compared with other participants.
Table 2:
Summary of Fecal Biomarkers at Baseline by Prior Modulator Use.
| Prior Modulator Usage [1] | All Participants | |||
|---|---|---|---|---|
|
|
|
|
||
| Naive | Two Drugs | Ivacaftor | ||
|
| ||||
| Fecal Calprotectin, N [2] | 62 | 58 | 11 | 131 |
| Mean (SD) | 144.4 (82.8) | 120.4 (84.7) | 68.5 (95.4) | 127.4 (86.7) |
| Median (IQR) | 146.0 (67.9, 225.9) | 101.9 (55.6, 189.0) | 20.4 (7.8, 77.6) | 121.4 (52.6, 210.7) |
| Classification - n (%) | ||||
| Normal | 10 (16.1%) | 12 (20.7%) | 8 (72.7%) | 30 (22.9%) |
| Borderline | 13 (21.0%) | 21 (36.2%) | 1 (9.1%) | 35 (26.7%) |
| Abnormal | 39 (62.9%) | 25 (43.1%) | 2 (18.2%) | 66 (50.4%) |
|
| ||||
| Fecal Elastase, N [3] | 62 | 58 | 11 | 131 |
| Mean (SD) | 12.2 (24.4) | 20.8 (65.3) | 50.8 (87.9) | 19.3 (53.4) |
| Median (IQR) | 7.5 (7.5, 7.5) | 7.5 (7.5, 15.0) | 7.5 (7.5, 26.9) | 7.5 (7.5, 15.0) |
| Classification - n (%) | ||||
| Normal | 0 (0%) | 1 (1.7%) | 1 (9.1%) | 2 (1.5%) |
| Abnormal | 62 (100%) | 57 (98.3%) | 10 (90.9%) | 129 (98.5%) |
|
| ||||
| Fecal Steatocrit, N [4] | 60 | 57 | 11 | 128 |
| Mean (SD) | 34.5 (17.7) | 37.1 (20.2) | 26.7 (20.3) | 35.0 (19.1) |
| Median (IQR) | 32.6 (23.8, 47.9) | 36.4 (23.2, 50.6) | 25.5 (8.5, 37.3) | 33.3 (22.3, 48.0) |
The results are reported for all eligibly enrolled participants and 3 groups defined by prior modulator use: 1) Naive (participants who have not used modulators within 90 days of baseline); 2) Two Drugs (participants who have used tezacaftor/ivacaftor or lumacaftor/ivacaftor within 90 days of baseline); and 3) ivacaftor (participants who has used Ivacaftor within 90 days of baseline).
Reportable range for fecal calprotectin is from 15.625 to 250 μg/g. Concentration is classified as either Normal (<15.625 – 50), Borderline (>50 – 120), or Abnormal (>120). All values below the lower limit of detection (i.e. <15.625) were set to half of the lower limit (i.e. 7.8125), and all values above the upper limit of detection (i.e. >250) were set to 251.
Reportable range for fecal elastase is from 15 to 500 μg/g. Concentration is classified as either Normal (>200), or Abnormal (≤200). All values below the lower limit of detection (i.e. <15) were set to half of the lower limit (i.e. 7.5), and all values above the upper limit of detection (i.e. >500) were set to 501.
Fecal steatocrit is defined as % fat of the total stool sample.
Figure 2 shows the distributions of fecal calprotectin at 1 month and 6 months after ETI initiation. The estimated change (95% CI) from baseline, adjusted for prior modulator use, age group, and sex at birth, was −60.3 μg/g (−77.4, −43.4) at 1 month, and −66.2 μg/g (−86.1, −46.2) at 6 months. Only 17% of participants at 6 months had an abnormal level of fecal calprotectin. Further results stratified by subgroups are shown in Table S11. At 6 months, subgroups with the largest reduction in calprotectin level included those who were modulator naive, ≥30 years old, or male participants.
Figure 2: Distributions of fecal calprotectin at baseline, 1 month, and 6 months.
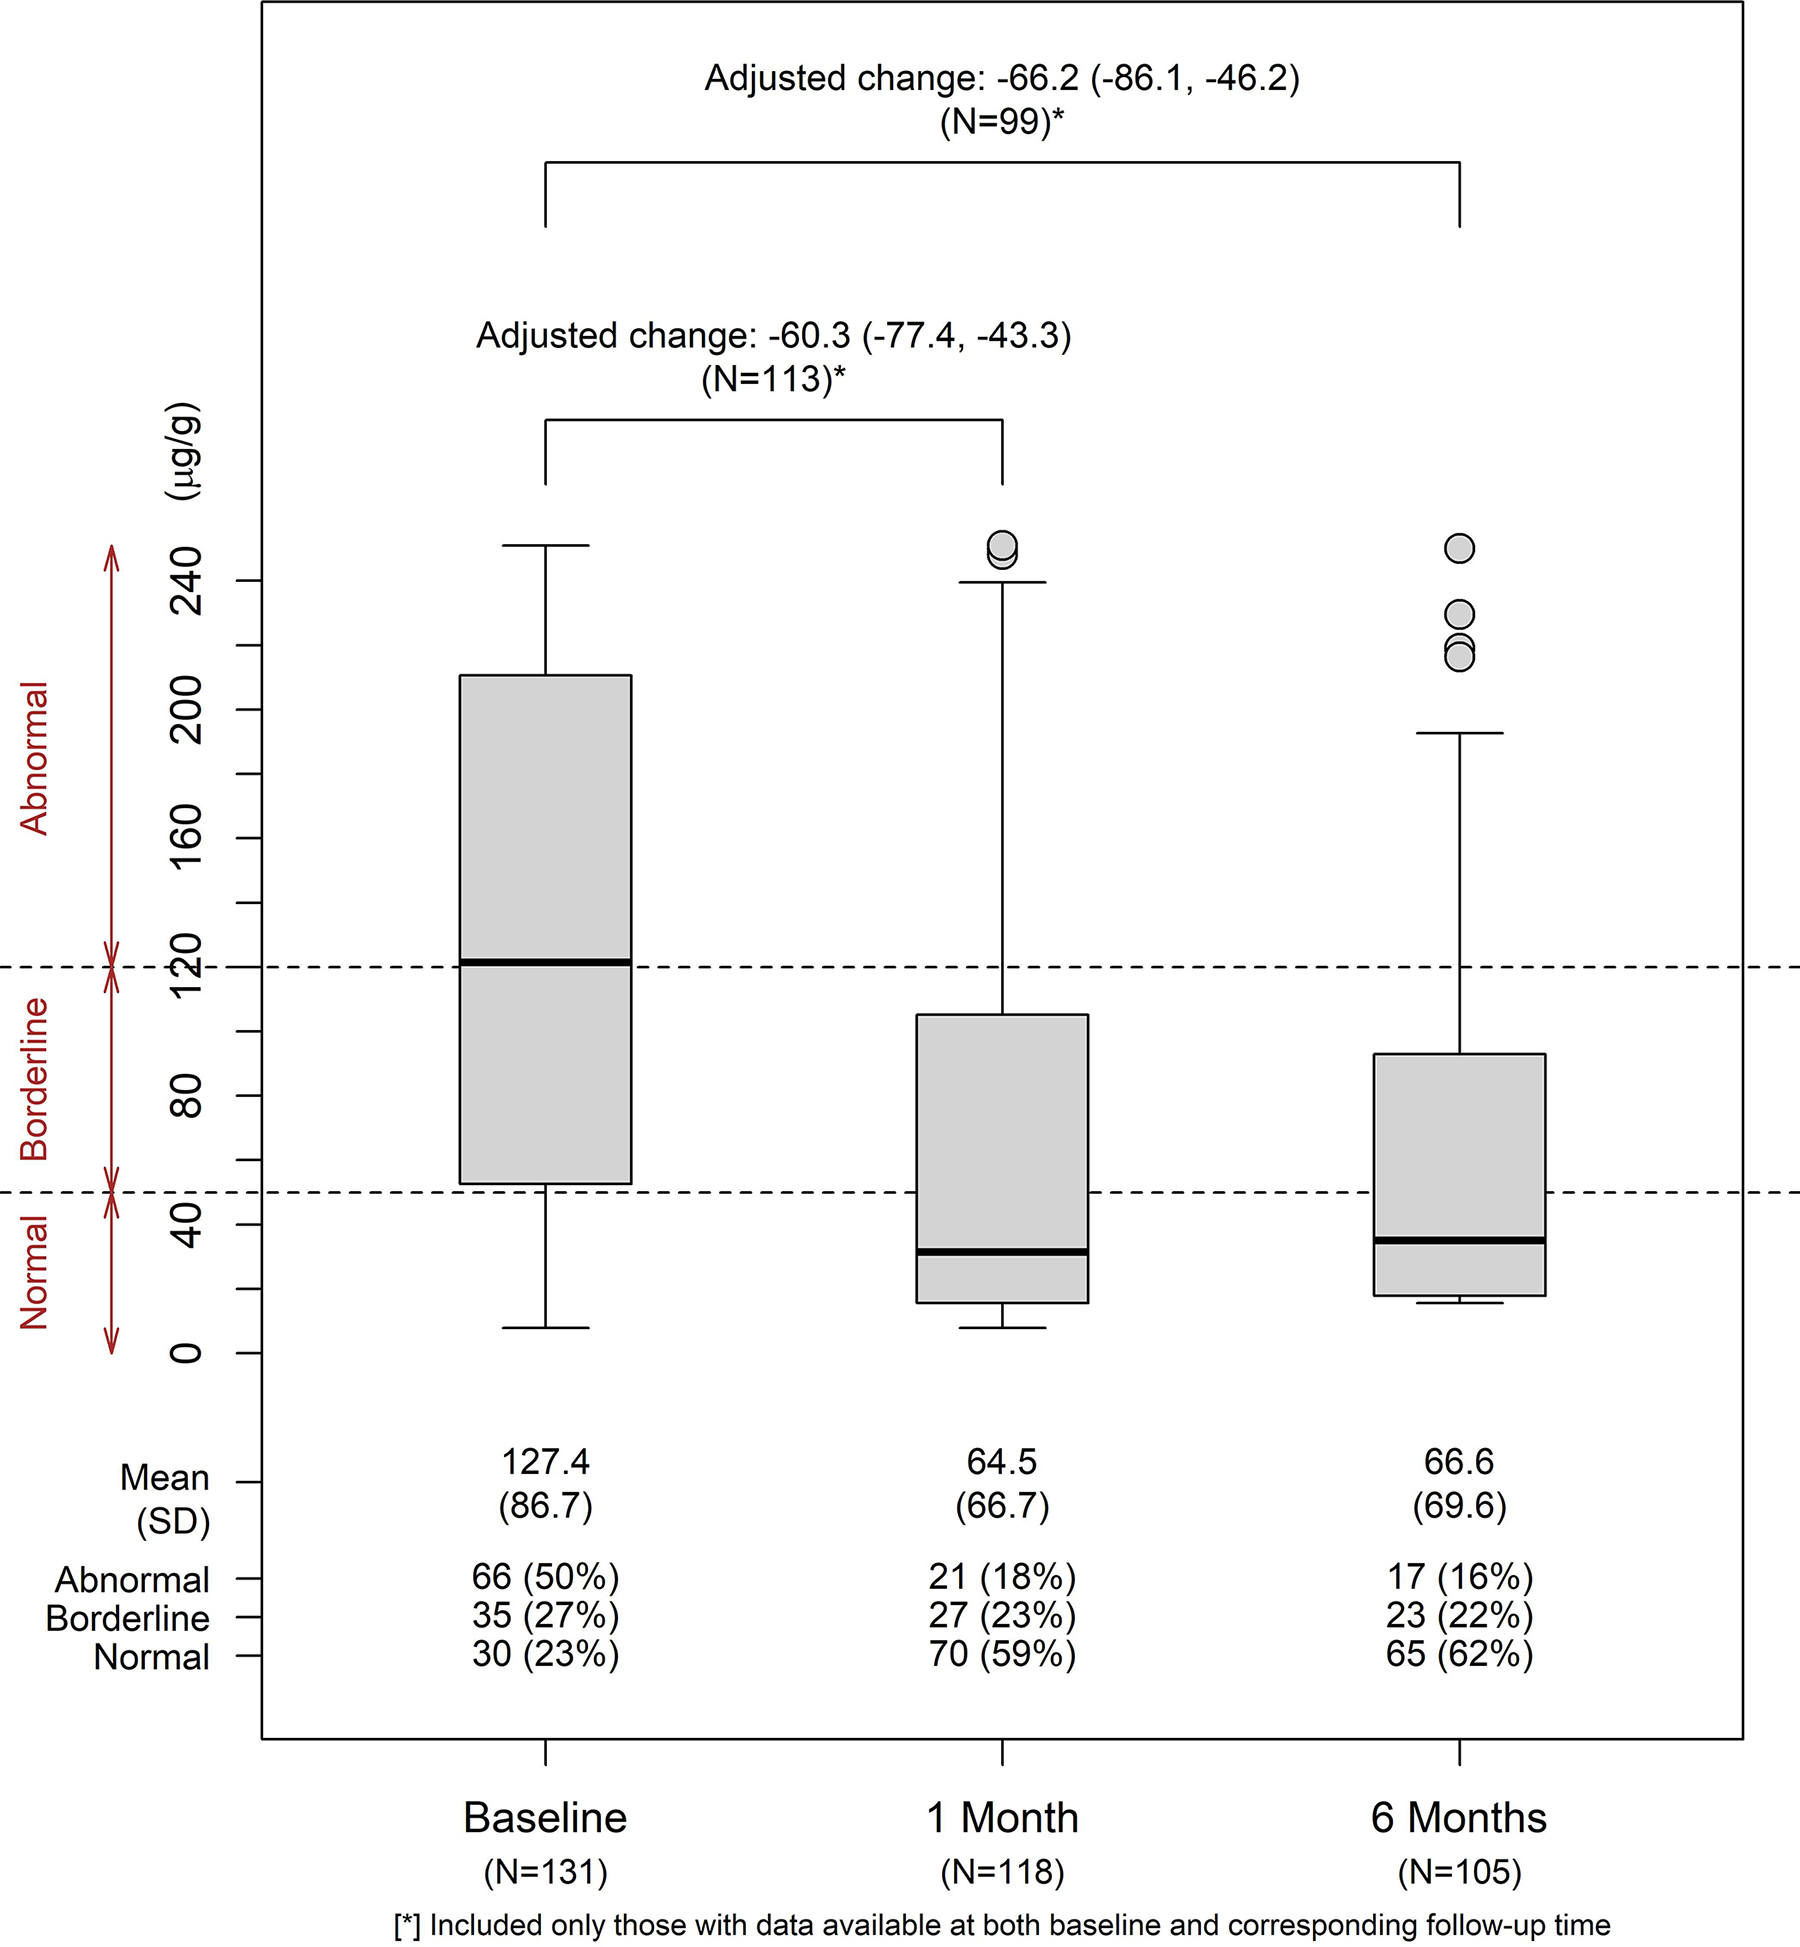
Distributions of fecal calprotectin (μg/g) were summarized for visits at baseline, 1 month, and 6 months. Changes from baseline at follow-up visits were evaluated in linear regression models with adjustments for age group at enrollment, sex at birth, and prior modulator use, among participants who had available data at both baseline and the corresponding follow-up visits (N=113 at 1 month and N=99 at 6 months).
Table 3 summarizes the changes in fecal elastase-1 overall and in subgroups at follow-up visits. There were 99 participants with available data at both baseline and 6 months. The overall adjusted change (95% CI) at 6 months was 7.08 μg/g (3.58, 10.58), a value within the coefficient of variation of the test(20). Except for the 2 participants who had normal fecal elastase-1 at baseline that remained normal at 6 months, the rest of the participants had levels of fecal elastase-1 indicative of severe exocrine pancreatic insufficiency both at baseline and at 6 months. Overall and in subgroups, there was no significant change in fecal steatocrit (Table S12).
Table 3:
Summary of Changes in Fecal Elastase at Follow-Up Visits by Subgroup.
| At 1 Month (N=113) [1] | At 6 Months (N=99) [1] | |||||||
|---|---|---|---|---|---|---|---|---|
|
|
|
|||||||
| N | Change from Baseline (95% CI) [2] | % Normal |
% Abnormal |
N | Change from Baseline (95% CI) [2] | % Normal |
% Abnormal |
|
|
| ||||||||
| Overall | 113 | 2.44 (−2.01, 6.88) | 2 (1.8%) | 111 (98.2%) | 99 | 7.01 (3.75, 10.27) | 2 (2.0%) | 97 (98.0%) |
| Prior Modulator Usage: | ||||||||
| Naive | 54 | 1.67 (−0.21, 3.55) | 0 (0%) | 54 (100%) | 45 | 8.94 (4.89, 12.98) | 0 (0%) | 45 (100%) |
| Any Prior Modulator | 59 | 3.13 (−5.35, 11.62) | 2 (3.4%) | 57 (96.6%) | 54 | 5.40 (0.38, 10.42) | 2 (3.7%) | 52 (96.3%) |
| Age Group | ||||||||
| <18 Years | 44 | 2.42 (−0.33, 5.17) | 0 (0%) | 44 (100%) | 38 | 8.27 (2.74, 13.80) | 0 (0%) | 38 (100%) |
| >=18-<30 Years | 46 | 3.07 (−7.66, 13.81) | 1 (2.2%) | 45 (97.8%) | 42 | 6.09 (−0.03, 12.20) | 1 (2.4%) | 41 (97.6%) |
| >=30 Years | 23 | 1.19 (−0.01, 2.39) | 1 (4.3%) | 22 (95.7%) | 19 | 6.52 (5.36, 7.67) | 1 (5.3%) | 18 (94.7%) |
| Sex at Birth | ||||||||
| Male | 59 | 4.19 (−1.68, 10.05) | 1 (1.7%) | 58 (98.3%) | 55 | 7.27 (5.04, 9.49) | 1 (1.8%) | 54 (98.2%) |
| Female | 54 | 0.52 (−6.31, 7.35) | 1 (1.9%) | 53 (98.1%) | 44 | 6.68 (−0.25, 13.62) | 1 (2.3%) | 43 (97.7%) |
Reportable range for fecal elastase is from 15 to 500 μg/g. Concentration is classified as either Normal (>200) or Abnormal (≤200). All values below the lower limit of detection (i.e. <15) were set to half of the lower limit (i.e. 7.5), and all values above the upper limit of detection (i.e. >500) were set to 501.
Overall changes were adjusted for age group, sex at birth, and prior modulator use. Results in subgroups defined by prior modulator were adjusted for age group and sex at birth. Results in subgroups defined by age group were adjusted for prior modulator and sex at birth. Results in subgroups defined by sex at birth were adjusted for prior modulator and age group.
Data included only participants who had measures at both baseline and the corresponding follow-up visits.
Changes in fecal biomarkers, FEV1pp, and weight
Previous reports from our study have shown improvement in both weight and FEV1pp in adolescents and adults with CF started on ETI (10). We explored a possible relationship between changes in fecal calprotectin and changes in FEV1pp (S13), changes in weight among adults or weight z-scores among pediatric participants (S14) and changes in PROMs. In unadjusted analyses, reductions in fecal calprotectin corresponded with improved FEV1pp as well as weight gain at both 1 month and 6 months. Adjusted for prior modulator, age group at enrollment, and sex at birth, these associations were not statistically significant (all p>0.05). There was no association with change in fecal calprotectin levels and change in PROM scores (data not shown).
Discussion
In our study of effects of ETI on gastrointestinal symptoms and dysfunction in PwCF, we found small overall changes in gastrointestinal symptoms after starting ETI. Women >18 years of age reported potentially clinically important improvements in bloating and upper abdominal pain, whereas men in the same age group reported worse bloating. When focusing on PwCF with the most severe gastrointestinal symptoms at baseline, more improvement in symptoms after ETI was found, as well as improvement in the PAC-QOL Dissatisfaction score. Rectal symptoms and bloating did not improve in this subset of participants with more severe symptoms, suggesting that ETI has little impact on these problems. While overall the impact of ETI on gastrointestinal symptoms in CF is small, it may result in important improvements in those with more severe symptoms. Similar modest improvements in gastrointestinal symptoms with ETI were found by Mainz, et al, using the CFAbd-Score in four centers in Germany and the United Kingdom(21).
Gastrointestinal dysfunction in CF, marked by pancreatic insufficiency and intestinal inflammation, also showed limited improvement with ETI. Fecal calprotectin is a product of neutrophils that is widely used used in PwCF to assess intestinal inflammation(19, 20). In our study, improvement in fecal calprotectin seen with ETI was comparable to that seen with the use of probiotics or ivacaftor in PwCF(19, 22). A previous study linked fecal calprotectin levels to severity of gastrointestinal symptoms(23); our study showed no association of change in fecal calprotectin and change in symptoms. Future studies linking changes in fecal calprotectin to possible changes in the fecal microbiome with ETI may help determine the microbiological correlates of these inflammatory changes.
We demonstrated no improvement in fecal elastase-1, suggesting that exocrine pancreatic function did not improve with 6 months of ETI therapy. Pancreatic insufficiency is a critical issue in approximately 85% of individuals with CF, impairing absorption of macronutrients and fat-soluble vitamins(1, 3). Our results are not unexpected. In patients with Class I or II mutations pancreatic insufficiency is often present at birth and may begin in utero(3). Reversing long-standing pancreatic insufficiency in a fibrotic pancreas or one with fatty replacement was unlikely. Similar studies of ivacaftor in children with gating mutations showed improvement in fecal elastase to >200 ug/g, consistent with pancreatic sufficiency, in 67% of children 4–24 months of age after 24 weeks of treatment(24). In a similar study of ivacaftor in children 2–5 years of age, 23% had increases in fecal elastase to >200 ug/g over 24 weeks. Extension of observations in this group to 84 weeks did not demonstrate a further increase in the number of children with pancreatic sufficiency(25). There is little systematic data on the effects of ivacaftor on PwCF of older age, but few have achieved pancreatic sufficiency(26).
Improvement in BMI(10) without improvement in exocrine pancreatic function may at first seem incongruous. However, PwCF have reasons beyond pancreatic insufficiency for poor weight gain(3). ETI appears to reduce intestinal inflammation, which has been associated with intestinal dysbiosis and poor growth(3). Studies of ivacaftor in PwCF and CFTR gating mutations showed improvement in intestinal luminal pH(27) (which may increase the efficiency of pancreatic enzymes), decreased resting energy expenditure and improved coefficient of fat absorption(28). Future studies may identify factors contributing to the weight gain for PwCF taking ETI.
There are limitations to our study. It began at the onset of the COVID-19 pandemic; as such, we had reduced numbers of fecal samples and PROM results at some timepoints. While not significant, the noted worsening of rectal symptoms and bloating in men as compared to women may benefit from a study with larger numbers. The increase in diarrhea in the first month after starting ETI was notable, but not significant. Larger numbers of individuals may determine if this is a real side-effect of the medication. The PROMISE study was open to all PwCF who were eligible for ETI; our population was not enriched for those with more severe gastrointestinal symptoms. Some information, such as use of laxatives, was not collected in this study. PROMISE is an ongoing study; it is possible that more robust changes in gastrointestinal symptoms will be seen after longer periods of treatment. Longer duration of treatment with ivacaftor in older children with gating mutations has been associated with small numbers achieving pancreatic sufficiency(26).
Conclusion:
After 6 months of ETI, gastrointestinal symptoms improved modestly. Improvements were more robust for participants who had more severe symptoms at baseline. ETI reduced evidence of intestinal inflammation but did not reverse long-standing pancreatic insufficiency. Ongoing and planned studies of ETI in younger children may demonstrate a greater impact on gastrointestinal symptoms and pancreatic function. As PwCF live longer lives with ETI therapy, gastrointestinal symptoms will continue to be a source of morbidity, emphasizing the need for continued attention to gastrointestinal disease in PwCF.
Supplementary Material
Grant Support:
This work was supported by the Cystic Fibrosis Foundation and registered as NCT04038047.
Footnotes
Conflicts of Interest
SJS-Consultant for UpToDate, Abbvie, Mirium, Nestle; Grant funding from Gilead, Cystic Fibrosis Foundation, NIH.
SDF – Consultant for UpToDate, Abbvie, Nestle, Synspira; Grant funding from NIH, Cystic Fibrosis Foundation, Amagma Therapeutics.
MRN – Consultant for UpToDate, Vertex: Grant funding from Gilead, AbbVie, Cystic Fibrosis Foundation, NIH
SMR: Consultant for Vertex; Grant funding from Vertex, Cystic Fibrosis Foundation, NIH
DPN: Consultant for Vertex, Genentech; Grant funding from Vertex, Cystic Fibrosis Foundation, NIH
GMS: Consultant for Genentech, Electromed; Grant Funding from Vertex, Cystic Fibrosis Foundation, NIH
DG: Consultant for Vertex, Abbvie, Chiesi USA, Eli Lilly
AK: Grant funding from NIH, Cystic Fibrosis Foundation,
SDS – Grant funding from Cystic Fibrosis Foundation and NIH
MSS—Grant funding from Cystic Fibrosis Foundation
Abbreviations: BMI: Body mass index, CF: Cystic fibrosis, CFTR: Cystic fibrosis transmembrane conductance regulator, ETI: Elexacaftor/tezacaftor/ivacaftor, FEV1pp: Forced expiratory volume in 1 second, percent predicted, GI: Gastrointestinal, MCID: Minimal clinically important difference, PAGI-SYM: Patient Assessment of Upper Gastrointestinal Disorders-Symptom Severity Index, PAC-SYM: Patient Assessment of Constipation-Symptom Severity Index, PAC-QOL: Patient Assessment of Constipation-Quality of Life, PROM: Patient reported outcome measure, PwCF: People with cystic fibrosis, S: Supplemental, SSQ: Stool-specific questionnaire
CRediT statement:
Sarah Jane Schwarzenberg: Conceptualization, Formal analysis, Funding acquisition, Investigation, Methodology, Project administration, Resources, Supervision, Validation, Visualization, Writing (original draft), Writing (review and editing), Phuong T. Vu: Conceptualization, Data curation, Formal analysis Software, Validation, Writing (original draft), Writing (review and editing), Michelle Skalland: Data curation, Formal analysis, Software, Validation, Writing (review and editing), Lucas R. Hoffman: Conceptualization, Methodology, Visualization, Investigation, Writing (review and editing), Christopher Pope: Methodology, Investigation, Writing (review and editing), Daniel Gelfond: Conceptualization, Methodology, Visualization, Investigation, Writing (review and editing), Michael R. Narkewicz: Conceptualization, Methodology, Visualization, Investigation, Writing (review and editing), David P. Nichols: Funding acquisition, Investigation, Project administration, Writing (review and editing), Sonya L. Heltshe: Investigation, Project administration, Writing (review and editing), Scott H. Donaldson: Investigation, Writing (review and editing), Carla A. Frederick: Investigation, Writing (review and editing), Andrea Kelly: Investigation, Writing (review and editing), Jessica E. Pittman: Investigation, Writing (review and editing), Felix Ratjen: Investigation, Writing (review and editing), Margaret Rosenfeld: Investigation, Writing (review and editing), Scott D. Sagel: Investigation, Writing (review and editing), George M. Solomon: Investigation, Writing (review and editing), Michael S. Stalvey: Investigation, Writing (review and editing), John P. Clancy: Writing (review and editing), Steven M. Rowe: Funding acquisition, Project administration, Writing (review and editing), Steven D. Freedman: Conceptualization, Formal analysis, Funding acquisition, Investigation, Methodology, Project administration, Resources, Supervision, Validation, Visualization, Writing (original draft), Writing (review and editing).
Results were previously presented at the North American Cystic Fibrosis Conference in 2020 and 2021.
References
- 1.Rowe SM, Miller S, Sorscher EJ. Cystic fibrosis. N Engl J Med. 2005;352(19):1992–2001. [DOI] [PubMed] [Google Scholar]
- 2.Gelfond D, Borowitz D. Gastrointestinal complications of cystic fibrosis. Clin Gastroenterol Hepatol. 2013;11(4):333–42; quiz e30–1. [DOI] [PubMed] [Google Scholar]
- 3.Borowitz D, Durie PR, Clarke LL, Werlin SL, Taylor CJ, Semler J, et al. Gastrointestinal outcomes and confounders in cystic fibrosis. J Pediatr Gastroenterol Nutr. 2005;41(3):273–85. [DOI] [PubMed] [Google Scholar]
- 4.Tabori H, Arnold C, Jaudszus A, Mentzel HJ, Renz DM, Reinsch S, et al. Abdominal symptoms in cystic fibrosis and their relation to genotype, history, clinical and laboratory findings. PLoS One. 2017;12(5):e0174463. [DOI] [PMC free article] [PubMed] [Google Scholar]
- 5.Boyle MP, De Boeck K. A new era in the treatment of cystic fibrosis: correction of the underlying CFTR defect. Lancet Respir Med. 2013;1(2):158–63. [DOI] [PubMed] [Google Scholar]
- 6.Keating D, Marigowda G, Burr L, Daines C, Mall MA, McKone EF, et al. VX-445-Tezacaftor-Ivacaftor in Patients with Cystic Fibrosis and One or Two Phe508del Alleles. N Engl J Med. 2018;379(17):1612–20. [DOI] [PMC free article] [PubMed] [Google Scholar]
- 7.Nichols DP, Donaldson SH, Frederick CA, Freedman SD, Gelfond D, Hoffman LR, et al. PROMISE: Working with the CF community to understand emerging clinical and research needs for those treated with highly effective CFTR modulator therapy. J Cyst Fibros. 2021;20(2):205–12. [DOI] [PMC free article] [PubMed] [Google Scholar]
- 8.Borowitz D, Gelfond D. Intestinal complications of cystic fibrosis. Curr Opin Pulm Med. 2013;19(6):676–80. [DOI] [PubMed] [Google Scholar]
- 9.Sathe M, Huang R, Heltshe S, Eng A, Borenstein E, Miller SI, et al. Gastrointestinal Factors Associated With Hospitalization in Infants With Cystic Fibrosis: Results From the Baby Observational and Nutrition Study. J Pediatr Gastroenterol Nutr. 2021;73(3):395–402. [DOI] [PMC free article] [PubMed] [Google Scholar]
- 10.Nichols DP, Paynter AC, Heltshe SL, Donaldson SH, Frederick CA, Freedman SD, et al. Clinical Effectiveness of Elexacaftor/Tezacftor/Ivacaftor in People with Cystic Fibrosis. Am J Respir Crit Care Med. 2021. [Google Scholar]
- 11.Rentz AM, Kahrilas P, Stanghellini V, Tack J, Talley NJ, de la Loge C, et al. Development and psychometric evaluation of the patient assessment of upper gastrointestinal symptom severity index (PAGI-SYM) in patients with upper gastrointestinal disorders. Qual Life Res. 2004;13(10):1737–49. [DOI] [PubMed] [Google Scholar]
- 12.Neri L, Conway PM, Basilisco G, Laxative Inadequate Relief Survey G. Confirmatory factor analysis of the Patient Assessment of Constipation-Symptoms (PAC-SYM) among patients with chronic constipation. Qual Life Res. 2015;24(7):1597–605. [DOI] [PubMed] [Google Scholar]
- 13.de la Loge C, Trudeau E, Marquis P, Kahrilas P, Stanghellini V, Talley NJ, et al. Cross-cultural development and validation of a patient self-administered questionnaire to assess quality of life in upper gastrointestinal disorders: the PAGI-QOL. Qual Life Res. 2004;13(10):1751–62. [DOI] [PubMed] [Google Scholar]
- 14.Sathe M, Moshiree B, Vu PT, Khan U, Heltshe SL, Romasco M, et al. Utilization of electronic patient-reported outcome measures in cystic fibrosis research: Application to the GALAXY study. J Cyst Fibros. 2021;20(4):605–11. [DOI] [PMC free article] [PubMed] [Google Scholar]
- 15.Yiannakou Y, Tack J, Piessevaux H, Dubois D, Quigley EMM, Ke MY, et al. The PAC-SYM questionnaire for chronic constipation: defining the minimal important difference. Aliment Pharmacol Ther. 2017;46(11–12):1103–11. [DOI] [PMC free article] [PubMed] [Google Scholar]
- 16.Tran M, Forget P, Van den Neucker A, Strik J, van Kreel B, Kuijten R. The acid steatocrit: a much improved method. J Pediatr Gastroenterol Nutr. 1994;19(3):299–303. [DOI] [PubMed] [Google Scholar]
- 17.Van den Neucker AM, Kerkvliet EM, Theunissen PM, Forget PP. Acid steatocrit: a reliable screening tool for steatorrhoea. Acta Paediatr. 2001;90(8):873–5. [PubMed] [Google Scholar]
- 18.Team RC. R: A language and environment for statistical computing Vienna, Austria: R Foundation for Statistical Computing; 2020. [Available from: https://www.R-project.org. [Google Scholar]
- 19.Ooi CY, Syed SA, Rossi L, Garg M, Needham B, Avolio J, et al. Impact of CFTR modulation with Ivacaftor on Gut Microbiota and Intestinal Inflammation. Sci Rep. 2018;8(1):17834. [DOI] [PMC free article] [PubMed] [Google Scholar]
- 20.Meyts I, Wuyts W, Proesmans M, De Boeck K. Variability of fecal pancreatic elastase measurements in cystic fibrosis patients. J Cyst Fibros. 2002;1(4):265–8. [DOI] [PubMed] [Google Scholar]
- 21.Mainz JG, Zagoya C, Polte L, Naehrlich L, Sasse L, Eickmeier O, et al. Elexacaftor-Tezacaftor-Ivacaftor Treatment Reduces Abdominal Symptoms in Cystic Fibrosis-Early results Obtained With the CF-Specific CFAbd-Score. Front Pharmacol. 2022;13:877118. [DOI] [PMC free article] [PubMed] [Google Scholar]
- 22.Bruzzese E, Raia V, Gaudiello G, Polito G, Buccigrossi V, Formicola V, et al. Intestinal inflammation is a frequent feature of cystic fibrosis and is reduced by probiotic administration. Aliment Pharmacol Ther. 2004;20(7):813–9. [DOI] [PubMed] [Google Scholar]
- 23.Jaudszus A, Pfeifer E, Lorenz M, Beiersdorf N, Hipler UC, Zagoya C, et al. Abdominal Symptoms Assessed With the CFAbd-Score are Associated With Intestinal Inflammation in Patients With Cystic Fibrosis. J Pediatr Gastroenterol Nutr. 2022;74(3):355–60. [DOI] [PubMed] [Google Scholar]
- 24.Rosenfeld M, Wainwright CE, Higgins M, Wang LT, McKee C, Campbell D, et al. Ivacaftor treatment of cystic fibrosis in children aged 12 to <24 months and with a CFTR gating mutation (ARRIVAL): a phase 3 single-arm study. Lancet Respir Med. 2018;6(7):545–53. [DOI] [PMC free article] [PubMed] [Google Scholar]
- 25.Rosenfeld M, Cunningham S, Harris WT, Lapey A, Regelmann WE, Sawicki GS, et al. An open-label extension study of ivacaftor in children with CF and a CFTR gating mutation initiating treatment at age 2–5years (KLIMB). J Cyst Fibros. 2019;18(6):838–43. [DOI] [PMC free article] [PubMed] [Google Scholar]
- 26.Nichols AL, Davies JC, Jones D, Carr SB. Restoration of exocrine pancreatic function in older children with cystic fibrosis on ivacaftor. Paediatr Respir Rev. 2020;35:99–102. [DOI] [PubMed] [Google Scholar]
- 27.Gelfond D, Ma C, Semler J, Borowitz D. Intestinal pH and gastrointestinal transit profiles in cystic fibrosis patients measured by wireless motility capsule. Dig Dis Sci. 2013;58(8):2275–81. [DOI] [PubMed] [Google Scholar]
- 28.Stallings VA, Sainath N, Oberle M, Bertolaso C, Schall JI. Energy Balance and Mechanisms of Weight Gain with Ivacaftor Treatment of Cystic Fibrosis Gating Mutations. J Pediatr. 2018;201:229–37 e4. [DOI] [PubMed] [Google Scholar]
Associated Data
This section collects any data citations, data availability statements, or supplementary materials included in this article.