

Abstract
Objective:
To compare frequencies of risk factors and pregnancy outcomes in ethnic groups versus the combined total of Asian American, Native Hawaiian, and Pacific Islander (AANHPI) populations.
Methods:
Using linked birth and fetal death certificate and maternal hospital discharge data (California 2007–2018), we estimated frequencies of 15 clinical and sociodemographic exposures and 11 pregnancy outcomes. Variability across 15 AANHPI groups was compared using a heat map and compared to frequencies for the total group (n = 904,232).
Results:
AANHPI groups varied significantly from each other and the combined total regarding indicators of social disadvantage (e.g., range for high school-level educational or less: 6.4% Korean-55.8% Samoan) and sociodemographic factors (e.g., maternal age < 20 years: 0.2% Chinese-8.8% Guamanian) that are related to adverse pregnancy outcomes. Perinatal outcomes varied significantly (e.g., severe maternal morbidity: 1.2% Korean-1.9% Filipino). No single group consistently had risk factors or outcome prevalence at the extremes, i.e., no group was consistently better or worse off across examined factors.
Conclusions:
Substantial variability in perinatal risk factors and outcomes exists across AANHPI groups. Aggregation into “AANHPI” is not appropriate for outcome reporting.
Keywords: Social determinants of health, Maternal health, Public Health
Introduction
In the United States (US), Asian Americans represent the fastest growing racial/ethnic group while Native Hawaiian and Pacific Islanders are the third fastest growing group [1]. Based on the 2019 US Census, Asian American, Native Hawaiian and Pacific Islanders (AANHPI) represent 7.2% of the population, after nearly doubling in the last two decades [1]. AANHPI populations trace their heritage to more than 30 nations with diverse sociocultural backgrounds and immigration motivations. Consequently, these populations exhibit strikingly different sociodemographic and health-related characteristics such as diet, health beliefs, use of health services, and body mass index (BMI) [2–4].
Historically, the AANHPI population has been understudied, underrepresented, and underfunded in research [5,6]. Among existing research, it is common practice to aggregate AANHPI ethnic groups into a single race/ethnicity category in research [7]. This masks diversity between ethnic groups and limits the ability to support the unique health needs of these communities in a targeted fashion [8,9]. In addition to the aggregation of AANHPI ethnic groups into a single monolith, limitations such as small sample sizes, piecemeal evidence focused on a few groups, and narrow research questions make it challenging to have a comprehensive understanding of AANHPI perinatal health [10–17].
Evidence suggests that, relative to non-Hispanic White birthing populations (typically the most privileged group in terms of racial and ethnic hierarchies in the US), AANHPI individuals are at increased risk for poor maternal and infant outcomes such as gestational diabetes, gestational hypertension, cesarean birth, and low birthweight [15,18–20]. Furthermore, it appears that the prevalence of perinatal conditions and outcomes vary considerably within AANHPI ethnic groups [10,13,15,18,21]. However, current understanding of perinatal risks among disaggregated AANHPI ethnic groups is extremely limited [7].
Understanding the variability between AANHPI ethnic groups with respect to maternal and fetal health is important in light of the US maternal health crisis, which includes increasing rates of maternal mortality and morbidity with persistent racial and/or ethnic disparities [22]. This work is crucial for understanding and addressing the unique health needs of the diverse AANHPI communities.
To address these gaps in knowledge, we conducted a descriptive analysis of risk factors and outcomes related to maternal and infant health among disaggregated ethnic groups of AANHPI populations in California, with the goal of assessing the variability between ethnic groups relative to each other as well as the combined “AANHPI” total. We focused on California due to its large, diverse AANHPI population (comprising 17% of its births, the most of any state in the US) and its availability of linked hospital discharge and vital record data, which facilitates broader inquiries related to maternal and infant outcomes than vital records alone.
Materials and methods
Dataset
This population-based study used data from the Department of Health Care Access and Information (HCAI, formerly the Office of Statewide Health Planning and Development), part of the California Health and Human Services Agency. Information from vital records (birth and fetal death certificates) linked with maternal hospital discharge records for births in California from 2007 to 2018 was used; linkage was successful for 96% of births [23]. Additionally, we linked data from the American Community Survey (ACS) from the US Census Bureau with maternal residential census tract (referred to as ‘neighborhood’), derived from geocoded addresses reported in vital records.
Study population
Starting with all hospital births in California from 2007 to 2018, we excluded births that had unsuccessful linkage of the maternal discharge record and vital record (Fig. 1). Next, we selected records with any AANHPI race and/or ethnicity, based on self-report in vital records. For study variables with > 1% missing information, records were retained with missingness as an informative category; we excluded records with missing information on study variables with ≤1% missing information as due to small cell sizes for certain populations. Our final study population included 904,232 births, born to 676,015 individuals (Fig. 1).
Fig. 1.
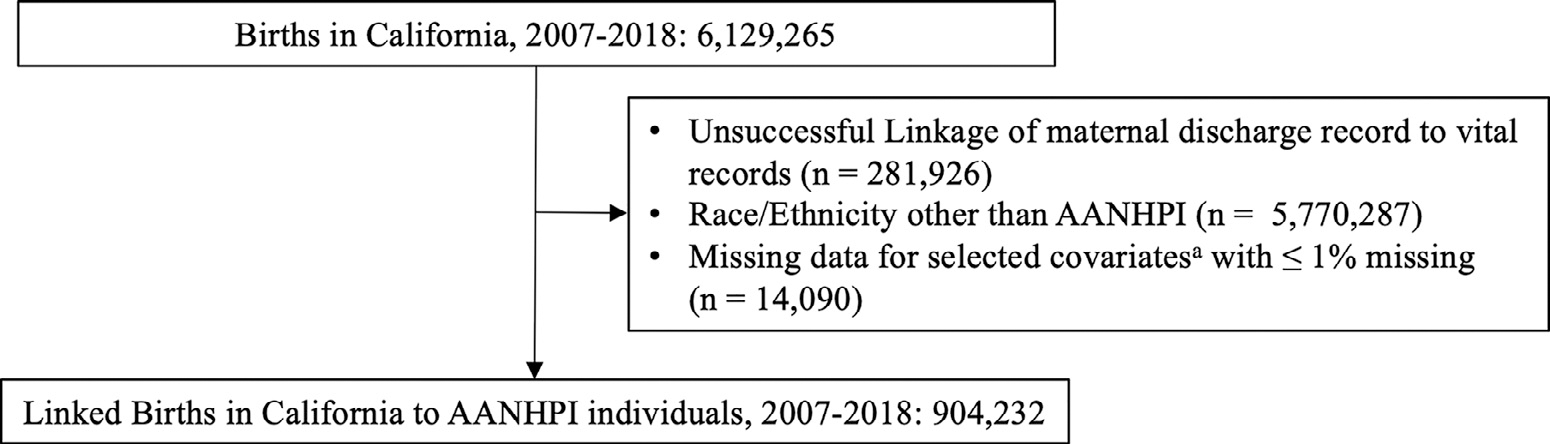
Study Cohort. A Factors include nativity, principal language spoken, neighborhood poverty, payer, smoking 3 months prior to pregnancy, smoking during pregnancy, parity, multiples, gestational age, infant sex and missing birth weight or birthweight 〈 200 g or 〉 9000 g. Abbreviations: AANHPI Asian American Native Hawaiian Pacific Islander.
Study variables
We considered the following 15 categories of AANHPI race and/or ethnicity, based on self-report in vital records: Chinese, Korean, Japanese, Filipino, Hmong, Vietnamese, Cambodian, Laotian, Thai, Indian, Other-Asian, Guamanian, Hawaiian, Samoan, Other-Pacific Islander. Other-Asian included all records classified as “Asian, unspecified” and “Asian, specified,” as the write-in field for specification was not available. Other-Pacific Islander was defined in the vital record as “Pacific Islander excluding Hawaiian, Guamanian, and Samoan. ” Ethnic groups are ordered for presentation by geographic region and sample size within given regions. For individuals with multiple races, we applied the following algorithm based on three fields for maternal race available in the vital record: if an individual was identified as having multiple races and only one of the three fields was AANHPI, they were assigned to that AANHPI ethnic group, or if an individual was of multiple races, and 2 or 3 of the maternal race fields were AANHPI, they were assigned to the AANHPI ethnic group listed in the earliest field.
We examined sociodemographic and clinical risk factors associated with maternal and infant health as well as birth outcomes, broadly conceptualized in the following categories: (1) indicators of social disadvantage, (2) maternal risk factors, (3) pregnancy-related conditions and perinatal outcomes. They are defined in detail in STable 1. Our analysis focused on birth outcomes with high public health significance and known risk factors for them that were available in these data [24–29].
Statistical analysis
We conducted a descriptive analysis of crude prevalence rates among disaggregated AANHPI ethnic groups to examine the variability among maternal risk factors and perinatal outcomes between ethnic groups and relative to the aggregated total. We conducted chi-square tests to compare group frequencies to compare whether the distributions varied by ethnicity. We dichotomized each variable and created a “heat map” that reflects the percentile (n = 10) of the prevalence for a particular group (relative to the entire distribution). For each risk factor (i.e., row), the color gradient ranges from green (typically lower prevalence) to red (typically higher prevalence), unless stated otherwise. We designate each risk factor as high or low risk based on perinatal literature regarding the association of each factor with greater risk of adverse outcomes in the US [30,31]. We included the estimates for all linked births in CA (n = 5847,339) in the heat map, as a comparator.
In order to summarize the heat map and evaluate which AANHPI ethnic groups had the most high- or low-risk scores on the variables we studied, we summed the number of variables that were in the highest or lowest 3 among all the ethnic groups ranked by prevalence. For this summary, we counted the following variables only once, even though they are presented in two ways in the heat map: educational attainment, neighborhood poverty, and prenatal care initiation. Given that unlinked births were excluded, we compared the distribution of these risk factors and outcomes for the overall population for linked and unlinked births to AANHPI individuals, to assess if excluding unlinked births introduced bias.
Sensitivity analysis
In order to address the concern of the same individual contributing multiple births to the study sample, i.e., the clustering of infants within the same mother (which could bias the prevalence of outcomes with a recurrence risk such as preterm birth and small-for-gestational age [SGA] [32]), we recreated the heatmap analysis in a cohort of one birth randomly selected per individual. Among the unique individuals in the original sample, 43.7% (n = 383,727) contributed multiple pregnancies.
This study was approved by the Committee for the Protection of Human Subjects (17–04–2932) and Stanford IRB (43,029) protocols. All analyses were performed in SAS 9.4 (Cary, NC).
Results
The study population included 904,232 births in California from 2007 to 2018 (Fig. 1). Among the 15 reported AANHPI ethnic groups, the largest group was Chinese (26.2%), and the smallest group was Guamanian (0.5%). The median age in the entire sample was 32 years (IQR: 28–35 years) and 46.5% of births were nulliparous. The overall prevalence of cesarean birth among AANHPI populations was 32.7%, 1.5% of individuals experienced severe maternal morbidity (SMM), and 6.6% of births were moderately preterm (32 to 37 weeks). Unlinked records had different distributions of factors of interest relative to linked AANHPI births, especially with regards to education (high school or less: 18% vs. 23% for linked and unlinked, respectively), payer (public: 23% vs. 53%), nulliparity (46% vs. 40%), and cesarean birth (33% vs. 21%; STable 2).
The heat map in Table 1 presents the distribution of risk factors for each AANHPI group, with the final column presenting the estimate from aggregating across ethnic groups. If ethnic groups were homogenous for a given risk factor, we would expect the frequencies across a row to be similar to the aggregated value; however, we observe wide ranges of frequencies between ethnic groups. Similarly, if ethnic groups were similar to each other with respect to multiple risk factors, we would expect the frequencies and colors between two given ethnic groups to be similar; how-ever, we observe that no two ethnic groups have the same pattern.
Table 1.
Heat map of risk factors and perinatal outcomes (as percentages) by AANHPI ethnic groups, among people giving birth in California 2007–2018 (n = 904,232)
| Group | Chinese | Korean | Japanese | Filipino | Hmong | Victnames | Cambodian | Laotlan | Thai | Indian | Asian-Other | Guamanian | Hawallan | Samoan | PI-Other | ALL AANHPI | ALL CA births |
|---|---|---|---|---|---|---|---|---|---|---|---|---|---|---|---|---|---|
| N | 236,898 | 58,187 | 39,897 | 184,565 | 27,192 | 85,454 | 20,530 | 9,786 | 9,886 | 132,046 | 57,624 | 4,516 | 9,228 | 10,486 | 17,937 | 904,232 | 5,847,339 |
|
| |||||||||||||||||
| Indicators of Social Disadvantage | |||||||||||||||||
| Foreign-bom | 84.1 | 77.9 | 46.4 | 60.3 | 47.1 | 84.4 | 59.6 | 55.5 | 75.9 | 90.5 | 49.8 | 32.4 | 1.4 | 24.6 | 46.8 | 71.4 | 40.6 |
| Principal language: Not English | 44.8 | 19.5 | 13.0 | 2.6 | 16.9 | 25.8 | 6.5 | 7.7 | 10.8 | 7.7 | 8.6 | 0.4 | 0.2 | 0.7 | 2.2 | 19.5 | 19.8 |
| High school education or less | 10.0 | 6.4 | 12.2 | 15.8 | 47.7 | 29.8 | 49.0 | 47.9 | 22.9 | 9.2 | 18.4 | 41.4 | 38.9 | 55.8 | 43.2 | 17.6 | 44.7 |
| College education or higher* | 70.8 | 74.2 | 60.6 | 48.4 | 16.4 | 43.2 | 18.1 | 16.1 | 52.4 | 79.1 | 59.8 | 17.8 | 21.8 | 7.6 | 16.8 | 57.7 | 26.9 |
| Low-poverty neighborhoodb,* | 38.7 | 37.7 | 43.0 | 37.8 | 10.9 | 31.6 | 19.2 | 18.8 | 32.2 | 49.0 | 37.5 | 30.9 | 30.6 | 19.9 | 27.1 | 37.3 | 24.5 |
| High-poverty neighborhoodb | 9.7 | 12.5 | 9.1 | 11.7 | 49.0 | 13.9 | 33.1 | 37.5 | 17.9 | 7.4 | 13.6 | 14.7 | 15.9 | 24.6 | 20.4 | 13.1 | 25.0 |
| Public payer | 13.1 | 16.4 | 13.2 | 23.2 | 63.2 | 32.5 | 52.1 | 52.0 | 33.1 | 13.7 | 26.4 | 38.1 | 40.1 | 56.5 | 46.6 | 22.8 | 47.8 |
|
| |||||||||||||||||
| Maternal Risk Factors | |||||||||||||||||
| Age < 20 years | 0.2 | 0.4 | 1.5 | 2.7 | 7.9 | 0.9 | 5.9 | 7.3 | 1.9 | 0.3 | 2.1 | 8.8 | 7.7 | 8.5 | 5.2 | 1.8 | 7.0 |
| Age ≥ 35 years | 35.0 | 37.4 | 41.3 | 28.7 | 9.5 | 33.3 | 17.0 | 18.0 | 30.2 | 18.7 | 27.3 | 15.4 | 16.5 | 12.4 | 16.3 | 28.8 | 19.6 |
| Low height (< 61”) | 7.9 | 5.5 | 12.0 | 22.0 | 51.1 | 25.8 | 21.8 | 29.6 | 16.3 | 9.4 | 13.2 | 16.4 | 7.9 | 2.0 | 8.6 | 15.0 | 12.3 |
| Progestational diabetes | 0.8 | 0.9 | 0.8 | 2.0 | 1.1 | 1.2 | 1.1 | 1.2 | 1.0 | 1.6 | 1.3 | 2.3 | 1.3 | 2.8 | 2.6 | 1.3 | 1.3 |
| Progestational hypertension | 1.0 | 1.5 | 2.0 | 4.3 | 1.6 | 1.1 | 1.2 | 1.8 | 1.6 | 1.4 | 2.0 | 3.8 | 3.5 | 3.4 | 3.3 | 2.0 | 2.1 |
| Smoking before pregnancy | 0.4 | 1.5 | 3.1 | 2.4 | 1.7 | 0.6 | 1.9 | 3.1 | 1.8 | 0.2 | 1.7 | 7.2 | 8.3 | 7.7 | 5.1 | 1.5 | 1.1 |
| Underweight pre-preg. BMIc | 11.4 | 10.9 | 8.6 | 4.2 | 2.6 | 12.7 | 7.4 | 5.7 | 9.3 | 4.9 | 6.2 | 2.4 | 2.6 | 0.6 | 2.6 | 7.8 | 3.7 |
| Obese pre-preg. BMIc | 2.6 | 3.8 | 8.4 | 13.0 | 18.8 | 3.0 | 10.4 | 14.1 | 8.2 | 7.8 | 9.1 | 28.5 | 27.4 | 50.9 | 35.9 | 8.7 | 20.8 |
| Early PNCd,* | 84.9 | 88.7 | 89.0 | 85.1 | 71.1 | 85.4 | 77.6 | 77.4 | 83.5 | 90.2 | 85.6 | 77.2 | 78.4 | 65.2 | 71.1 | 84.9 | 81.9 |
| Late or no PNCd | 4.7 | 1.9 | 1.4 | 2.2 | 2.8 | 1.6 | 3.1 | 3.1 | 2.1 | 1.3 | 2.0 | 3.7 | 4.0 | 7.3 | 6.3 | 2.8 | 3.0 |
| Low GWGe | 24.7 | 25.2 | 29.0 | 18.5 | 29.4 | 27.1 | 23.6 | 23.6 | 20.3 | 24.0 | 21.1 | 13.2 | 13.5 | 9.6 | 14.3 | 23.1 | 19.8 |
| High GWGe | 30.1 | 33.2 | 32.2 | 45.6 | 30.2 | 31.1 | 35.7 | 39.4 | 40.0 | 37.0 | 39.5 | 56.5 | 58.0 | 67.3 | 56.9 | 37.0 | 44.8 |
| Nulliparous | 50.3 | 50.6 | 51.2 | 42.9 | 27.4 | 43.7 | 39.9 | 34.4 | 49.2 | 50.9 | 48.8 | 40.2 | 40.5 | 34.8 | 37.8 | 46.5 | 44.8 |
| High parity: 3+ | 10.1 | 13.4 | 14.5 | 22.9 | 48.6 | 18.5 | 27.9 | 35.0 | 19.1 | 8.8 | 16.8 | 30.3 | 30.0 | 40.4 | 33.5 | 17.2 | 28.8 |
| Plurality: Multiple birth | 1.8 | 1.6 | 22 | 1.4 | 0.8 | 1.4 | 1.0 | 1.1 | 1.8 | 1.9 | 1.7 | 1.4 | 1.7 | 1.5 | 1.5 | 1.6 | 1.6 |
|
| |||||||||||||||||
| Pregnancy-related conditions and perinatal outcomes | |||||||||||||||||
| GDM | 13.1 | 9.0 | 9.3 | 15.9 | 12.1 | 16.3 | 10.9 | 12.3 | 13.4 | 17.8 | 12.9 | 12.4 | 9.3 | 9.7 | 13.9 | 14.1 | 9.5 |
| II DP | 3.6 | 4.1 | 5.8 | 10.1 | 5.0 | 3.7 | 5.1 | 6.3 | 5.7 | 5.6 | 6.5 | 10.4 | 9.4 | 10.7 | 10.0 | 6.0 | 7.4 |
| Cesarean, overall | 33.0 | 30.6 | 29.0 | 34.9 | 13.8 | 32.6 | 24.9 | 23.1 | 31.8 | 37.5 | 31.5 | 32.3 | 32.2 | 34.1 | 32.7 | 32.7 | 32.6 |
| Cesarean, low-risk births | 25.4 | 26.3 | 25.2 | 31.6 | 13.6 | 28.8 | 22.7 | 21.3 | 27.9 | 32.4 | 28.4 | 27.0 | 27.7 | 29.2 | 29.6 | 28.1 | 27.5 |
| Severe Maternal Moibidity | 1.4 | 1.2 | 1.3 | 1.9 | 1.6 | 1.3 | 1.3 | 1.4 | 1.5 | 1.5 | 1.5 | 1.4 | 1.7 | 1.8 | 2.1 | 1.5 | 1.5 |
| Moderately preterm (32–<37 wks) | 5.2 | 4.9 | 6.4 | 8.7 | 5.9 | 6.8 | 8.4 | 8.6 | 6.8 | 6.5 | 6.7 | 8.8 | 7.6 | 7.1 | 7.7 | 6.6 | 6.8 |
| Very preterm (<32 wks) | 0.7 | 0.8 | 1.0 | 1.6 | 1.3 | 1.0 | 1.7 | 1.9 | 1.3 | 1.2 | 1.1 | 1.4 | 1.6 | 1.7 | 1.6 | 1.1 | 1.4 |
| SGA | 12.0 | 10.8 | 13.6 | 13.4 | 14.1 | 14.2 | 15.4 | 15.8 | 13.3 | 18.7 | 13.0 | 9.8 | 9.3 | 6.5 | 9.8 | 13.6 | 10.3 |
| LGA | 5.6 | 6.6 | 6.2 | 7.2 | 5.2 | 4.7 | 5.0 | 5.4 | 6.2 | 4.8 | 6.9 | 11.6 | 11.2 | 19.3 | 15.3 | 6.3 | 9.9 |
| Very low birthweight | 0.6 | 0.7 | 0.9 | 1.5 | 1.2 | 0.9 | 1.4 | 1.7 | 1.2 | 1.2 | 1.1 | 1.1 | 1.3 | 1.3 | 1.4 | 1.0 | 1.2 |
| Very high birthweight | 4.5 | 5.8 | 5.3 | 5.2 | 4.3 | 3.2 | 3.4 | 3.6 | 4.6 | 3.9 | 5.7 | 8.6 | 9.1 | 16.3 | 12.9 | 5.0 | 8.1 |
Abbreviations: AANHPI, Asian American, Native Hawaiian, Pacific Islander, BMI body mass index, GDM gestational diabetes mellitus, GWG gestational weight gain, HDP hypertensive disorders of pregnancy, LGA large for gestational age, NTSV nulliparous transverse singleton vertex, PNC prenatal care, SGA small for gestational age. Note: Green represents low risk and red represents high risk. For most factors this corresponds to going from low to high frequency.
Note: For factors marked with * the color gradient is reversed.
Low-poverty neighborhood corresponds to < 25th percentile for percentage of households below poverty level, while high-poverty neighborhood corresponds to ≥75th percentile for percentage of households below poverty level.
Underweight is BMI < 18.5 and Overweight is BMI ≥ 30.
Early PNC corresponds to initiation of care in 1st trimester, Late or no PNC corresponds to initiation of care in 3rd trimester, or no care initiated.
GWG is predicted value at 40 weeks, according to Institute of Medicine guidelines (STable 1).
Substantial variability exists between ethnic groups for the assessed risk factors and outcomes (Table 1, STable 3). When considering indicators of social disadvantage, prevalence ranged widely, for example from 6.4% among Koreans to 55.8% Samoans for education attainment at high school-level or less, compared to 17.6% among all AANHPI births and 44.7% among all births in California, and from 13.1% for Chinese to 63.2% for Hmong for public insurer, compared to 22.8% among all AANHPI birth and 47.8% among all births in California. For sociodemographic factors predictive of adverse pregnancy outcomes, prevalence ranged from 0.2% among Chinese to 8.8% among Guamanians for maternal age <20 years, compared to 1.8% among all AANHPI births and 7.0% among all births in California, and from 65.2% among Samoans to 90.2% among Indians for early initiation of prenatal care, compared to 84.9% for all AANHPI births and 81.9% for all births in California. Perinatal outcomes also varied significantly (e.g., SMM: 1.2% Korean; 2.1% Other PI). All examined risk factors and outcomes had P < .001 when comparing frequencies between ethnic groups.
Table 2 presents a tally of the number of risk factors or outcomes for which a group is in the 3 highest risk ethnic groups or 3 lowest risk ethnic groups. For indicators of social disadvantage, the Cambodian ethnic group had relatively more risk factors at the higher extremes (n = 3), although Chinese and Indian ethnic groups had more risk factors at the lower extremes (n = 3) as well. Notably, Filipino, Hmong, Vietnamese, Cambodian, Laotian, and Thai ethnic groups had no indicators of social disadvantage at the lowest risk extreme. For maternal risk factors, Samoan, Guamanian, and Hmong ethnic groups had relatively more risk factors at the higher extremes (n = 7, 5, and 5, respectively), while the Chinese and Korean ethnic groups had more at the lower extremes (n = 7 and 6, respectively). For pregnancy related conditions and perinatal outcomes, Filipino and Samoan ethnic groups had more outcomes at the higher risk extremes (n = 7 and 6, respectively), while the Korean ethnic group had the most at the lower risk extremes (n = 6). No single group was consistently in the highest or lowest risk extremes across all examined risk factors or perinatal outcomes.
Table 2.
Number of study variables among each AANHPI group that were within the 3 highest-risk or 3 lowest-risk values among all ranked AANHPI ethnic groups: California 2007–2018 (n = 904,232)a
| Subgroup | N (%) | Indicators of Social Disadvantage (5 variables) | Maternal Risk Factors (14 variables) | Pregnancy-related conditions and perinatal outcomes (11 variables) | |||
|---|---|---|---|---|---|---|---|
|
|
|
|
|||||
| 3 Highest risk variables # | 3 Lowest risk variables # | 3 Highest risk variables # | 3 Lowest risk variables # | 3 Highest risk variables # | 3 Lowest risk variables # | ||
|
| |||||||
| Chinese | 236,898 (26.2%) | 2 | 3 | 2 | 7 | 0 | 4 |
| Korean | 58,187 (6.4%) | 1 | 1 | 3 | 6 | 0 | 6 |
| Japanese | 39,897 (4.4%) | 0 | 2 | 4 | 2 | 0 | 4 |
| Filipino | 184,565 (20.4%) | 0 | 0 | 1 | 0 | 7 | 0 |
| Hmong | 27,192 (3.0%) | 2 | 0 | 5 | 5 | 0 | 3 |
| Vietnamese | 85,454 (9.5%) | 2 | 0 | 3 | 4 | 1 | 4 |
| Cambodian | 20,530 (2.3%) | 3 | 0 | 0 | 2 | 2 | 4 |
| Laotian | 9,786 (1.1%) | 2 | 0 | 2 | 2 | 4 | 3 |
| Thai | 9,886 (1.1%) | 0 | 0 | 1 | 0 | 0 | 0 |
| Indian | 132,046 (14.6%) | 1 | 3 | 2 | 4 | 4 | 1 |
| Other, Asian | 57,624 (6.4%) | 0 | 0 | 0 | 0 | 0 | 0 |
| Guamanian | 4,516 (.5%) | 0 | 2 | 5 | 3 | 3 | 0 |
| Hawaiian | 9,228 (1.0%) | 0 | 2 | 3 | 2 | 1 | 2 |
| Samoan | 10,486 (1.2%) | 2 | 2 | 7 | 5 | 6 | 1 |
| Other, PI | 17,937 (2.0%) | 0 | 0 | 4 | 0 | 5 | 1 |
Abbreviations: AANHPI, Asian American, Native Hawaiian, Pacific Islander, PI Pacific Islander.
The high extreme comprises binary variables with 3 highest frequencies, and low extreme binary variables with 3 lowest frequencies. See Table 1 for the list of 33 binary variables examined.Note: For highest risk rankings, green represents a low number of variables while for lowest risk rankings green represents a high number of variables, and vice versa for red (e.g., in the first cell of the table, ‘2’ means that among Chinese individuals, 2 of the indicators of social disadvantage were among the highest 3 values for all AANHPI groups; in contrast, in the next cell, the ‘3’ means that among Chinese individuals, 3 of the indicators of social disadvantage were among the lowest 3 values for all AANHPI groups).
Results for the sensitivity analysis of one birth randomly selected per individual are presented in Supplemental Table 4 and are similar to our findings from the main study cohort (n = 676,015).
Discussion
Summary of findings
We observed significant variability among the distribution of sociodemographic and clinical risk factors for perinatal health, as well as perinatal outcomes, by AANHPI race and/or ethnicity in California. These findings indicate that when examining racial and/or ethnic disparities, comparing the combined AANHPI category to the total population is misleading; instead, the disaggregated AANHPI ethnic groups offer a clearer picture of differences and disparities.
Interpretation
In this study, although some ethnic groups shared relatively similar distributions of some risk factors and outcomes, no two ethnic groups were consistently alike across all examined risk factors and outcomes, supporting our hypothesis that treating AANHPI as a single homogenous group masks the true distribution of these risk factors. Additionally, no single group was consistently better or worse off across the assessed categories of indicators of social disadvantage, maternal risk factors, and pregnancy related conditions and perinatal outcomes. However, certain populations such as Samoan, Indian, and Other PI had the greatest number of high-risk variables across all examined risk factors and outcomes.
Although certain ethnic groups shared similar distributions for some risk factors and outcomes, there is still substantial variability between other risk factors and outcomes. For example, Chinese, Korean and Japanese populations have similar prevalence as seen in the heat map for sociodemographic factors like education, payer, neighborhood poverty, as well as prevalence of outcomes like preterm birth and very low birth weight; however, these groups have different prevalence for other risk factors and outcomes including nativity, gestational diabetes, and cesarean birth. Similarly, when Pacific Islander ethnic groups are considered separately from the other populations, there is still substantial variability between Hawaiian, Guamanian, and Samoan populations.
Furthermore, within ethnic groups, associations between risk factors and outcomes are sometimes not as expected. For example, the ethnic groups with highest obesity and social disadvantage rates are not necessarily the ones with the highest rates of gestational diabetes, HDP and cesarean birth [33,34]. Similarly, ethnic groups with higher cesarean rates or later prenatal care do not necessarily have higher rates of SMM [35]. These observations support the merit of framing future research questions that drill down to the most granular ethnic groups of race and/or ethnicity available for AANHPI. Until this is explored, the healthcare system cannot understand how best to meet AANHPI communities’ health needs. Additionally, these findings support the necessity of considering social and contextual factors to determine these population risk factor profiles do not line up with the expected outcome profiles for certain AANHPI ethnic groups.
Even with the disaggregation of AANHPI ethnic groups, without additional information, interpreting the “Other” categories (i.e., non-specific categories reported in the vital record) is challenging. For example, none of the variables for “Other, Asian” had the three highest or lowest risk rankings, supporting that this category is likely a blend of the other AANHPI groups, and similar to the overall AANHPI group, masks the variability between ethnic groups.
Limited studies have examined the distribution of risk factors for maternal and infant health, disaggregated across multiple AANHPI ethnic groups, using large population-based datasets. An extensive literature review by Hata et al. (2020) examined studies assessing maternal health disparities among AANHPI populations; only 8 of 22 studies reported their results in some form of disaggregated racial and/or ethnic groups [7]. The authors emphasize the need for disaggregated research in order to meet the diverse needs of AANHPI communities and address racial/ethnic disparities.
The distribution of some risk factors and outcomes in our study is consistent with available literature on AANHPI populations; our estimates were largely in line with studies that examined geographies including Texas, Southern California, and the entirely of the US, for factors such as insurance, nativity [16,17], payer [17], education [16,17,36], prenatal care [36], nulliparity [16], pre-pregnancy BMI [15,16], GWG [16], GDM [16,18,36], HDP [16,36], cesarean birth [16,37], low birth weight [16,36,37], preterm birth [37], and SMM [38]. While estimates for given factors might have differed between our study and others due to time period or geography, our findings add to the evidence of the variability among these perinatal risk factors and outcomes among AANHPI ethnic groups.
Implications and next steps
Our study contributes to limited prior literature providing disaggregated findings for AANHPI ethnic groups in relation to perinatal health. Disparities experienced by AANHPI populations in the US cannot be understood, much less improved, without data collection that allows for reporting of granular AANHPI ethnic groups and further descriptive evidence. We hope this analysis encourages researchers to disaggregate results by AANHPI ethnic groups whenever possible, which is a first step toward better understanding of the diverse health needs and conditions of these communities.
Additionally, evidence is growing that the health experiences of immigrant or foreign-born AANHPI populations differ from those of US-born AANHPI populations [15, 39–42]. Disaggregated effect modification of perinatal outcomes by nativity represents an important area of further inquiry.
Strengths and limitations
This population-based dataset provides information from a large, diverse, contemporary cohort of AANHPI births and uses linked data that facilitate rigorous study of perinatal health. With 1 in 6 births occurring to an AANHPI individual, California has a larger and more diverse AANPHI population than any other state [1]. Linkage with hospital discharge data facilitates more rigorous study of maternal health than vital records [23]. This study examines 15 racial and/or ethnic group classifications a granular level, using self-reported race and/or ethnicity from the vital record; the majority of existing disaggregated research examines only a subset of these ethnic groups [15–18,36,43].
Our study should be viewed in light of its design. First, it possible that we have incorrectly categorized populations with multiple races. If an individual was mixed race, but had only one AANHPI ethnic group listed, they were assigned to that ethnic group; however, if a mixed-race individual had multiple AANHPI ethnic groups listed on their vital record, we had to assign them to a group, as we deemed that a AANHPI “mixed-race” category would not be informative. This comprised 1.7% of our study population (n = 15,877; 0.1% Hmong to 35% Hawaiian). Furthermore, 8.4% of the study population was categorized as “Other Asian” or “Other PI”; results for these populations are challenging to interpret. Second, unlinked records had different distributions of maternal characteristics and perinatal outcomes relative to linked AANHPI births. For example, the proportions of AANHPI ethnic groups varied by linkage status: Higher proportion of Chinese (26% vs. 16%), Vietnamese (9% vs. 5%), and Indian (15% vs. 6%) infants were observed in linked data while higher proportion of Japanese (9% vs. 4%), Filipino (34% vs. 20%), and Other Asian (10% vs. 6%) infants were observed in the unlinked data (Supplemental Table 2). Hence, our findings in linked records might not be generalizable to unlinked records. However, 2.2% of records in this population were unlinked so it is unlikely that our findings are substantially biased by the exclusion of unlinked births. Third, this study considered linked vital record and discharge data only; it would be of value of examine this question using prospectively collected data on culture, acculturation, behaviors, structural, and social determinants of health (including racism and discrimination in health care). Finally, our estimates are unadjusted and subject to confounding, and hence do not serve as causal evidence for links between risk factors and outcomes. Our focus in this work was to descriptively highlight the range in prevalence for perinatal risk factors and outcomes between AANHPI ethnic groups. These findings demonstrate the need for maternal and perinatal research to disaggregate AANHPI populations for future research questions using quantitative methods.
Conclusions
In this study, we found substantial variability in risk factors and outcomes for perinatal health between AANHPI ethnic groups themselves and compared to the aggregated Overall AANHPI category. Patterns between risk factors and ethnic groups were not always consistent, e.g., some ethnic groups that seemed to have pre-pregnancy social or health advantages did not necessarily have the best health outcomes. The use of a single combined AANHPI category masks the variability and diversity in risk factors and outcomes for perinatal health among AANHPI communities. This work emphasizes the importance of considering disaggregated group classifications in future work on AANHPI health for the development of effective and tailored strategies for improving maternal and fetal outcomes among AANHPI ethnic groups.
Supplementary Material
Acknowledgments
This paper was supported by a seed grant from the Stanford Center for Asian Health Research and Excellence (CARE), the National Institute of Nursing Research of the National Institutes of Health (NR017020), and Eunice Kennedy Shriver National Institute of Child Health & Human Development (R01HD094847-01). The content is solely the responsibility of the authors and does not necessarily represent the official views of the NIH. The funders had no role in study design, data collection and analysis, decision to publish, or preparation of the manuscript.
Footnotes
The authors declare that they have no known competing financial interests or personal relationships that could have appeared to influence the work reported in this paper.
References
- [1].Budiman A, Ruiz N. Key facts about asian origin groups in the u.s; 2021. .;. [Google Scholar]
- [2].Tseng W, Berkeley UC, Mcdonnell DD, Ho W, Lee C, Wong S. Ethnic Health Assessment for Asian Americans, Native Hawaiians, and Pacific Islanders in California. Asian & Pacific Islander American Health Forum; 2010. [Google Scholar]
- [3].Gomez SL, Glaser SL, Horn-Ross PL, Cheng Iona, Quach Thu, Clarke Christina A, et al. Cancer Research in Asian American, Native Hawaiian, and Pacific Islander Populations: accelerating Cancer Knowledge by Acknowledging and Leveraging Heterogeneity. Cancer Epidemiol Biomark Prev Publ Am Assoc Cancer Res Cosponsored Am Soc Prev Oncol 2014;23(11):2202. doi: 10.1158/1055-9965.EPI-14-0624. [DOI] [PMC free article] [PubMed] [Google Scholar]
- [4].Adia AC, Nazareno J, Operario D, Ponce NA Health Conditions, Outcomes, and Service Access Among Filipino, Vietnamese, Chinese, Japanese, and Korean Adults in California, 2011–2017. 2020;110(4):520–6. doi: 10.2105/AJPH.2019.305523 [DOI] [PMC free article] [PubMed] [Google Scholar]
- [5].Doàn LN, Takata Y, Sakuma KLK, Irvin VL. Trends in Clinical Research Including Asian American, Native Hawaiian, and Pacific Islander Participants Funded by the US National Institutes of Health, 1992 to 2018. JAMA Netw Open 2019;2(7):197432. doi: 10.1001/jamanetworkopen.2019.7432. [DOI] [PMC free article] [PubMed] [Google Scholar]
- [6].Ghosh C Healthy People 2010 and Asian Americans/Pacific Islanders: defining a Baseline of Information. Am J Public Health 2003;93(12):2093–8. doi: 10.2105/AJPH.93.12.2093. [DOI] [PMC free article] [PubMed] [Google Scholar]
- [7].Hata J, Burke A. A Systematic Review of Racial and Ethnic Disparities in Maternal Health Outcomes among Asians/Pacific Islanders. AsianPacific Isl Nurs J 2020;5(3):139. doi: 10.31372/20200503.1101. [DOI] [PMC free article] [PubMed] [Google Scholar]
- [8].Gordon NP, Lin TY, Rau J, Lo JC. Aggregation of Asian-American subgroups masks meaningful differences in health and health risks among Asian ethnicities: an electronic health record based cohort study. BMC Public Health 2019;19(1):1–14 2019 191. doi: 10.1186/S12889-019-7683-3. [DOI] [PMC free article] [PubMed] [Google Scholar]
- [9].Yi SS Taking Action to Improve Asian American Health. 2020;110(4):435–7. doi: 10.2105/AJPH.2020.305596 [DOI] [PMC free article] [PubMed] [Google Scholar]
- [10].Cripe SM, O’Brien W, Gelaye B, MA W. Maternal morbidity and perinatal outcomes among foreign-born Cambodian, Laotian, and Vietnamese Americans in Washington State, 1993–2006. J Immigr Minor Health 2011;13(3):417–25. doi: 10.1007/S10903-010-9328-6. [DOI] [PubMed] [Google Scholar]
- [11].Gong J, Savitz D, Stein C, Engel S. Maternal ethnicity and pre-eclampsia in New York City, 1995–2003. Pediatr Perinat Epidemiol 2012;26(1):45–52. doi: 10.1111/J.1365-3016.2011.01222.X. [DOI] [PMC free article] [PubMed] [Google Scholar]
- [12].Wan C, Abell S, Aroni R, Nankervis A, Boyle J, Teede H. Ethnic differences in prevalence, risk factors, and perinatal outcomes of gestational diabetes mellitus: a comparison between immigrant ethnic Chinese women and Australian-born Caucasian women in Australia. J Diabetes 2019;11(10):809–17. doi: 10.1111/1753-0407.12909. [DOI] [PubMed] [Google Scholar]
- [13].Hedderson MM, Darbinian JA, Ferrara A. Disparities in the risk of gestational diabetes by race-ethnicity and country of birth. Paediatr Perinat Epidemiol 2010;24(5):441. doi: 10.1111/J.1365-3016.2010.01140.X. [DOI] [PMC free article] [PubMed] [Google Scholar]
- [14].Williams A, Messer L, Kanner J, Ha S, Grantz K, Mendola P. Ethnic Enclaves and Pregnancy and Behavior Outcomes Among Asian/Pacific Islanders in the USA. J Racial Ethn Health Disparities 2020;7(2):224–33. doi: 10.1007/S40615-019-00650-4. [DOI] [PMC free article] [PubMed] [Google Scholar]
- [15].Singh GK, Siahpush M, Liu L, Allender M. Racial/Ethnic, Nativity, and Sociodemographic Disparities in Maternal Hypertension in the United States, 2014–2015. Int J Hypertens 2018;2018. doi: 10.1155/2018/7897189. [DOI] [PMC free article] [PubMed] [Google Scholar]
- [16].Cheng H, Walker L, Brown A, Lee J. Gestational weight gain and perinatal outcomes of subgroups of Asian-American women, Texas, 2009. Womens Health Issues Off Publ Jacobs Inst Womens Health 2015;25(3):303–11. doi: 10.1016/J.WHI.2015.01.003. [DOI] [PubMed] [Google Scholar]
- [17].Hoshiko S, Pearl M, Yang J, Aldous Kenneth M, Roeseler A, Dominquez Martha E, et al. Differences in Prenatal Tobacco Exposure Patterns among 13 Race/Ethnic Groups in California. Int J Environ Res Public Health Artic 2019 Published online. doi: 10.3390/ijerph16030458. [DOI] [PMC free article] [PubMed] [Google Scholar]
- [18].Pu J, Zhao B, Wang EJ, Nimbal Vani, Osmundson Sarah, Kunz Liza, et al. Racial/Ethnic Differences in Gestational Diabetes Prevalence and Contribution of Common Risk Factors. Paediatr Perinat Epidemiol 2015;29(5):436–43. doi: 10.1111/PPE.12209. [DOI] [PMC free article] [PubMed] [Google Scholar]
- [19].Rao AK, Daniels K, El-Sayed YY, Moshesh MK, Caughey AB. Perinatal outcomes among Asian American and Pacific Islander women. Am J Obstet Gynecol 2006;195(3):834–8. doi: 10.1016/j.ajog.2006.06.079. [DOI] [PubMed] [Google Scholar]
- [20].Janevic T, Egorova NN, Zeitlin J, Balbierz A, Hebert PL, Howell EA. Examining trends in obstetric quality measures for monitoring health care disparities. Med Care 2018;56(6):470–6. doi: 10.1097/MLR.0000000000000919. [DOI] [PMC free article] [PubMed] [Google Scholar]
- [21].Qin C, Gould JB. The Asian birth outcome gap. Paediatr Perinat Epidemiol 2006;20(4):279–89. doi: 10.1111/J.1365-3016.2006.00737.X. [DOI] [PubMed] [Google Scholar]
- [22].D’Alton ME, Friedman A, Bernstein P, Brown Haywood L, Callaghan William M, Clark L Steven, et al. Putting the “M” back in maternal-fetal medicine: a 5-year report card on a collaborative effort to address maternal morbidity and mortality in the United States. Am J Obstet Gynecol 2019;221(4):311–17 e1. doi: 10.1016/J.AJOG.2019.02.055. [DOI] [PMC free article] [PubMed] [Google Scholar]
- [23].Herrchen B, Gould JB, Nesbitt TS. Vital Statistics Linked Birth/Infant Death and Hospital Discharge Record Linkage for Epidemiological Studies. Comput Biomed Res 1997;30(4):290–305. doi: 10.1006/CBMR.1997.1448. [DOI] [PubMed] [Google Scholar]
- [24].Leonard SA, Main EK, Carmichael SL. The contribution of maternal characteristics and cesarean delivery to an increasing trend of severe maternal morbidity. BMC Pregnancy Childbirth 2019;19(1). doi: 10.1186/s12884-018-2169-3. [DOI] [PMC free article] [PubMed] [Google Scholar]
- [25].Bane S, Simard JF, Wall-Wieler E, Butwick AJ, Carmichael SL. Subsequent risk of stillbirth, preterm birth, and small for gestational age: a cross-outcome analysis of adverse birth outcomes. Paediatr Perinat Epidemiol 2022. Published online April 18. doi: 10.1111/ppe.12881. [DOI] [PubMed] [Google Scholar]
- [26].Howland RE, Angley M, Won SH, Wilcox Wendy, Searing Hannah, Liu Sze Y, et al. Determinants of Severe Maternal Morbidity and Its Racial/Ethnic Disparities in New York City, 2008–2012. Matern Child Health J 2019;23(3):346–55. doi: 10.1007/s10995-018-2682-z. [DOI] [PubMed] [Google Scholar]
- [27].Cavazos-Rehg PA, Krauss MJ, Spitznagel EL, Bommarito K, Madden T, Olsen Margaret A, et al. Maternal age and risk of labor and delivery complications. Matern Child Health J 2015;19(6):1202–11. doi: 10.1007/s10995-014-1624-7. [DOI] [PMC free article] [PubMed] [Google Scholar]
- [28].Millar WJ, Chen J. Maternal education and risk factors for small-for-gestational-age births. Health Rep 1998;10(2):43–51 (Eng); 47–56 (Fre). [PubMed] [Google Scholar]
- [29].Parker JD, Schoendorf KC, Kiely JL. Associations between measures of socioeconomic status and low birth weight, small for gestational age, and premature delivery in the United States. Ann Epidemiol 1994;4(4):271–8. doi: 10.1016/1047-2797(94)90082-5. [DOI] [PubMed] [Google Scholar]
- [30].Crear-Perry J, Correa-De-Araujo R, Lewis Johnson T, Mclemore MR, Neilson E, Wallace M. Social and Structural Determinants of Health Inequities in Maternal Health. J Womens Health 2021;30(2):230. doi: 10.1089/JWH.2020.8882. [DOI] [PMC free article] [PubMed] [Google Scholar]
- [31].Gray KE, Wallace ER, Nelson KR, Reed SD, Schiff MA . Population-based study of risk factors for severe maternal morbidity. Paediatr Perinat Epidemiol 2012;26(6):506. doi: 10.1111/PPE.12011. [DOI] [PMC free article] [PubMed] [Google Scholar]
- [32].Malacova E, Regan A, Nassar N, Raynes-Greenow C, Leonard H, Srinivasjois R, et al. Risk of stillbirth, preterm delivery, and fetal growth restriction following exposure in a previous birth: systematic review and meta-analysis. BJOG Int J Obstet Gynaecol 2018;125(2):183–92. doi: 10.1111/1471-0528.14906. [DOI] [PubMed] [Google Scholar]
- [33].Barfield WD. Social disadvantage and its effect on maternal and newborn health. Semin Perinatol 2021;45(4):151407. doi: 10.1016/J.SEMPERI.2021.151407. [DOI] [PMC free article] [PubMed] [Google Scholar]
- [34].Athukorala C, Rumbold AR, Willson KJ, Crowther CA. The risk of adverse pregnancy outcomes in women who are overweight or obese. BMC Pregnancy Childbirth 2010;10:56. doi: 10.1186/1471-2393-10-56. [DOI] [PMC free article] [PubMed] [Google Scholar]
- [35].Lazariu V, Nguyen T, McNutt LA, Jeffrey J, Kacica M. Severe maternal morbidity: a population-based study of an expanded measure and associated factors. PLoS ONE 2017;12(8):e0182343. doi: 10.1371/JOURNAL.PONE.0182343. [DOI] [PMC free article] [PubMed] [Google Scholar]
- [36].Madan A, Palaniappan L, Urizar G, Wang Y, Fortmann SP, Gould JB. Socio-cultural factors that affect pregnancy outcomes in two Dissimilar Immigrant Groups in the United States. J Pediatr 2006;148(3):341–6. doi: 10.1016/j.jpeds.2005.11.028. [DOI] [PubMed] [Google Scholar]
- [37].Wong LF, Caughey AB, Nakagawa S, Kaimal AJ, Tran SH, Cheng YW. Perinatal outcomes among different Asian-American subgroups. Am J Obstet Gynecol 2008;199(4):382 e1–6. doi: 10.1016/j.ajog.2008.06.073. [DOI] [PubMed] [Google Scholar]
- [38].Wall-Wieler E, Bane S, Lee HC, Carmichael SL. Severe maternal morbidity among U.S.- and foreign-born Asian and Pacific Islander women in California. Ann Epidemiol 2020;52:60–3 e2. doi: 10.1016/J.ANNEPIDEM.2020.07.016. [DOI] [PMC free article] [PubMed] [Google Scholar]
- [39].Shah NS, Wang MC, Kandula NR, Carnethon MR, Gunderson EP, Grobman WA, et al. Gestational Diabetes and Hypertensive Disorders of Pregnancy by Maternal Birthplace. Am J Prev Med 2022;62(4):e223–31. doi: 10.1016/j.amepre.2021.10.007. [DOI] [PMC free article] [PubMed] [Google Scholar]
- [40].Desai S, Huynh M, Jones HE. Differences in Abortion Rates between Asian Populations by Country of Origin and Nativity Status in New York City, 2011–2015. Int J Environ Res Public Health 2021;18(12):6182. doi: 10.3390/ijerph18126182. [DOI] [PMC free article] [PubMed] [Google Scholar]
- [41].Shah NS, Kershaw KN, Khan SS. The Intersection of Nativity With Race and Ethnicity in Preeclampsia—Broadening the Assessment of Social Determinants of Maternal Health. JAMA Netw Open 2021;4(12):e2140674. doi: 10.1001/jamanetworkopen.2021.40674. [DOI] [PubMed] [Google Scholar]
- [42].Girsen AI, Mayo JA, Datoc IA, Karakash S, Gould JB, Stevenson DK, et al. Preterm birth outcomes among Asian women by maternal place of birth. J Perinatol Off J Calif Perinat Assoc 2020;40(5):758–66. doi: 10.1038/s41372-020-0633-1. [DOI] [PubMed] [Google Scholar]
- [43].Singh GK, DiBari JN. Marked Disparities in Pre-Pregnancy Obesity and Overweight Prevalence among US Women by Race/Ethnicity, Nativity/Immigrant Status, and Sociodemographic Characteristics, 2012–2014. J Obes 2019;2019. doi: 10.1155/2019/2419263. [DOI] [PMC free article] [PubMed] [Google Scholar]
- [44].Leonard SA, Hutcheon JA, Bodnar LM, Petito LC, Abrams B. Gestational Weight Gain-for-Gestational Age Z-Score Charts Applied across U.S. Populations. Paediatr Perinat Epidemiol 2018;32(2):161–71. doi: 10.1111/ppe.12435. [DOI] [PMC free article] [PubMed] [Google Scholar]
- [45].Hutcheon JA, Platt RW, Abrams B, Himes KP, Simhan HN, Bodnar LM. A weight-gain-for-gestational-age z score chart for the assessment of maternal weight gain in pregnancy. Am J Clin Nutr 2013;97(5):1062–7. doi: 10.3945/ajcn.112.051706. [DOI] [PMC free article] [PubMed] [Google Scholar]
- [46].Centers for Disease and Control and Prevention (CDC). How Does CDC Identify Severe Maternal Morbidity? 2022. Available at: https://www.cdc.gov/reproductivehealth/maternalinfanthealth/smm/severe-morbidity-ICD.htm
Associated Data
This section collects any data citations, data availability statements, or supplementary materials included in this article.