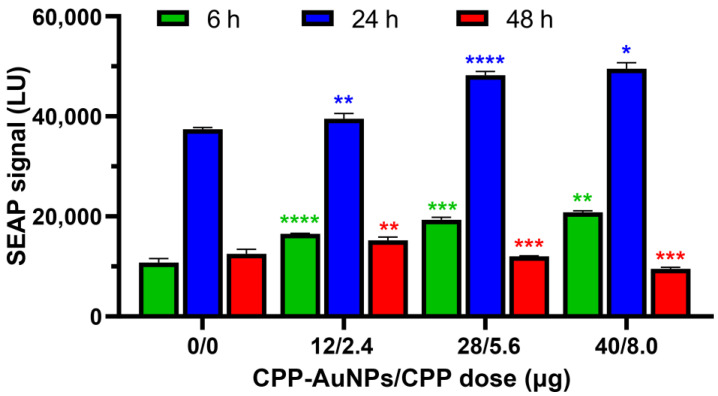
Figure 3.
SEAP levels in the SEAP-ARPE-19 cell supernatants (mean ± SD, n = 5) over different time periods after transfection with CPP-AuNPs in Opti-MEM. For statistical analysis, see Table S1. The statistical significance are denoted by: *—p ≤ 0.05; **—p ≤ 0.01; ***—p ≤ 0.001; ****—p ≤ 0.0001.

