

Abstract
We investigated the influence of parents’ weight status on their children’s growth trajectories and its association with age at onset of overweight and obesity. We used 16,396 height and weight records from 3,284 youths from the Panel Study of Income Dynamics, followed across childhood into adulthood (United States, 1997–2017). Across age groups, we modeled body mass index trajectories (ages 5–32 years) according to parents’ weight status, using mixed-effect models to estimate age at onset of overweight and obesity and proportion with obesity from childhood to adulthood. There were large differences in growth patterns according to parents’ weight status: Children of parents with obesity had, on average, overweight at age 6 (95% confidence interval (CI): 5, 7) and steep growth trajectories until age 12; children of normal-weight parents had slower increases in body mass index, reaching overweight on average at age 25 (95% CI: 24, 27). By age 30, 30% (95% CI: 28, 31) of youths had obesity. Differences in early-life growth persisted into adulthood: 48% (95% CI: 45, 52) of adult children of parents with obesity had obesity versus 16% (95% CI: 14, 19) of those of normal-weight parents. Trajectories to unhealthy weight were heavily influenced by parents’ weight status, especially before age 12, children of parents with obesity having overweight 19 earlier in life than children of normal-weight parents.
Keywords: age at onset, intergenerational health, obesity, overweight, weight status
Abbreviations
- BMI
body mass index
- BMIz
body mass index z score
- CI
confidence interval
- PSID
Panel Study of Income Dynamics
- SD
standard deviation
- WHO
World Health Organization
Obesity is a major health problem in the United States, with >40% of the adult population having a body mass index (BMI) equivalent to obesity (1–3). Risks of obesity can become established in childhood (4–9), and once a youth begins to accumulate unhealthy weight, reversing to normal weight rarely occurs (10–12). These patterns are especially concerning because the age when obesity is first observed and the duration of overweight and obesity during childhood and adolescence are associated with the development of cardiometabolic conditions in adulthood (6, 8, 9, 13, 14). This evidence highlights that knowledge is needed about how to identify the children who are likely to progress to obesity in adulthood and whether there is a specific (age) window of opportunity.
Parents and children share many health characteristics, and weight status is among these (6, 15–23). Parent-child similarities in body weight may originate from genetic predispositions (24, 25), intrauterine exposure (26), shared life conditions, shared environments, and habits and preferences formed during childhood (16, 25, 27). Even among children with normal weight up to age 17 years, those whose parents have obesity have a higher risk of developing obesity in adulthood (6).
The premise of this study is that parents’ weight status is a determinant for their children’s growth trajectories and that children whose parents have obesity may follow different age-specific growth patterns, including likelihood and timing of overweight and obesity, compared with those of parents without obesity. We used data from the Panel Study of Income Dynamics (PSID) (28), a national, longitudinal study with 20 years of data on height and weight in children and their parents. These data provide an unique opportunity to quantify links between parents’ weight status and children’s growth trajectories.
We examined differences between the growth patterns of children of parents with obesity and those whose parents did not have obesity. We modeled growth trajectories from ages 5 to 32 years to assess the relationship of parents’ weight status and the age at onset of overweight and obesity in their children.
METHODS
Study population
We used data from the PSID (28), a prospective, household-based, US national cohort started in 1968. PSID is a dynamic cohort of households, with individuals and households entering the study through birth, marriage, and family formation and exiting through death, divorce, and family dissolution. Data are collected by interviewers over the telephone or at in-home visits. PSID expanded to include data on adult health in 1986 and child development in 1997. Two PSID supplemental studies have collected anthropometric data from children, adolescents, and young adults: Child Development Supplements (CDS) (1997, 2002, 2007, and 2014), and Transition Into Adulthood (TIA) (2005, 2007, 2009, 2011, 2013, 2015, and 2017) (Web Appendix 1 and Web Figure 1, available at https://doi.org/10.1093/aje/kwac124).
CDS and TIA include a total of 8,522 youths. We excluded those with no information on date of birth (n = 5) or height and weight (n = 1,191). We retained records from ages ≥5 years and for those who had their first valid anthropometric data recorded before age 18 years (n = 6,008). We excluded records with implausible BMI z scores (>5 or <−5; records = 118). Because 2 time points were needed to model trajectories, we retained youths with ≥2 records of weight and height (n = 3,325) and excluded those who had no information on any parent’s weight and height (n = 31), or on poverty (n = 10) (Web Figure 2), resulting in an analytical sample of 3,284 youths born between 1983 and 1999, with a total of 16,396 observations during ages 5–32 years (Web Figure 3).
Body mass index in children, adolescents, and young adults
For youths <18 years, height was measured by PSID interviewers or reported by primary caregivers (4%–14% self-reported across waves). Weight was reported by primary caregivers in 1997 and was either reported or measured by PSID interviewers at subsequent waves (0%–22% self-reported) (Web Table 1). Young adults in TIA and adults in PSID self-reported weight and height in all waves. To estimate growth patterns at ages 5–19 years, we calculated BMI for age and sex standard deviation (SD) scores (z score—BMIz) using the World Health Organization (WHO) Growth Reference for School-aged Children 2007 (29). This was used instead of CDC z scores because the latter are based on smoothed percentiles, which entails that high values are trimmed, and to fit the growth patterns we needed the actual z scores. Following standard procedures, we defined overweight as ≥1 SD above the reference population and obesity as ≥2 SD above (30). For adulthood (≥19 years), we defined overweight as a BMI (calculated as weight (kg)/height (m)2) of at least 25 and under 30 and obesity as a BMI of ≥30 (31). For modeling purposes BMIz (z score) and BMI are visualized for all ages, but age of onset and proportion with different weight status are assessed as age-appropriate (BMIz for ages 5–19 years and BMI for ages 19–32 years, using both scales for analyses of persons aged 19 years).
Parents’ weight status
To analyze the association between parents’ weight status and their children’s growth trajectories, we used both parents’ self-reported heights and weights, collected before the child’s birth or as close to birth as possible (median age of child when parent BMI was recorded: 2.8 years (interquartile range = −0.3 to 7.3) to calculate BMI. We defined overweight as a BMI at least 25 and below 30 and obesity as a BMI of ≥30 (31). If parents fell into different weight categories, we used the parent with the highest BMI to define parental weight status. For 830 children, BMI information was available from only 1 parent (785 from mother and 45 from father). Parents’ weight status was coded as: 1 = parents with normal weight, 2 = at least 1 parent with overweight, or 3 = at least 1 parent with obesity.
Covariates
In analytical models, we controlled for characteristics that have been shown to be associated with obesity. In the analytical sample, 51% were White, 41% Black, 4% Hispanic, 2% Asian, and few Native American (1%) and other races (2%). To avoid too-small groups, and given that Whites have lower risk of obesity than other races/ethnicities (32), we classified race/ethnicity as White or non-White. Poverty was based on income in the year the children first had their weight and height recorded and dichotomized according to the poverty threshold from the US Census Bureau (33). We also controlled for year of birth to account for cohort effects, and for sex.
Statistical analyses
We used mixed-effects models to fit mean BMIz and BMI trajectories. This modeling approach neither requires that all individuals have the same number of measurements nor that measures were recorded at the same time points or ages. Quadratic and cubic associations were tested with age, and the final model was selected based on the likelihood-ratio test of deviances for nested models. Cubic age trajectories provided better model fit than quadratic. Random intercept and slope were included in all models at the child level to account for the longitudinal nature of the data set; random intercept was included at the household level, as multiple children had the same parents (64% were siblings, half-siblings, or adopted siblings) (34). We modeled trajectories overall and for each group of children (by parents’ weight status), the latter by using terms for interaction between the child’s age and parents’ weight status. All models adjusted for race, poverty, and year of birth (both linear and quadratic terms to account for the dynamics of the obesity epidemic). Models fitting BMI trajectories also adjusted for sex; BMIz is already sex-specific. Analyses were also stratified by mother’s and father’s weight status.
In sensitivity analyses, we additionally adjusted for age of parents at the birth of the child, age of child when parents’ BMI was recorded, and number of parents contributing BMI information. We also fitted models including data from only those children with more than 4 measurements to investigate how the number of measurements and exclusion of those with only 1 measurement might have influenced our results.
To estimate age of onset of overweight and obesity and proportion with normal weight, overweight, and obesity at different ages, we used point estimates derived from the participants’ modeled BMIz and BMI trajectories constructed as a combination of fixed effects and individual-specific random effects. Overall and for each group of children (those of parents with normal weight, overweight, or obesity), age of onset was defined as the age when the mean trajectory of the group crossed the thresholds into the overweight or obesity category, in case it did cross. Proportion with normal weight, overweight, or obesity was estimated in young childhood (age 5), early adolescence (age 12), mid-adolescence (age 16), end of adolescence/start of adulthood (age 19), young adulthood (age 25), and adulthood (age 30).
We used 1,000 bootstrap samples to calculate confidence intervals (CIs) for the age at onset and the proportions with overweight and obesity. All analyses were performed with R (R Foundation for Statistical Computing, Vienna, Austria), version 3.5.1, using the lme4 package (version 1.1-18-1; https://cran.r-project.org/web/packages/lme4/) and Epi package (version 2.32; https://cran.microsoft.com/snapshot/2022-07-10/web/packages/Epi/index.html).
RESULTS
Across ages 5–32 years, the median number of records per child was 5 (interquartile range = 3–7). Median age at first observation was 9.6 years (interquartile range = 7.5–11.9) and the median duration of follow-up was 14.6 years (interquartile range = 12.5–18.1). Median number of records and age at first record did not vary according to parents’ weight status. Characteristics of the youth at their first record are shown in Web Table 2.
Age at onset of overweight and obesity
Overall, irrespective of parents’ weight status, youths on average had BMI trajectories crossing the threshold for overweight at age 19 (95% CI: 19, 20). Figure 1 shows age at onset of overweight according to parents’ weight status. Children of parents with obesity had on average overweight at age 6 (95% CI: 5, 7); this is 19 years earlier than those of parents with normal weight, who on average had overweight at age 25 (95% CI: 24, 27). For children of parents with overweight, the mean age at onset of overweight was 20 years (95% CI: 19, 20). At age 27 years, those of parents with obesity, on average, had obesity (95% CI: 26, 29), while those of parents with normal weight or overweight did not, on average, have obesity before age 32 years (the end of the observation period).
Figure 1.
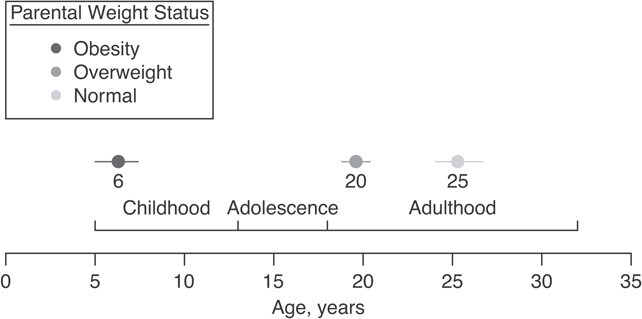
Age at onset of overweight according to parents’ weight status and adjusted for poverty and race/ethnicity, United States, 1997–2017. For example, children of parents with obesity on average were overweight at age 6 years, whereas children of parents with normal weight were on average overweight at age 25 years.
BMI trajectories from early childhood to adulthood
Children of parents with normal weight, overweight, or obesity followed distinct growth trajectories (Figure 2). From childhood through adolescence, those of parents with normal weight had an almost flat BMIz trajectory, indicating that they maintained a steady growth pattern, hovering just above the mean of the growth reference (BMIz = 0) through age 19 years. Children of parents with overweight experienced some increases in BMIz between ages 5–12 years, crossing 0.5 SD above the growth reference mean and plateauing around 0.75 SD thereafter until age 19 years. Children of parents with obesity were already at a higher BMIz at age 5 years, about 0.88 SD above the growth reference mean. They also experienced steep increases in BMIz in childhood (until age 12), and on average they crossed the 1-SD threshold into overweight at age 6 years, continuing to increase, albeit at a slower pace, from ages 12 to 19 years. From ages 5 to 12 years, the difference in mean BMIz between children of parents with normal weight versus obesity increased from 0.58 SD (95% CI: 0.36, 0.80) to 1.01 SD (95% CI: 0.89, 1.13).
Figure 2.

Body mass index (BMI) z score and BMI trajectories according to parents’ weight status, United States, 1997–2017. Shown are the children’s BMI z-score trajectories in childhood and adolescence (ages 5–19 years) (A) and their BMI trajectories in young adulthood (ages 19–32 years) (B). For example, children of parents with obesity (dark gray line) had an increase in BMI z score from childhood (ages 5–12 years) followed by an almost flat trajectory in adolescence (until age 19) (A). In young adulthood (ages 19–32 years), children of parents with obesity increased in BMI with a steeper increase between ages 25 and 32 years (B). For modeling purposes, BMI z score and BMI are visualized for all ages, but only the solid lines are used for interpretations (ages 5–19 years for BMI z score and ages 19–32 years for BMI). Trajectories are adjusted for race, poverty, and year of birth.
In early adulthood, average BMI trajectories were upward for all 3 groups (children of parents with normal weight, overweight, or obesity) (Figure 2B). Children of parents with normal weight entered adulthood with a lower average BMI (23.3, 95% CI: 22.9, 23.6) than the other 2 groups. Those of parents with overweight entered adulthood with a higher BMI (24.9, 95% CI: 24.6, 25.2) and thereafter showed a slope of BMI increase similar to that of people of parents with normal weight. Those of parents with obesity entered adulthood with overweight (BMI = 27.7, 95% CI:27.3, 28.0) and experienced steeper BMI increases thereafter.
At age 30 years, the average BMI was 26.0 (95% CI: 25.4, 26.5) for children of parents with normal weight around the time of their birth, 27.7 (95% CI: 27.2, 28.2) for those of parents with overweight, and 31.3 (95% CI: 31.0, 31.9) for those of parents with obesity (Web Table 3).
From ages 5 to 12, BMIz trajectories were steeper according to mother’s weight status rather than the father’s, especially for children of mothers with obesity. There was a larger separation in BMI trajectories between groups by mother’s than by father’s weight status; however, the overall developmental patterns did not differ greatly from the main results (Figure 3).
Figure 3.

Children’s body mass index (BMI) z score and BMI trajectories according to their mother’s or father’s weight status, United States, 1997–2017. Shown are the children’s BMI z score trajectories, according to mother’s (A) and father’s (B) weight status, in childhood and adolescence (ages 5–19 years) and their BMI trajectories in young adulthood (ages 19–32 years) according to mother’s (C) and father’s (D) weight status. For analytical purposes, BMI z score and BMI were modeled for all ages, but only the solid lines are used for interpretations (ages 5–19 years for BMI z score and ages 19–32 years for BMI). Of the sample, 2,454 children had measures from both their mother (mother with normal weight: 1,523 (62%); mother with overweight: 568 (23%); mother with obesity: 363 (15%)) and father (father with normal weight: 1,037 (42%); father with overweight: 1,037 (42%); father with obesity: 380 (15%)). Trajectories are adjusted for race, poverty, and year of birth.
In sensitivity analysis with additional adjustments for age of parents at the birth of the child, age of child when parents’ BMI was recorded, and number of parents with BMI information, findings were similar to our main results (Web Figure 4). When we restricted analysis to those with more than 4 data records, children of parents with obesity had a slightly lower BMIz in childhood and adolescence than in the main analysis (Web Figure 5).
Proportions of overweight and obesity in children and parents’ weight status
Table 1 shows that, at all ages, the adjusted (race, poverty, and year of birth) proportion with obesity was higher for people whose parents had higher weight status near the time of their birth. In early childhood (age 5 years), the proportion with obesity was almost 3-fold if the parents had obesity versus normal weight (22% vs. 8%). From early childhood to the start of adolescence (age 12 years), the proportion with obesity remained stable among those with parents with normal weight or overweight, while the proportion with obesity increased among children of parents with obesity, from 22% to 31%.
Table 1.
Estimated Proportions of Children With Normal Weight, Overweight, and Obesity According to the Child’s Age and the Weight of Their Parents, United States, 1997–2017a
| Parents’ Weight Status b | ||||||
|---|---|---|---|---|---|---|
| Normal Weight (n = 1,092; 33%) | Overweight (n = 1,325; 40%) | Obesity (n = 867; 26%) | ||||
| Child’s Age and Weight Status | % | 95% CI | % | 95% CI | % | 95% CI |
| Young childhood, 5 yearsc | ||||||
| Normal weight | 75 | 73, 78 | 67 | 65, 70 | 54 | 51, 58 |
| Overweight | 16 | 14, 18 | 22 | 20, 24 | 23 | 21, 26 |
| Obesity | 8 | 7, 10 | 11 | 10, 13 | 22 | 20, 25 |
| Early adolescence, 12 yearsc | ||||||
| Normal weight | 77 | 75, 80 | 62 | 59, 64 | 40 | 37, 43 |
| Overweight | 17 | 15, 19 | 26 | 23, 28 | 30 | 27, 33 |
| Obesity | 5 | 4, 7 | 13 | 11, 14 | 31 | 28, 34 |
| Mid-adolescence, 16 yearsc | ||||||
| Normal weight | 78 | 75, 80 | 62 | 60, 65 | 38 | 34, 41 |
| Overweight | 17 | 15, 19 | 26 | 23, 28 | 32 | 29, 35 |
| Obesity | 5 | 4, 6 | 12 | 11, 14 | 30 | 27, 33 |
| End adolescence, 19 yearsc | ||||||
| Normal weight | 76 | 74, 79 | 61 | 58, 63 | 38 | 34, 41 |
| Overweight | 18 | 16, 21 | 26 | 24, 28 | 33 | 29, 36 |
| Obesity | 5 | 4, 7 | 13 | 11, 15 | 30 | 26, 33 |
| Start of adulthood, 19 yearsb | ||||||
| Normal-weight | 78 | 75, 80 | 62 | 60, 65 | 38 | 34, 41 |
| Overweight | 18 | 16, 20 | 26 | 24, 28 | 34 | 31, 37 |
| Obesity | 4 | 3, 6 | 12 | 10, 14 | 28 | 25, 31 |
| Young adulthood, 25 yearsb | ||||||
| Normal weight | 62 | 59, 65 | 46 | 43, 48 | 27 | 24, 30 |
| Overweight | 26 | 24, 29 | 33 | 31, 36 | 33 | 30, 37 |
| Obesity | 12 | 10, 13 | 21 | 19, 23 | 40 | 37, 44 |
| Adulthood, 30 yearsb | ||||||
| Normal weight | 52 | 49, 55 | 39 | 36, 42 | 20 | 17, 23 |
| Overweight | 31 | 29, 34 | 33 | 30, 35 | 32 | 29, 35 |
| Obesity | 16 | 14, 19 | 28 | 26, 31 | 48 | 45, 52 |
Abbreviations: BMI, body mass index; CI, confidence interval; WHO, World Health Organization.
a Proportion estimates (95% CIs) are based on models adjusted for year of birth, sex, race, and poverty. Proportions are rounded and may not sum to 100%.
b Parents’ and children’s adult weight status were defined using the WHO’s BMI (calculated as weight (kg/height (m)2) cutoff for adults (normal weight: <25; overweight: ≥25 and <30; obesity: ≥30).
c Childhood and adolescence weight status was defined with the use of WHO cutoffs for the age- and sex-specific z score (overweight: ≥1 SD, obesity: ≥2 SD).
During adolescence, the proportion with obesity did not increase in any of the 3 groups.
In young adulthood (from ages 19 to 30) the proportion with obesity increased, regardless of the weight status of the parents, but more in those of parents with higher weight status: 12 percentage points for those of parents with normal weight, 16 percentage points for those of parents with overweight, and 20 percentage points for those of parents with obesity. At age 30 years, 48% of the children of parents with obesity now also had obesity, as had 28% of those of parents with overweight and 16% of those of parents with normal weight. Overall, 32% (95% CI: 29, 35) had overweight and 30% (95% CI: 28, 31) had obesity at age 30 years.
DISCUSSION
In the period 1997–2017, youths in the United States had on average overweight at their 19th birthday. The growth trajectories they had followed differed with their parents’ weight status: The children of parents who had obesity around the time of their birth experienced steep increases in BMIz in childhood (ages 5–12) and already had, on average, overweight at age 6 years—19 years earlier than people of parent with normal weight. These differences in age of onset entail large differences in the duration of exposure to excess weight. By age 32 years, children of parents with obesity had experienced excess weight most of their childhood, adolescence, and young adulthood, whereas those of parents with normal weight had been exposed only in adulthood.
Previous studies have reported similarities between the weight status of parents and children cross-sectionally at specific ages (15–17, 23), during short follow-up periods (6, 20–22), or by comparing parents’ BMI for children with different BMI trajectories (18, 19). Our prospective study design combined measures from 10 data waves over 20 years for children from ages 5 to 32 years, covering a larger age span and longer follow-up period than previous studies. Using this approach, we found that parents’ weight status influenced their children’s weight status at all ages but that the differences in proportion with obesity between children of parents with normal weight, overweight, or obesity originated primarily in different BMIz trajectories in childhood (before age 12), which led to large differences in age at onset of overweight. The latter is consistent with a previous study that reported an onset of obesity up to 8 years earlier in children of mothers with obesity compared with those of mothers without obesity, although age at onset was not reported (35). Both age at onset and duration of exposure to excess weight are linked to higher risk and earlier onset of type 2 diabetes and other cardiometabolic conditions (9, 13, 14, 36). In our study, we showed that the children of parents with obesity experienced excess weight much earlier in life (from age 6 years) and for much longer duration (at age 32, 21 years with overweight and 5 years with obesity) compared with those of parents with normal weight, who on average had overweight at age 25 years, and who had been exposed to overweight for 7 years by age 32.
The largest increases in BMI z scores were during ages 5–12 years and were most pronounced among children of parents with obesity. Other studies have also shown that the highest increases in BMI z score occur in early childhood (21) and that annual incidence of obesity is higher earlier in childhood than later (37). These studies also showed that children with overweight have higher increases in BMI and incidence of obesity than children with normal weight, implying that there may be heterogeneity in the risk of obesity, where children with normal weight are less vulnerable to experiencing increases in weight than children with overweight. Our results suggest that such heterogeneity in weight status in children found in other studies may have its origins with the parents. However, our results also showed that even among children of parents with normal weight, the proportion with normal weight decreased from 78% at the end of adolescence to 52% by age 30 years. This suggests that youths with normal weight are not immune to weight gain in adulthood, although their parents had normal weight around the time of their birth.
At age 30, even among children of parents with normal weight, only half still had normal weight themselves. Overall, 30% had obesity at age 30, compared with 17% among their parents. Assuming that the risks of early onset associated with parents’ weight status that we reported above hold true in the next generation, we can expect that at least 49% of children born to the current generation of adults will have obesity before the age of 30 years.
A major strength of this study is the utilization of 20 years of data to track growth trajectories across childhood into adulthood in a US national cohort. Other studies estimated weight status before a specific age (13, 35, 36) or used retrospective parent reports of children’s weight at younger ages (27), whereas our study design allowed us to, prospectively from age 5 years, estimate age at onset of both obesity and overweight and compare the proportion with normal weight, overweight, and obesity at any age. Further, age-specific measures for youths (BMIz) and adults (BMI) showed similar results at age 19 years, suggesting that our approach is valid for analyses spanning from childhood through adolescence to early adulthood.
This study cannot discern the causal mechanisms behind the relationship between parents’ weight status and their children’s growth trajectories and age of onset of overweight and obesity. In this study, by age 30, only 16% of the children of parents with obesity were still normal weight, while only 20% of those of parents with normal weight had obesity. Consistent with previous studies (24, 25), this pattern suggests that shared genes play a role. We also found that the differences between the children’s growth trajectories according to their parents’ weight status emerged primarily from different BMIz trajectories during ages 5–12 years. This is a life stage with large changes in body proportions and also a period where children may be heavily influenced by their parents’ life conditions and habits. The latter is in line with studies emphasizing shared environment as a contributor to parent-child similarities in weight status (16, 25, 27).
Our study has limitations. First, we used a measurement of parents’ BMI at only 1 point in time. Thus, we cannot discern changes over time in parents’ weight status and the implication of these for their children’s growth. Second, children of parents with obesity were older than children of parents with normal weight when their parents’ BMIs were first recorded (5.3 vs. 2.1 years old), which could have led to misclassification of parental weight category given an increasing life-course BMI trajectory. However, we found no association between age of the child when parent’s weight was reported and the child’s first BMIz record; thus, any bias in our results might be toward the null, which we also found in the sensitivity analyses controlling for age of child at parents’ BMI record. Third, 25% of our sample had a BMI record from only 1 parent. This might have led to a misclassification of children to a lower exposure category, which can lead to biased estimates if associated with the outcome as well. However, comparing those who had information from 1 parent with those who had information from both parents showed no difference in the first BMIz record within each parental weight category, so if there is any bias, it is likely to be towards the null. Further, analyses stratified by father’s and mother’s weight status showed patterns similar to those in our main analysis. Fourth, adult BMI records relied on self-reported weight and height, which tend to overestimate height and underestimate weight more pronouncedly in those with higher BMI (38). Therefore, the number of parents with overweight or obesity might have been underestimated, and children might have been misclassified to a lower parental weight category. Children whose parents had a BMI of ≥24 and <25 had a higher BMIz (+0.27 SD) than those whose parents had a BMI <24. Children whose parents had a BMI of >29 and <30 had similar BMIz to children of parents with BMIs of <29. Thus, we may have underestimated the differences between children of parents with normal weight and those of parents with obesity. Last, we had to exclude youths with only 1 record of height and weight, as ≥2 records are needed to model trajectories. Compared to youths with ≥2 records, a higher percentage of those with only 1 record had parents with obesity, and a lower percentage had parents with normal weight. Further, those with one only 1 record had a slightly higher baseline BMIz (0.68 SD vs. 0.58 SD). These differences may also have biased our results towards the null and underestimated the difference in age of onset of overweight in those of parents with obesity or normal weight.
In conclusion, youths in the United States were on average overweight at their 19th birthday, but age of onset differed with parents’ weight status. Children of parents with obesity had, on average, overweight at age 6 years. This is 19 years earlier than children of parents with normal weight. Most of the differences in weight between children of parents with normal weight, overweight, or obesity were established by growth trajectories during the first 12 years of life. Since 30% of the youths had obesity at age 30, including 16% of those with parents with normal weight, a higher proportion of the next generation will be exposed to parents with obesity and therefore at risk of developing obesity in childhood.
Supplementary Material
ACKNOWLEDGMENTS
Author affiliations: Hubert Department of Global Health, Rollins School of Public Health, Emory University, Atlanta, Georgia, United States (Jannie Nielsen, K. M. Venkat Narayan, Solveig A. Cunningham); Global Health Section, Department of Public Health, University of Copenhagen, Copenhagen, Denmark (Jannie Nielsen); Steno Diabetes Center Aarhus, Aarhus University Hospital, Aarhus, Denmark (Adam Hulman); and Emory Global Diabetes Research Center, Emory University, Atlanta, Georgia, United States (K. M. Venkat Narayan).
This work was supported by the Independent Research Fund Denmark (DFF—7025-00053) and US National Institute of Diabetes and Digestive and Kidney Diseases (grant 1R01DK115937). The collection of data used in this study was partly supported by the National Institutes of Health (grants R01 HD069609 and R01 AG040213) and the National Science Foundation (awards SES 1157698 and 1623684).
Data were accessed via the Panel Study of Income Dynamics (PSID) website. PSID data are freely available for all registered users at the PSID website (https://psidonline.isr.umich.edu).
Parts of these data were presented at the 78th Scientific Session of the American Diabetes Association, June 22–26, 2018, Orlando, Florida (abstract 1674-P).
The views expressed in this article are those of the authors and do not reflect those of any of the foundations supporting the work.
A.H. is employed by Steno Diabetes Center Aarhus, which has received an unrestricted donation from the Novo Nordisk Foundation. The other authors report no conflicts.
REFERENCES
- 1. Flegal KM, Kruszon-Moran D, Carroll MD, et al. Trends in obesity among adults in the United States, 2005 to 2014. JAMA. 2016;315(21):2284–2291. [DOI] [PMC free article] [PubMed] [Google Scholar]
- 2. Ogden CL, Carroll MD, Lawman HG, et al. Trends in obesity prevalence among children and adolescents in the United States, 1988–1994 through 2013–2014. JAMA. 2016;315(21):2292–2299. [DOI] [PMC free article] [PubMed] [Google Scholar]
- 3. National Center for Health Statistics . Prevalence of Obesity and Severe Obesity Among Adults: United States, 2017–2018. Hyattsville, MD: National Center for Health Statistics; 2020. (NCHS Data Brief. Vol. no 360). https://www.cdc.gov/nchs/products/databriefs/db360.htm. Accessed June 15, 2020. [Google Scholar]
- 4. Buscot MJ, Thomson RJ, Juonala M, et al. BMI trajectories associated with resolution of elevated youth BMI and incident adult obesity. Pediatrics. 2018;141(1):e20172003. [DOI] [PubMed] [Google Scholar]
- 5. Freedman DS, Khan LK, Serdula MK, et al. The relation of childhood BMI to adult adiposity: the Bogalusa Heart Study. Pediatrics. 2005;115(1):22–27. [DOI] [PubMed] [Google Scholar]
- 6. Whitaker RC, Wright JA, Pepe MS, et al. Predicting obesity in young adulthood from childhood and parental obesity. N Engl J Med. 1997;337(13):869–873. [DOI] [PubMed] [Google Scholar]
- 7. Guo SS, Wu W, Chumlea WC, et al. Predicting overweight and obesity in adulthood from body mass index values in childhood and adolescence. Am J Clin Nutr. 2002;76(3):653–658. [DOI] [PubMed] [Google Scholar]
- 8. Zimmermann E, Bjerregaard LG, Gamborg M, et al. Childhood body mass index and development of type 2 diabetes throughout adult life—a large-scale Danish cohort study. Obesity (Silver Spring, Md). 2017;25(5):965–971. [DOI] [PubMed] [Google Scholar]
- 9. Juonala M, Magnussen CG, Berenson GS, et al. Childhood adiposity, adult adiposity, and cardiovascular risk factors. N Engl J Med. 2011;365(20):1876–1885. [DOI] [PubMed] [Google Scholar]
- 10. Cunningham SA, Datar A, Narayan KMV, et al. Entrenched obesity in childhood: findings from a national cohort study. Ann Epidemiol. 2017;27(7):435–441. [DOI] [PMC free article] [PubMed] [Google Scholar]
- 11. Gordon-Larsen P, Adair LS, Nelson MC, et al. Five-year obesity incidence in the transition period between adolescence and adulthood: the National Longitudinal Study of Adolescent Health. Am J Clin Nutr. 2004;80(3):569–575. [DOI] [PubMed] [Google Scholar]
- 12. Gordon-Larsen P, The NS, Adair LS. Longitudinal trends in obesity in the United States from adolescence to the third decade of life. Obesity (Silver Spring, Md). 2010;18(9):1801–1804. [DOI] [PMC free article] [PubMed] [Google Scholar]
- 13. Power C, Thomas C. Changes in BMI, duration of overweight and obesity, and glucose metabolism: 45 years of follow-up of a birth cohort. Diabetes Care. 2011;34(9):1986–1991. [DOI] [PMC free article] [PubMed] [Google Scholar]
- 14. Bjerregaard LG, Jensen BW, Ängquist L, et al. Change in overweight from childhood to early adulthood and risk of type 2 diabetes. N Engl J Med. 2018;378(14):1302–1312. [DOI] [PubMed] [Google Scholar]
- 15. Halvorsen T, Moran A, Jacobs DR Jr, et al. Relation of cardiometabolic risk factors between parents and children. J Pediatr. 2015;167(5):1049–1056.e2. [DOI] [PMC free article] [PubMed] [Google Scholar]
- 16. Burke V, Beilin LJ, Dunbar D. Family lifestyle and parental body mass index as predictors of body mass index in Australian children: a longitudinal study. Int J Obes Relat Metab Disord. 2001;25(2):147–157. [DOI] [PubMed] [Google Scholar]
- 17. Liu Y, Chen HJ, Liang L, et al. Parent-child resemblance in weight status and its correlates in the United States. PloS One. 2013;8(6):e65361. [DOI] [PMC free article] [PubMed] [Google Scholar]
- 18. Pryor LE, Tremblay RE, Boivin M, et al. Developmental trajectories of body mass index in early childhood and their risk factors: an 8-year longitudinal study. Arch Pediatr Adolesc Med. 2011;165(10):906–912. [DOI] [PubMed] [Google Scholar]
- 19. Fan HY, Lee YL, Yang SH, et al. Comprehensive determinants of growth trajectories and body composition in school children: a longitudinal cohort study. Obes Res Clin Pract. 2018;12(3):270–276. [DOI] [PubMed] [Google Scholar]
- 20. Ajslev TA, Angquist L, Silventoinen K, et al. Stable intergenerational associations of childhood overweight during the development of the obesity epidemic. Obesity (Silver Spring). 2015;23(6):1279–1287. [DOI] [PubMed] [Google Scholar]
- 21. Geserick M, Vogel M, Gausche R, et al. Acceleration of BMI in early childhood and risk of sustained obesity. N Engl J Med. 2018;379(14):1303–1312. [DOI] [PubMed] [Google Scholar]
- 22. Francis LA, Ventura AK, Marini M, et al. Parent overweight predicts daughters' increase in BMI and disinhibited overeating from 5 to 13 years. Obesity (Silver Spring, Md). 2007;15(6):1544–1553. [DOI] [PMC free article] [PubMed] [Google Scholar]
- 23. Davis MM, McGonagle K, Schoeni RF, et al. Grandparental and parental obesity influences on childhood overweight: implications for primary care practice. J Am Board Fam Med. 2008;21(6):549–554. [DOI] [PubMed] [Google Scholar]
- 24. Stunkard AJ, Harris JR, Pedersen NL, et al. The body-mass index of twins who have been reared apart. N Engl J Med. 1990;322(21):1483–1487. [DOI] [PubMed] [Google Scholar]
- 25. Moll PP, Burns TL, Lauer RM. The genetic and environmental sources of body mass index variability: the Muscatine Ponderosity Family Study. Am J Hum Genet. 1991;49(6):1243–1255. [PMC free article] [PubMed] [Google Scholar]
- 26. Pettitt DJ, Baird HR, Aleck KA, et al. Excessive obesity in offspring of Pima Indian women with diabetes during pregnancy. N Engl J Med. 1983;308(5):242–245. [DOI] [PubMed] [Google Scholar]
- 27. Franzese A, Valerio G, Argenziano A, et al. Onset of obesity in children through the recall of parents: relationship to parental obesity and life events. J Pediatr Endocrinol Metab. 1998;11(1):63–67. [DOI] [PubMed] [Google Scholar]
- 28. Panel Study of Income Dynamics . Public use dataset 1999–2017. Ann Arbor, MI: Survey Research Center, Institute for Social Research; https://psidonline.isr.umich.edu/. Accessed July 26, 2022. [Google Scholar]
- 29. de Onis M, Onyango AW, Borghi E, et al. Development of a WHO growth reference for school-aged children and adolescents. Bull World Health Organ. 2007;85(9):660–667. [DOI] [PMC free article] [PubMed] [Google Scholar]
- 30. de Onis M, Lobstein T. Defining obesity risk status in the general childhood population: which cut-offs should we use? Int J Pediatr Obes. 2010;5(6):458–460. [DOI] [PubMed] [Google Scholar]
- 31. WHO Consultation on Obesity and World Health Organization . Obesity: Preventing and Managing the Global Epidemic: Report of a WHO Consultation.Geneva, Switzerland: World Health Organization; 1999–2000. https://apps.who.int/iris/handle/10665/42330. Accessed June 15, 2021. [PubMed] [Google Scholar]
- 32. Gaskin DJ, Thorpe RJ Jr, McGinty EE, et al. Disparities in diabetes: the nexus of race, poverty, and place. Am J Public Health. 2014;104(11):2147–2155. [DOI] [PMC free article] [PubMed] [Google Scholar]
- 33. US Census Bureau . Poverty Thresholds by Size of Family and Number of Children. Suitland, MD: US Census Bureau; 2018. https://www.census.gov/data/tables/time-series/demo/income-poverty/historical-poverty-thresholds.html. Accessed February 14, 2020. [Google Scholar]
- 34. Singer JD, Willett JB. Applied Longitudinal Data Analysis: Modeling Change and Event Occurrence. Oxford, UK: Oxford University Press; 2003. [Google Scholar]
- 35. Gordon-Larsen P, Adair LS, Suchindran CM. Maternal obesity is associated with younger age at obesity onset in U.S. adolescent offspring followed into adulthood. Obesity (Silver Spring, Md). 2007;15(11):2790–2796. [DOI] [PubMed] [Google Scholar]
- 36. The NS, Richardson AS, Gordon-Larsen P. Timing and duration of obesity in relation to diabetes: findings from an ethnically diverse, nationally representative sample. Diabetes Care. 2013;36(4):865–872. [DOI] [PMC free article] [PubMed] [Google Scholar]
- 37. Cunningham SA, Kramer MR, Narayan KM. Incidence of childhood obesity in the United States. N Engl J Med. 2014;370(5):403–411. [DOI] [PMC free article] [PubMed] [Google Scholar]
- 38. Connor Gorber S, Tremblay M, Moher D, et al. A comparison of direct vs. self-report measures for assessing height, weight and body mass index: a systematic review. Obes Rev. 2007;8(4):307–326. [DOI] [PubMed] [Google Scholar]
Associated Data
This section collects any data citations, data availability statements, or supplementary materials included in this article.