Abstract
In vivo 13C nuclear magnetic resonance spectroscopy was used to elucidate the pathways and the regulation of pyruvate metabolism and pyruvate-lactate cometabolism noninvasively in living-cell suspensions of Propionibacterium freudenreichii subsp. shermanii. The most important result of this work concerns the modification of fluxes of pyruvate metabolism induced by the presence of lactate. Pyruvate was temporarily converted to lactate and alanine; the flux to acetate synthesis was maintained, but the flux to propionate synthesis was increased; and the reverse flux of the first part of the Wood-Werkman cycle, up to acetate synthesis, was decreased. Pyruvate was consumed at apparent initial rates of 148 and 90 μmol · min−1 · g−1 (cell dry weight) when it was the sole substrate or cometabolized with lactate, respectively. Lactate was consumed at an apparent initial rate of 157 μmol · min−1 · g−1 when it was cometabolized with pyruvate. P. shermanii used several pathways, namely, the Wood-Werkman cycle, synthesis of acetate and CO2, succinate synthesis, gluconeogenesis, the tricarboxylic acid cycle, and alanine synthesis, to manage its pyruvate pool sharply. In both types of experiments, acetate synthesis and the Wood-Werkman cycle were the metabolic pathways used most.
Propionic acid bacteria, especially Propionibacterium freudenreichii subsp. shermanii, is the main ripening flora of Swiss-type cheeses. Two interesting features of propionibacterial metabolism are the central carbon metabolic pathway of the Wood-Werkman cycle, part of the central carbon metabolic pathway, and the presence of a multimeric transcarboxylase (EC 2.1.3.1). This transcarboxylase catalyzes the reversible transfer of a carboxyl group from methylmalonyl coenzyme A (CoA) to pyruvate to form propionyl-CoA and oxaloacetate. The carboxyl group transferred is never released nor exchanged with the CO2 dissolved in the medium (20).
During the warm-room period (the last stage of the cheese-making process), the growth of propionibacteria occurred, the concentration of lactate changed from 150 to 50 mmol/kg of cheese, and that of pyruvate increased from about 1 to 10 mmol/kg of cheese (6, 16).
The fermentation of lactate to propionate, acetate, and CO2 is usually represented as follows: 3 lactate → 2 propionate + 1 acetate + 1 CO2 + 1 H2O. In the fermentation of pyruvate, the acids produced are qualitatively the same but quantitatively the reverse (11). Moreover, production of significant amounts of other products, like succinate, has also been reported (15). The propionate-to-acetate ratios are then often different from the theoretical values of 2 (lactate fermentation) and 0.5 (pyruvate fermentation). The reason for such discrepancies from the theoretical values is still unknown.
Since propionibacteria are involved in lactate breakdown in cheese and are known to be able, in complex media or in resting cells, to ferment pyruvate (1, 9, 10, 11, 15) and to excrete pyruvate (4, 5, 19) during lactate fermentation, it would be interesting to know how propionibacteria manage the fermentation of both substrates when they are available together.
In a previous work, it was shown that aspartate and alanine are intermediates or products of pyruvate metabolism in Propionibacterium spp. (9). We conducted this study with a larger initial concentration of pyruvate in order to determine if pyruvate is the key to the control of central carbon metabolism in P. shermanii and how the cells regulate the influxes and outfluxes at this node. Cometabolism experiments were conducted in order to observe how the cells regulate the flux of pyruvate in the presence of the most-used and preferred substrate in Swiss-type cheese, namely, lactate.
MATERIALS AND METHODS
Culture conditions.
P. freudenreichii subsp. shermanii (CIP 103027) was grown on a modified yeast extract-lactate medium (9).
Cell suspension preparation.
For in vivo nuclear magnetic resonance (NMR) experiments, cells were prepared as described by Deborde et al. (8). One gram (wet weight) of cell pellet was resuspended in 2 ml of sterile water (9 g · liter−1) and immediately transferred to an NMR tube. Argon was bubbled through the suspension to maintain anaerobiosis.
NMR experiments.
All NMR experiments were performed by using an Avance DMX500 spectrometer system (Bruker, Wissembourg, France) operating at 11.75 T (125.7 MHz for 13C and 500.1 MHz for 1H).
(i) In vivo natural-abundance 13C NMR spectra.
Natural-abundance 13C NMR spectra were determined at 297 K on an NMR spectrometer with a 10-mm probe. A cell suspension (3 ml) was transferred to an NMR tube containing a capillary full of HMPA (hexamethylphosphoramide; Sigma) in H2O. Chemical shifts were measured relative to the HMPA capillary centered in the NMR tube as an external reference resonating at 36.8 ppm from tetramethylsilane (Spectrométrie Spin et Techniques). The capillary was present throughout the recording of spectra. 13C natural-abundance spectra were recorded as previously described (8). For experiments with [2-13C(99%)]pyruvic acid sodium salt, FID (free induction decay) was acquired with the same acquisition parameters but with 64 or 512 scans. Peak areas were determined by using the interactive integration package of XWINNMR spectrometer software (Bruker).
Addition of FID was performed with a command provided by XWINNMR software, namely, addfid; this function generated a new set of raw data, i.e., a new FID. Since the signal-to-noise ratio is a function of the square root of the number of scans, this function enhances this ratio but subsequent to acquisition.
(ii) Quantification of end products by 1H and 13C NMR analyses of supernatants.
Following the NMR experiments with labeled-substrate addition, the cell suspension was diluted with 3 ml of sterile water and immediately centrifuged (9,000 × g, 10 min, ambient temperature, Heraeus Biofuge 15). The supernatant was collected, and the cell pellet was resuspended with 6 ml of sterile water and centrifuged again. The two supernatants were pooled and then filtered through a sterile disposable 0.45-μm syringe filter and kept like the cell pellet at −20°C until analyzed. Analysis of supernatants was performed at 298 K on an NMR spectrometer with a 5-mm probe. The sample supernatant (400 μl) was supplemented with 50 μl of tetradeuterio-2,2,3,3-(trimethylsilyl)-3-propionic acid sodium salt (TSP; Spectrométrie Spin et Techniques) in D2O and 50 μl of glycine (internal standard; 20 mM final concentration). 1H spectra were recorded with the following parameters: 9-s repetition time, 6-s relaxation delay, 90° pulse angle, 7-kHz spectral width, 2-s presaturation time of the water signal, and 512 scans. For each sample, two 1H NMR spectra were run, one without (1H NMR) and a second with broadband 13C decoupling using the GARP (18a) composite pulse decoupling scheme (1H{13C} NMR). A 0.3-Hz broadening factor was applied to the FID signal before Fourier transformation. Peak areas were determined by interactive integration by using the spectrometer software.
13C{1H} NMR natural-abundance spectra were recorded by using the WALTZ (18b) decoupling sequence with the following parameters: 2-s repetition time, 90° pulse angle, 32-kHz spectral width, and 2,048 scans. A 3-Hz broadening factor was applied to the FID signal before Fourier transformation.
Miscellaneous.
Total cell mass was determined by A650 measurements (Beckman DU 7400) correlated with the wet-cell concentration. One A650 unit was equivalent to 0.28 (dry weight) or 2.5 (wet weight) mg (r2 = 0.99).
Chemicals.
[2-13C]sodium pyruvate (99% 13C) was purchased from Isotec, and sodium l-[1-13C]lactate (99% 13C) was purchased from Cambridge Isotope Laboratories, A.R.C. All of the other chemicals used were of reagent grade.
RESULTS
Metabolic pathway of [2-13C]pyruvate by P. freudenreichii subsp. shermanii.
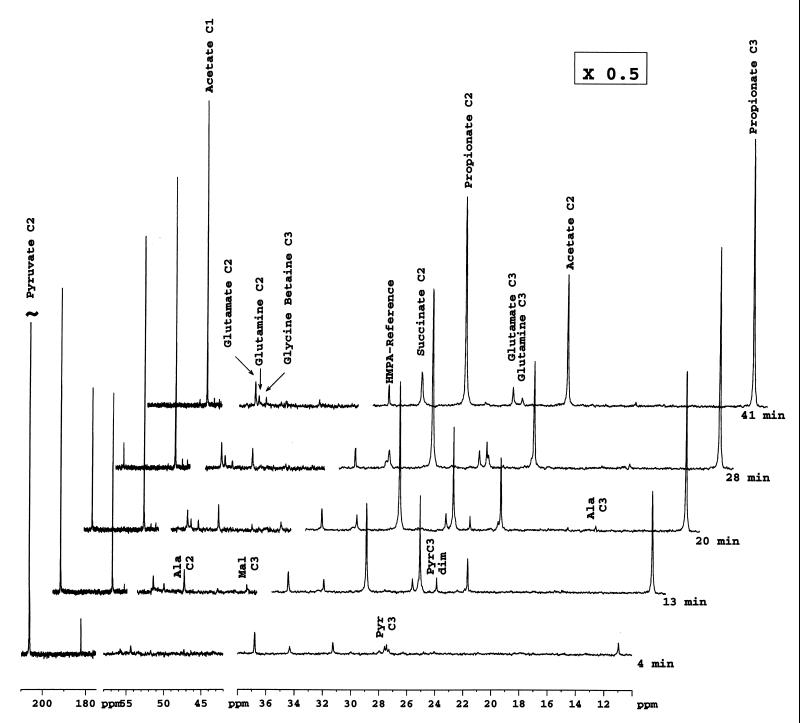
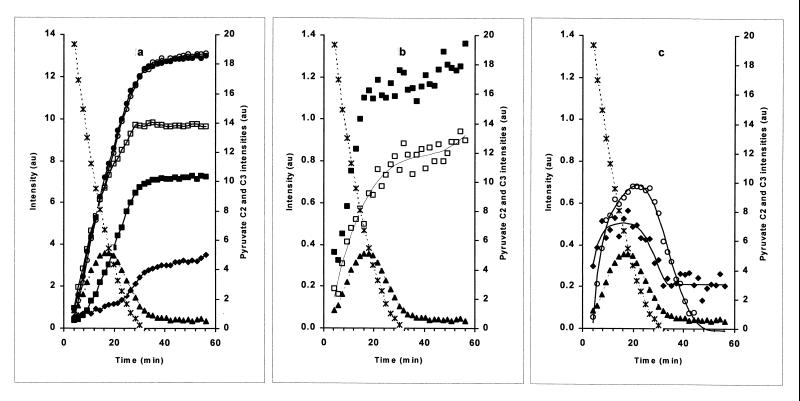
A series of 13C NMR spectra obtained after feeding of Na [2-13C]pyruvate (360 μmol, corresponding to a final concentration of 124 mM in the NMR tube) to a suspension of P. shermanii at 24°C are shown in Fig. 1. Pyruvate (resonance at 206 ppm) was consumed at an apparent initial rate of 148 μmol · min−1 · g−1 (cell dry weight). In the first spectrum after addition, resonances due to pyruvate and its hydrate (95 ppm; not shown), acetate, propionate, and succinate are already clearly observed. The intensities of resonances due to carbons 2 and 3 of the alanine molecule (C-2 and C-3 in the following text), malate (C-2, 71.2 ppm [not shown]; C3, 43.3 ppm), and pyruvate (C-3) and its dimer increased with time, reached a maximum, and decreased at the onset of exhaustion of the added pyruvate, while the intensities of resonances due to propionate, acetate, succinate, glutamate, and glutamine continued to increase (Fig. 1 and 2a, b, and c).
FIG. 1.
Spectra of in situ kinetics of [2-13C]pyruvate metabolism by resting cells of P. freudenreichii subsp. shermanii CIP 103027. [2-13C]pyruvate (360 μmol, corresponding to a final concentration of 124 mM in the NMR tube) was added at time zero to a cell suspension (1 g [wet weight] in 2 ml of sterile saline water) at 24°C (297 K), and proton-decoupled 13C NMR spectra were collected every 104 s (64 scans). Chemical shifts were referred to an HMPA capillary. Only five spectra, selected from 33 experiments, are presented. The intensities of the stackplot on the right were multiplied by 0.5.
FIG. 2.
Time courses of the various metabolites observed by in vivo 13C NMR spectroscopy during [2-13C]pyruvate metabolism by P. freudenreichii subsp. shermanii cells. (a) Symbols: ✠, pyruvate C-2; □, acetate C-1; ■, acetate C-2; ○, propionate C-3; ●, propionate C-2; ⧫, succinate C-2; ▴, pyruvate C-3. (b) Symbols: ✠, pyruvate C-2; ▴, pyruvate C-3; ■, glutamate C-3; □, glutamate C-2. (c) Symbols: ✠, pyruvate C-2; ▴, pyruvate C-3; ○, alanine C-2; ⧫, malate C-3. au, arbitrary units.
[3-13C]pyruvate and [2,3-13C]pyruvate (J = 36 Hz) were detected as early as 4 min. The [2,3-13C]pyruvate came from the original substrate and was due to the natural abundance of 13C at position 3 of pyruvate (1.1%).
The time courses of the peak intensities of [2-13C]- and [3-13C]glutamate were similar, but the intensity of the former was lower (Fig. 2b). The intensity of the glutamate C-4 peak did not change during the experiment (data not shown). No aspartate could be detected either on spectra acquired with 64 scans or on spectrum resulting from FID addition (not shown).
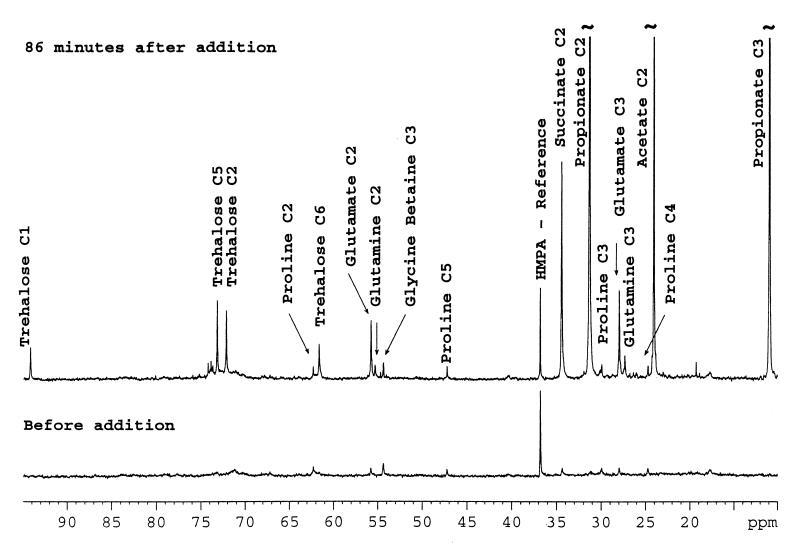
Synthesis of trehalose monolabeled at C-1 (94.1 ppm), C-5 (73.1 ppm), C-2 (72.0 ppm), and C-6 (61.5 ppm) and glutamine monolabeled at C-2 and C-3 was evident after the addition of pyruvate in a spectrum recorded with 512 accumulations (Fig. 3). The peak intensities of glycine betaine and proline remained the same throughout the experiment.
FIG. 3.
Expanded spectra of the 95- to 10-ppm region of the series of spectra shown in Fig. 1 but before and 86 min after addition of [2-13C]pyruvate to resting cells of P. shermanii. Each spectrum was collected with 512 scans.
Pyruvate-lactate cometabolism in P. shermanii.
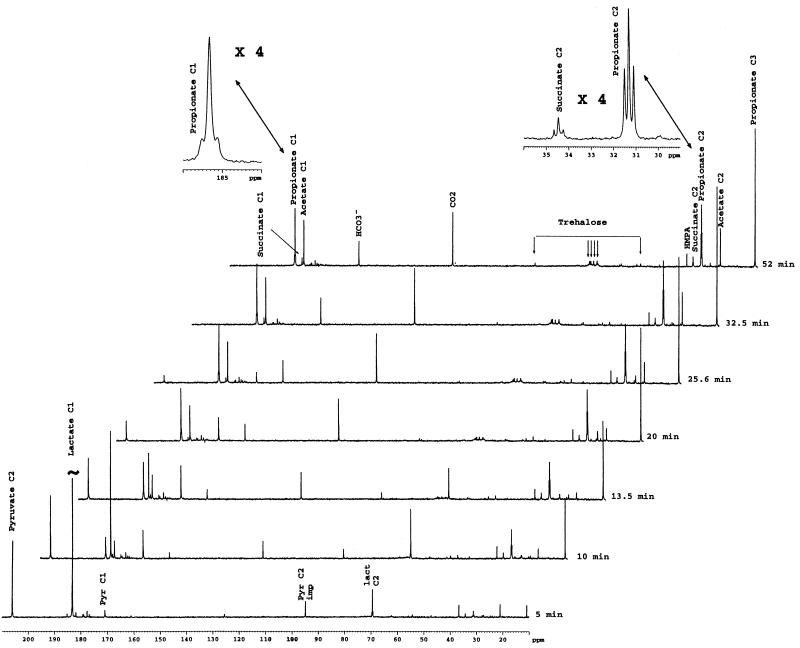
The metabolism of Na [2-13C]pyruvate (194 μmol, corresponding to a final concentration of 67 mM in the NMR tube) and Na l-[1-13C]lactate (270 μmol, corresponding to a final concentration of 95 mM in the NMR tube) by a suspension of P. shermanii was investigated by in vivo 13C NMR at 24°C (Fig. 4). Five minutes after addition, four major resonances were observed: the strong one at 183 ppm was due to [1-13C]lactate, the second at 206 ppm was due to [2-13C]pyruvate, the third at 95 ppm was due to its hydrate, and finally and more interestingly, the fourth at 69.5 ppm was due to [2-13C]lactate. The latter signal was composed of a singlet (the biggest peak in this pattern) and a doublet around this singlet. Since the isotopic purity of [1-13C]lactate was checked by NMR, the doublet was due to naturally abundant l-[1,2-13C (99%, 1.1%)]lactate; no singlet was detected (not shown). From this, the singlet due to [2-13C]lactate might be biosynthesized during the first 5 min after the addition. This hypothesis was confirmed by the fact that only the singlet of the lactate C-2 resonance increased for the next 10 min while the doublet disappeared.
FIG. 4.
Spectra of in-situ kinetics of [2-13C]pyruvate and [1-13C]lactate cometabolism by resting cells of P. freudenreichii subsp. shermanii CIP 103027. Na [2-13C]pyruvate (194 μmol, corresponding to a final concentration of 67 mM in the NMR tube) and Na l-[1-13C]lactate (270 μmol, corresponding to a final concentration of 95 mM in the NMR tube) were added at time zero to a cell suspension (1 g [wet weight] in 2 ml of sterile saline water) at 24°C (297 K), and proton-decoupled 13C NMR spectra were collected every 104 s (64 scans). Chemical shifts were referred to an HMPA capillary. Only eight spectra, selected from 40 experiments, are presented. Abbreviations: Pyr C1, pyruvate C-1; Pyr C2 imp, C-2 of pyruvate hydrate; lact C2; lactate C-2. HMPA, hexamethylphosphoramide.
The first weaker peaks observed were due mainly to [1-13C]pyruvate and [3-13C]pyruvate, [2-13C]succinate, and [2-13C]propionate and [3-13C]propionate. Fifteen minutes after its addition, more than 90% of the lactate added had been catabolized; 25 min was necessary for the same consumption of added pyruvate. The label was found temporarily in pyruvate C-1 and C-2 and lactate C-2. No malate peak could be observed.
At the end of the experiment, the label was found principally in propionate (C-3, C-2, and C-1), acetate (C-2 and C-1), succinate (C-2 and C-1), CO2, and HCO3− and, to a lesser extent, in glutamate (C-2 and C-3) and trehalose (C-6, C-5, C-2, and C-1). It was noteworthy that the patterns of the succinate C-2 and propionate C-2 resonances were each composed of a singlet surrounded by a doublet; these patterns reflected the presence of [1,2-13C]- and [2-13C]succinate and [1,2-13C]- and [2-13C]propionate. The coupling constant 1J12 was around 52 Hz for succinate and propionate. The propionate C-3 resonance was a singlet.
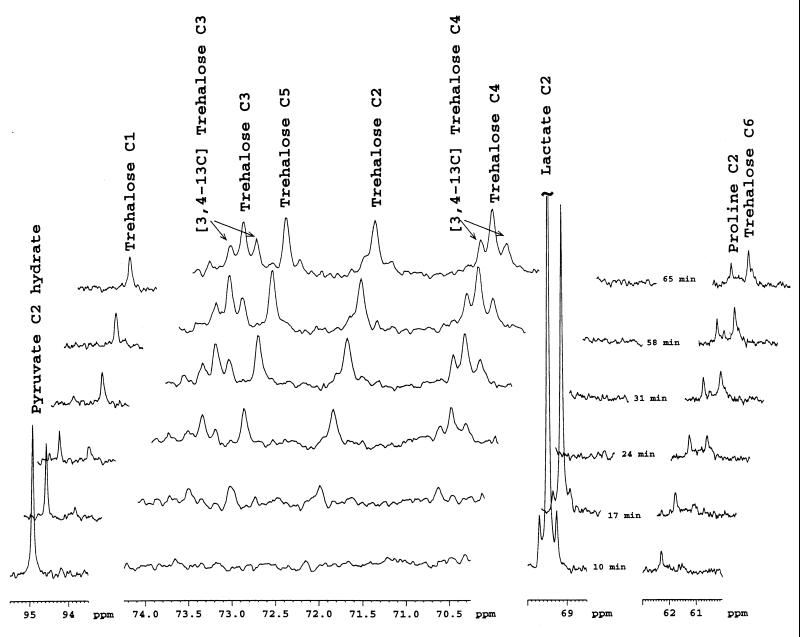
Expanded spectra of 100 to 60 ppm from this experiment are shown in Fig. 5 in order to follow the trehalose isotopomer biosynthesis. Since the trehalose production was low, addition of FID was required. Each spectrum of this stackplot was produced by adding four FID of the previous experiment; thus, each new set of data was constituted of 256 scans (64 · 4 scans). The trehalose resonance could be detected after 17 min; this synthesis seemed to be correlated with disappearance of the lactate C-2 resonance. The first isotopomers to be produced were mainly [2-13C]-, [3-13C]-, [4-13C]-, and [5-13C]trehalose and, to a lesser extent, [1-13C]- and [6-13C]trehalose. Double-labeled [3,4-13C]trehalose was detectable 24 min after addition of pyruvate and lactate.
FIG. 5.
Expanded spectra of the 95.5- to 93.5-, 74.3- to 69.7-, 70- to 68.5-, and 63- to 60-ppm regions of the series of spectra shown in Fig. 4. Each spectrum resulted from FID addition and thus 256 scans.
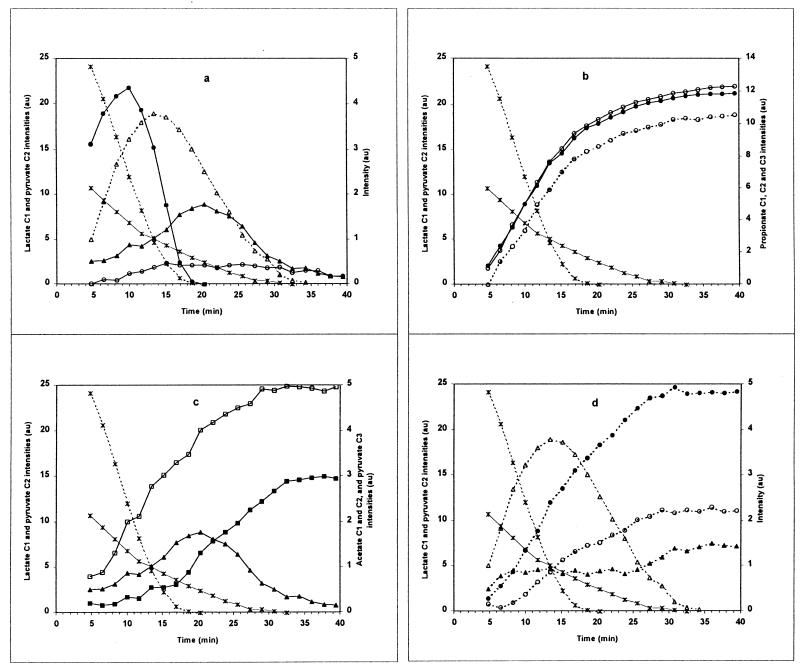
The time courses of the various signals obtained in these experiments are shown in Fig. 6a, b, c, and d. The peak intensities of pyruvate C-2 and pyruvate hydrate C-2 were added, and the global intensity was plotted (Fig. 6a). The lactate added was consumed continuously at an apparent initial rate of 157 μmol · min−1 · g−1 (cell dry weight). On the contrary, the consumption of the pyruvate added was in two steps: in the first 12 min after addition, it was consumed at an apparent initial rate of 90 μmol · min−1 · g−1 (cell dry weight) and then at an apparent rate of 68 μmol · min−1 · g−1 (cell dry weight).
FIG. 6.
Time courses of the various metabolites observed by in vivo 13C NMR spectroscopy during [2-13C]pyruvate and [1-13C]lactate cometabolism by P. shermanii cells. (a) Symbols: ✠, lactate C-1 (broken line) and pyruvate C-2 (solid line); ●, lactate C-2; ▵, pyruvate C-1; ▴, pyruvate C-3; ○, alanine C-2. (b) Symbols: ✠, lactate C-1 (broken line) and pyruvate C-2 (solid line); ●, propionate C-2; ○, propionate C-3; ○, propionate C-1 (broken line). (c) Symbols: ✠ lactate C-1 (broken line) and pyruvate C-2 (solid line); ▴, pyruvate C-3; □, acetate C-1; ■, acetate C-2. (d) Symbols: ✠, lactate C-1 (broken line) and pyruvate C-2 (solid line); ▵, pyruvate C-1; ●, CO2; ○, HCO3−; ▴, succinate C-2. au, arbitrary units.
End products of metabolism as analyzed by 1H NMR and 13C NMR.
The end products of metabolism were measured in the supernatant by NMR as described in Materials and Methods. A comparison of the spectra analyzed by 1H NMR and 1H{13C} NMR was used to identify the satellites due to 13C-1H coupling. Quantification of the end products was performed by measuring the 1H{13C} NMR spectrum with glycine as the internal standard.
Propionate, acetate, and succinate were excreted at molar ratios of 35:58:3 in the pyruvate experiment and 50:48:3 in the cometabolism experiment. Propionate-to-acetate ratios evolved from 0.6 in the pyruvate experiment to 1 in the cometabolism experiment. Significant amounts of unlabeled acetate, propionate, and succinate were also detected.
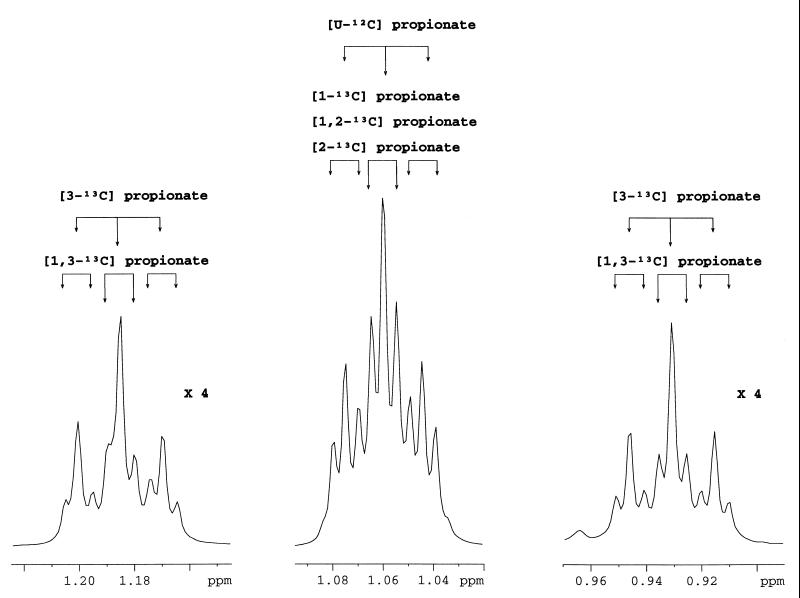
The in vivo 13C NMR cometabolism experiments showed the different isotopomers of propionate, especially [1-13C]propionate, [2-13C]propionate, [3-13C]propionate, and [1,2-13C]propionate. 1H NMR analysis of the supernatant at the end of the cometabolism experiments showed the different isotopomers of propionate, especially for the methyl group. The pattern of the methyl group indicated the presence of these four types of isotopomers already detected by 13C NMR analysis, namely, [1-13C]propionate, [2-13C]propionate, [3-13C]propionate, and [1,2-13C]propionate but also [1,3-13C]propionate and [U-12C]propionate (Fig. 7).
FIG. 7.
Expanded spectra of the 1.22- to 1.14-, 1.1- to 1.02-, and 0.97- to 0.89-ppm regions of 1H NMR spectra of a supernatant cometabolism experiment with P. shermanii after exhaustion of [2-13C]pyruvate and [1-13C]lactate showing the pattern of the methyl group of propionate. The intensities of the spectra on the right and left were multiplied by 4. The coupling constants involved in the splitting are 3J H3–H2 = 8 Hz, 1J 13C3–H2 = 127 Hz, 2J 13C2–H3 = 5 Hz, and 3J 13C1–H3 = 5 Hz.
DISCUSSION
The most important result of this work about pyruvate-lactate cometabolism of P. shermanii, studied by in vivo 13C NMR, concerns the modification of fluxes of pyruvate metabolism induced by the presence of lactate. Pyruvate was temporarily converted to lactate and alanine (Fig. 4 to 6); the flux to acetate synthesis was maintained, but the flux to propionate synthesis was increased; and the reverse flux of the first part of the Wood-Werkman cycle, up to acetate synthesis, was decreased.
Metabolic pathway of [2-13C]pyruvate by P. freudenreichii subsp. shermanii.
According to currently known P. shermanii metabolic pathways, several intermediates, like [3-13C]pyruvate and [2-13C]- and [3-13C]malate, and final products, like [2-13C]- and [3-13C]propionate, [2-13C]- and [1-13C]acetate, [2-13C]succinate, and [2-13C]- and [3-13C]glutamate, are expected to be produced from [2-13C]pyruvate (9, 15, 20) and were effectively observed. [3-13C]pyruvate, [3-13C]alanine, and [3-13C]malate evidenced the active reversibility or bidirectional reactions of the Wood-Werkman cycle up to pyruvate (9).
The flow of the label through [2-13C]alanine and [3-13C]alanine is in accordance with the pathway of glutamic pyruvic transaminase or of alanine dehydrogenase. Alanine belongs to the group of amino acids which are either decarboxylated and deaminated by P. shermanii (1, 2) or only deaminated by P. petersonii (13). The level of the biosynthesis of this compound seemed to be linked to the initial pyruvate concentration.
The label observed in trehalose, the end product of gluconeogenesis, is in accordance with the published pathway (7, 10).
The label of pyruvate can enter the tricarboxylic acid (TCA) cycle in the oxidative way either after carboxylation in oxaloacetate or after decarboxylation in acetyl-CoA. The label of C-4 and C-5 glutamate is derived from acetyl-CoA C-2 and C-1, respectively, and the label of C-1, C-2, and C-3 glutamate is derived from oxaloacetate C-4, C-3, and C-2, respectively. From the kinetic data of [2-13C]- and [3-13C]glutamate and the absence of significant variation of [4-13C]glutamate peak intensity, it can be deduced that the label of oxaloacetate is rapidly scrambled between positions 2 and 3, and thus, the overall rate of the pathway from oxaloacetate ↔ malate ↔ fumarate is greater than the rate of oxaloacetate ↔ pyruvate ↔ acetyl-CoA. Furthermore, since no delay is observed between the appearances of glutamate and propionate, the Wood-Werkman and TCA cycles are active simultaneously.
Pyruvate-lactate cometabolism experiments.
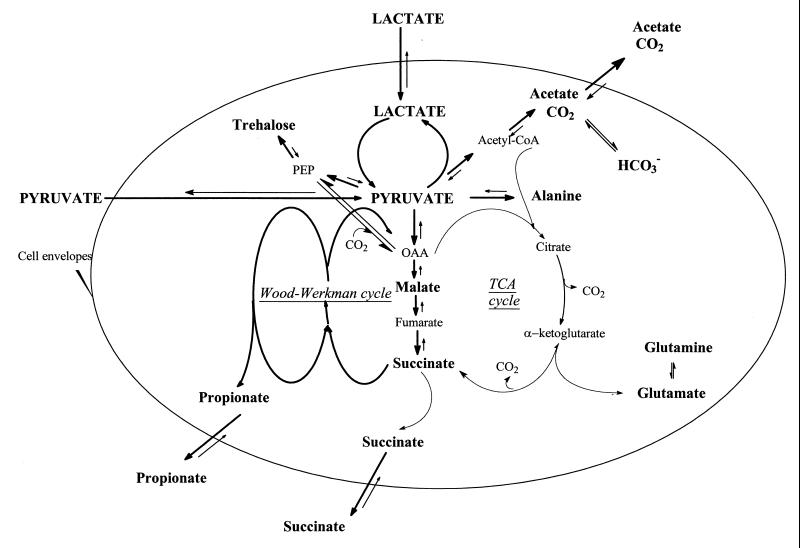
The pyruvate pool must be regulated in order to be under the toxic concentration, as observed by Hugenholtz (12) for lactic acid bacteria. In this study, we found that P. shermanii is able to manage the carbon fluxes at the pyruvate node in several ways (Fig. 8).
FIG. 8.
Schematic diagram of the proposed regulation of central carbon metabolism in P. freudenreichii subsp. shermanii. OAA, oxaloacetate; PEP, phosphoenolpyruvate.
(i) Transport and excretion of pyruvate.
To control the size of the pyruvate pool, the cell reduced the apparent consumption rate of [2-13C]pyruvate from 148 to 90 μmol · min−1 · g−1 in cometabolism. Another way to decrease the size of the pyruvate pool is excretion, but that was not observed in our experiments. When Crow (5) measured intracellular pyruvate concentrations of up to 137 mM during the initial stages of lactate fermentation by P. shermanii, an extracellular pyruvate concentration of up to 3.7 mM was observed during the last stages of lactate fermentation, i.e., lactate exhaustion.
(ii) Transport and synthesis of lactate.
It is noteworthy that [1-13C]lactate was also metabolized to [1-13C]pyruvate at the same time as [2-13C]pyruvate. In P. shermanii, Schilliger-Devriend (18) demonstrated the existence of two lactate transport systems, one which had affinity for the anion and another which transported the unionized form of lactate. The transport system was not further characterized in terms of pyruvate competition. Nevertheless, if [1-13C]lactate was rapidly transported into the cells and further metabolized to [1-13C]pyruvate, this increased the size of the pyruvate pool already largely bred by [2-13C]pyruvate.
To the best of our knowledge, this is the first time that conversion of pyruvate to lactate has been observed in Propionibacterium during in vivo cometabolism experiments. Excretion of lactic acid by propionic acid bacteria is not a common fact but was reported over the years as an intriguing point. Production of lactic acid by propionibacteria was observed by Choi and Mathews (4). Its biosynthesis started as soon as glucose fermentation started but stopped when the substrate was exhausted, and then its consumption was started. Here the strength of labeled-substrate addition and in vivo NMR enables the detection of intermediates and also monitoring of the fate of a single carbon atom and especially distinction among a pool of a compound by the examination of the different isotopomers, which substrates were the precursors of the compound. In cometabolism experiments, it was possible to distinguish (i) [1-13C]pyruvate formed by dehydrogenation of [1-13C]lactate from [2-13C]pyruvate and (ii) [2-13C]lactate formed by hydrogenation of [2-13C]pyruvate from [1-13C]lactate. At this point, even if it was not possible to distinguish between intra- and extracellular pyruvate or lactate, it could be postulated that some [1-13C]pyruvate could be converted temporarily to [1-13C]lactate, as observed for [2-13C]pyruvate, which was temporarily converted to [2-13C]lactate. Moreover, a new species of propionibacteria, namely, P. cyclohexanicum sp. nov., described lately by Kusano et al. (14), which presents a high level of homology with P. freudenreichii (97.1%) differs from the latter by high production of lactic acid and lower heat susceptibility.
(iii) Propionate, acetate, and succinate syntheses.
In monoaddition experiments, the reverse flow of the first part of the Wood-Werkman cycle, which is visualized by the formation of [3-13C]malate and [3-13C]pyruvate and finally by the formation of [2-13C]acetate, took place immediately. In cometabolism experiments, this reverse flow was delayed and really took place when lactate had almost disappeared and when [2-13C]pyruvate was in the second step of its evolution (12 min after addition; Fig. 6a and c.). In cometabolism experiments, the flow of [2-13C]pyruvate through the acetate pathway was the same as in monoaddition experiments, which led us to think that the conversion rate could not be greater. Moreover, [2-13C]- and [3-13C]propionate were observed and appeared at the very beginning of the cometabolism experiment, underlining the fact that the direct flow of the first part of the Wood-Werkman cycle was largely predominant. In such a situation, it could be postulated that the labeled-malate pool was small. In fact, it was under our limit of detection.
Synthesis of succinate, as an end product, was observed at the very beginning of the cometabolism experiment but was a minor pathway under these conditions.
(iv) Alanine synthesis.
Alanine was biosynthesized for either anabolic processes or toxic reasons or both. Pyruvate was temporarily converted to alanine to constitute an intracellular pool which lowered the intracellular concentration of pyruvate and did not interfere with cell metabolism. In experimental cheeses, the alanine concentration increased up to 10 to 14 mmol/kg of cheese during ripening but the role of propionibacteria was not clear (6).
(v) Trehalose synthesis.
Another way to reduce the pyruvate pool is gluconeogenesis, and both [2-13C]pyruvate and [1-13C]pyruvate are precursors of trehalose.
(vi) Glutamate and glutamine syntheses.
In cometabolism experiments, the first oxaloacetate to be produced would be enriched at position 1, which has no impact on the carbon skeleton of glutamate. When [2,4-13C]oxaloacetate was produced, then [1,3-13C]glutamate would be synthesized. Since the amount of glutamate produced was low and the coupling constant J13 is small, then it could not be detected. Moreover, the initial amount of intracellular glutamate is known to be high (17) and will participate in the dilution of the biosynthesized glutamate. Furthermore, in P. shermanii, the TCA cycle is probably dedicated to anabolism and is not used for energetic purposes (3).
Glutamine was observed in monoaddition and cometabolism experiments, with an isotopic enrichment pattern similar to that of glutamate. In Propionibacterium, the enzymes involved in glutamine synthesis are still unknown but the similarity in the isotopic enrichment pattern of glutamine and glutamate is a factor arguing for its production from either glutamine synthase or glutamate synthase in P. shermanii.
The fermentation patterns of monoaddition experiments are in accordance with the expected ones, and they are not so far from the theoretical value. In cometabolism experiments, the molar ratio of propionate to acetate was between the two theoretical values. Thus, in cheese where lactate and pyruvate are available, a molar ratio of propionate to acetate different from 2 would only be expected and is, in fact, always observed. Furthermore, the fermentation of amino acids by propionibacteria is also implicated in the variation of this product ratio (6).
ACKNOWLEDGMENTS
We thank A. Bondon for invaluable assistance with NMR analysis, J. D. de Certaines for extensive use of his NMR spectrometer, and D. Jacob for assistance with data processing.
This work was partially supported by a grant from the Ministère de l'Agriculture and the Ministère de la Recherche et de l'Espace (France) under the program Aliment demain. C.D. acknowledges the National Association for Technical Research for a doctoral grant (CIFRE).
REFERENCES
- 1.Antila M. –1955. Studies on propionic acid bacteria in Emmental cheese. Finn J Dairy Sci. 1954;16:3–132. [Google Scholar]
- 2.Antila M. –1957. Amino acid breakdown by propionic acid bacteria. Finn J Dairy Sci. 1956;18/19:1–6. [Google Scholar]
- 3.Bonartseva G A, Krainova O A, Vorob'eva L I. Pathways of terminal oxidation in propionic acid bacteria. Mikrobiologiya. 1973;42:583–588. [PubMed] [Google Scholar]
- 4.Choi C H, Mathews A P. Fermentation metabolism and kinetics in the production of organic acids by Propionibacterium acidipropionici. Appl Biochem Biotechnol. 1994;44:271–285. [Google Scholar]
- 5.Crow V L. Utilization of lactate isomers by Propionibacterium freudenreichii subsp. shermanii: regulatory role for intracellular pyruvate. Appl Environ Microbiol. 1986;52:352–358. doi: 10.1128/aem.52.2.352-358.1986. [DOI] [PMC free article] [PubMed] [Google Scholar]
- 6.Crow V L, Martley F G, Delacroix A. Isolation and properties of aspartase-deficient variants of Propionibacterium freudenreichii subsp. shermanii and their use in the manufacture of Swiss-type cheese. N Z J Dairy Sci. 1988;23:75–85. [Google Scholar]
- 7.Deborde C, Corre C, Rolin D B, Nadal L, de Certaines J D, Boyaval P. Trehalose biosynthesis in dairy Propionibacterium. J Magn Reson Anal. 1996;2:297–304. [Google Scholar]
- 8.Deborde C, Rolin D B, Bondon A, de Certaines J D, Boyaval P. In vivo13C nuclear magnetic resonance study of citrate metabolism in Propionibacterium freudenreichii subsp. shermanii. J Dairy Res. 1998;65:503–514. [Google Scholar]
- 9.Deborde C, Rolin D B, Boyaval P. In vivo13C NMR study of the bidirectional reactions of the Wood-Werkman cycle and around the pyruvate node in Propionibacterium freudenreichii subsp. shermanii and Propionibacterium acidipropionici. Metab Eng. 1999;1:309–319. doi: 10.1006/mben.1999.0124. [DOI] [PubMed] [Google Scholar]
- 10.Deborde C, Salvat-Brunaud D, Thierry A, Boyaval P. In vivo NMR study of dairy propionic acid bacteria metabolism. Analusis. 1997;25:15–20. [Google Scholar]
- 11.Hettinga D H, Reinbold G W. The propionic acid bacteria. A review. II. Metabolism. J Milk Food Technol. 1972;35:358–372. [Google Scholar]
- 12.Hugenholtz J. Citrate metabolism in lactic acid bacteria. FEMS Microbiol Rev. 1993;12:165–178. [Google Scholar]
- 13.Kiuru V J T. Über die Propionsäuregärung in Bezug auf Emmentaler Käse. Ph.D. thesis. Helsinki, Finland: University of Helsinki; 1949. [Google Scholar]
- 14.Kusano K, Yamada H, Niwa M, Yamasato K. Propionibacterium cyclohexanicum sp. nov., a new acid-tolerant omega-cyclohexyl fatty acid-containing Propionibacterium isolated from spoiled orange juice. Int J Syst Bacteriol. 1997;47:825–831. doi: 10.1099/00207713-47-3-825. [DOI] [PubMed] [Google Scholar]
- 15.Leaver F W, Wood H G, Stjernholm R. The fermentation of three carbon substrates by Clostridium propionicum and Propionibacterium. J Bacteriol. 1955;70:521–530. doi: 10.1128/jb.70.5.521-530.1955. [DOI] [PMC free article] [PubMed] [Google Scholar]
- 16.Mocquot G. Reviews of the progress of dairy science: Swiss-type cheese. J Dairy Res. 1979;46:133–160. [Google Scholar]
- 17.Rolin D B, Girard F, de Certaines J D, Boyaval P. 13C NMR study of lactate metabolism in Propionibacterium freudenreichii subsp. shermanii. Appl Microbiol Biotechnol. 1995;44:210–217. [Google Scholar]
- 18.Schilliger-Devriend C. Transport et oxydation du D- et du L-lactate chez Propionibacterium freudenreichii subsp. shermanii. Ph.D. thesis. Lausanne, Switzerland: University of Lausanne; 1985. [Google Scholar]
- 18a.Shaka A J, Barker P B, Freeman R. Computer-optimized decoupling scheme for wideband applications and low-level operation. J Magn Reson. 1985;64:547–552. [Google Scholar]
- 18b.Shaka A J, Keeler J, Frenkiel T, Freeman R. An improved sequence for broadband decoupling: WALTZ-16. J Magn Reson. 1983;52:335–338. [Google Scholar]
- 19.van Gent-Ruijters M L W, de Vries W, Stouthamer A H. Influence of nitrate on fermentation pattern, molar growth yields and synthesis of cytochrome b in Propionibacterium pentosaceum. J Gen Microbiol. 1975;88:36–48. doi: 10.1099/00221287-88-1-36. [DOI] [PubMed] [Google Scholar]
- 20.Wood H G. Metabolic cycles in the fermentation by propionic acid bacteria. Curr Top Cell Regul. 1981;18:255–287. doi: 10.1016/b978-0-12-152818-8.50021-9. [DOI] [PubMed] [Google Scholar]


