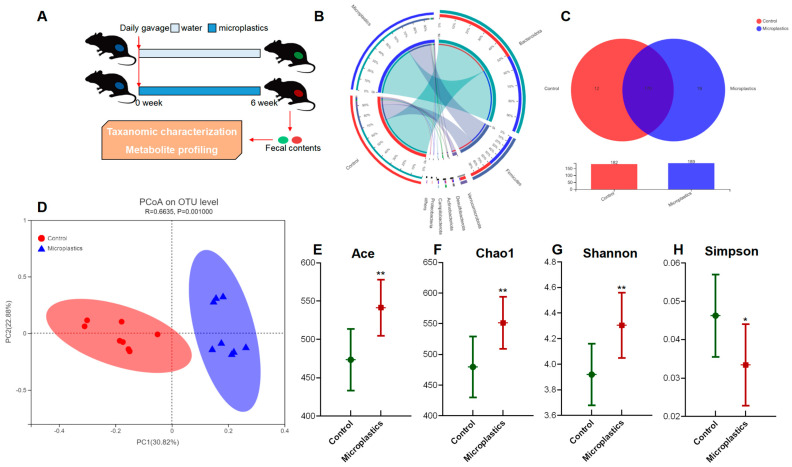
Figure 1.
MP-induced alterations in the mouse gut microbial community. (A) Experimental design. (B) Circos diagram for component profiles of the gut microbial community at phylum level (n = 8). (C) Venn diagram for component profiles of the gut microbial community at species level (n = 8). (D) Component profiles analyzed by PcoA model (n = 8). (E–H) Alpha diversity indices of Ace, Chao1, Shannon, and Simpson (n = 8, * p < 0.05, ** p < 0.01).

