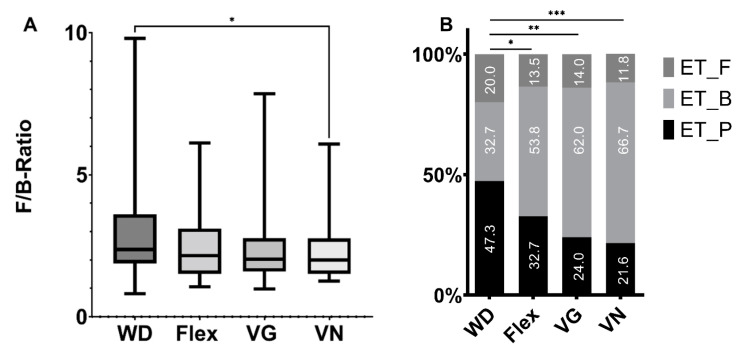
Figure 6.
(A) Firmicutes/Bacteriodetes ratio distribution for each diet. ANOVA showed no significant difference across all diets. Pairwise comparison was only significant for WD versus VN (p < 0.05). (B) Enterotypes according to Le Chatelier et al. [20]. ET_F = Firmicutes-enriched; ET_B = Bacteroides-enriched; ET_P = Prevotella-enriched. Across all groups, the composition of the enterotypes was statistically different, as calculated by ANOVA with a p-value of 0.005. * shows corresponding significance levels (* p < 0.05, ** p < 0.01, *** p < 0.001) of the pairwise comparisons obtained by t-tests.

