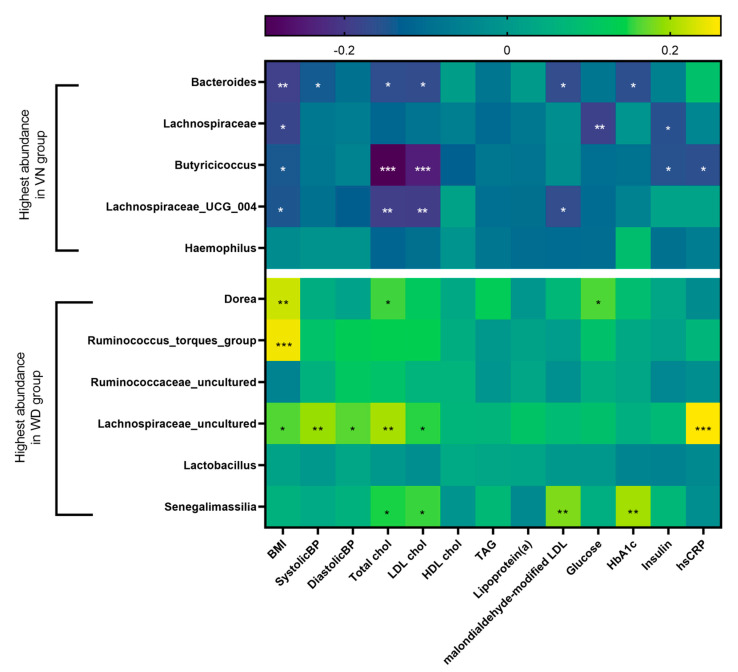
Figure 7.
Heatmap of the correlation analysis of 11 significant genera, separated by maximum abundance in WD or VN group, resulting from the LefSe analysis of the four diets tested. Top legend represents corresponding r-values. Significant results are marked as following: *: p < 0.05, **: p < 0.01, ***: p < 0.001. BMI = body mass index; BP = blood pressure; Total chol = total cholesterol; LDL chol = low-density lipoprotein cholesterol, HDL chol = high-density lipoprotein cholesterol; TAG = triacylglycerides; HbA1c = hemoglobin A1c; hsCRP = high sensitivity c-reactive protein.

