Abstract
A new three-dimensional (3D)-tracking system with optimized dark-field illumination is presented. It allows simultaneous 3D tracking of several free-swimming microorganisms with diameters of >10 μm. Resolution limits and illumination efficiencies for different size classes of microorganisms are treated analytically. First applications for 3D tracking of protists are demonstrated.
Many microorganisms react to environmental stimuli, such as chemicals, gravity, magnetic fields, or light. By changing their motility behavior, they are able to position themselves in regions best suited to their physiology. Studies of microbial motility and sensory behavior are thus important for understanding the role of motile microorganisms in microbial ecosystems and give important clues to the structure and ecology of microenvironments (2, 5, 7, 11).
For quantitative investigations of motility, cell tracking systems are advantageous. Most systems described in the literature are based on standard microscopes (1). Their optics are optimized for high resolution, yielding a limited depth of field. Consequently, a cell can be tracked only during the time it spends in the focal plane. Thin test chambers (e.g., a flat microcapillary) are often used for limiting the space available for the microorganisms to a two-dimensional (2D) plane. The microorganisms are then forced to stay in the focal plane, but interactions between the borders of the test chamber and the microorganism can significantly influence their moving patterns. This is especially the case for microorganisms driven by long flagella (8). The optimization of optics for high resolution is not necessarily the best optical configuration for a tracking system, in which only their position is of interest.
Most tracking systems in use are 2D-tracking systems. Usually, a video camera connected to a microscope records pictures of moving microorganisms at a rate of 25 or 30 Hz. While such a setup is suitable for studies of motile microorganisms naturally restricted to 2D surfaces (e.g., gliding motility [10]), it has several disadvantages for observations of microorganisms with truly 3D moving patterns, like those of swimming protozoa (7) and bacteria (4). Their tracks appear as projections with loss of information, such as velocity and direction.
The solution to this problem is to apply true 3D imaging. Common techniques like confocal laser scanning microscopy are much too slow for tracking fast microorganisms, which can swim at 1,000 μm s−1 (9). A setup for 3D tracking of single bacteria was presented by Berg (3). It consisted of a standard video microscope, in which the observation chamber could be moved by solenoids in all directions. A regulatory circuit ensured that the observed bacterium stayed in the center of the focal plane. The 3D position of the observed bacterium was recorded every 1/12 s. However, this approach is inherently limited to tracking one cell at a time.
Here we present a video-based 3D-tracking system for microorganisms with a diameter of >10 μm. The tracking system is independent of mechanical devices and provides the possibility of tracking many cells simultaneously. In order to increase the contrast, a dark-field illumination was applied, which was optimized for high illumination efficiency for minimizing any influence on the sample. Nonactinic near-infrared illumination was used, which allowed investigations of photosensory behavior.
Description of the setup.
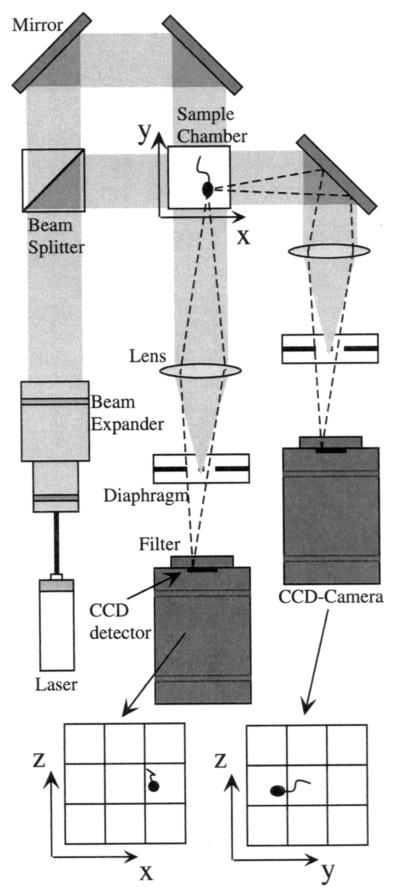
The 3D-tracking system is based on simultaneous observation of a cubic volume with two video cameras positioned at 90° relative to each other, i.e., one camera recording projections onto the (x,z) plane while the other recorded projections onto the (y,z) plane, where (x,y,z) are Cartesian coordinates inside the cubic volume. By analyzing both (time-synchronized) video recordings, 3D tracks of the observed microorganisms can be reconstructed.
The complete setup is shown in Fig. 1. For illumination, we used an infrared diode laser (785-nm wavelength, 3 mW; RS Components, Copenhagen, Denmark). A combination of two achromat lenses (20- and 120-mm focal lengths) expands the beam by a factor of six to a diameter of 15 mm. A pinhole with a 30-μm diameter was positioned in the common focal point of the lenses, serving as a spatial filter improving the collimation of the final beam. The beam splitter and mirrors in the light path provided two illumination beams perpendicular to each other. The sample under investigation was placed at the crossing point of the two illumination beams. Two standard monochrome charged-coupled device (CCD) cameras (kamPro02; EHD, Damme, Germany) were used, which are also sensitive in the near-infrared range. The optical path belonging to one of the cameras was redirected by an additional mirror for compacting the overall dimensions. Interference band pass filters (780-nm wavelength, 10-nm bandwidth) were placed directly in front of the CCD detectors in order to exclude ambient light or light fields used for investigations of photosensory behavior. The complete setup was built on an optical bench (Microbench; Linos Photonics, Göttingen, Germany).
FIG. 1.
Optical setup for 3D tracking of microorganisms. The paths of the illumination laser beam are shown as shaded areas. Rays coming from a microorganism in the sample chamber are shown as broken lines.
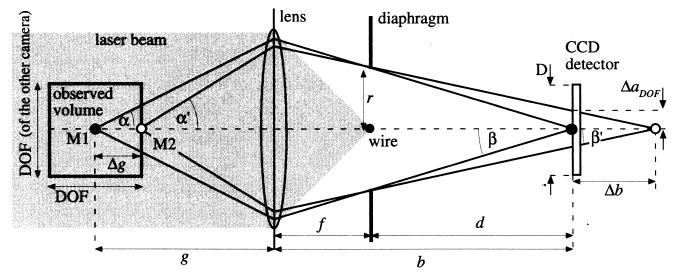
The illumination light hitting the microorganisms is scattered, and this scattered light is used for observing them. Microorganisms are typically 1 to 100 μm in diameter. In this region, light scattering of roughly spherical-shaped particles can be approximated by the Mie theory (6, 13). For the size class between 1 and 5 μm, light is scattered almost equally in all directions. The illumination efficiency for this size class cannot be improved over common illumination techniques in microscopy. However, for the size class of 5 to 100 μm, an improvement is possible, because forward scattering increases with particle diameter. In order to utilize forward scattered light for the observation of microorganisms in dark-field illumination, the optics have to be almost in line with the direction of the illumination light. To accommodate this, the configuration shown in Fig. 2 was chosen. Only the setup for one camera is shown. The expanded laser beam illuminated the microorganisms in the cuvette. The scattered light was imaged by a lens onto the CCD detector of the camera. The original laser beam was removed at the focal point of the lens by a thin wire with a 300-μm diameter. This configuration ensured a long working distance, which made the observed sample easily accessible.
FIG. 2.
Optical configuration of the imaging optics used in the 3D-tracking system. Only the optics belonging to one camera are shown.
The depth of field was regulated by placing an iris diaphragm of radius r at the focal point of the lens close to the wire. The positioning of the diaphragm at this point (also called “telecentric configuration”) has several advantages. It ensures that the forward scattered light from an object can always reach the detector, even if the object is not positioned on the optical axis. Consequently, no fading occurs at the borders of the image. Furthermore, the sample volume is projected onto the detector plane without metric distortions. Standard imaging normally yields spatially distorted images if the focal length of the lens is short. It should be noted that the telecentric configuration limits the cross-section of the observed volume to the area of the lens. This does not, however, cause practical problems for dimensions less than 10 mm.
A large depth of field inherently means a loss in spatial resolution. Consequently, the optimal optical configuration has to be a compromise between depth of field and resolution. The resolution limit (Δares) known for classical microscopes with parallel illumination (12) is given by
 |
1 |
where λ is the wavelength of the laser light and NA is the numerical aperture, defined by
 |
2 |
where n is the refractive index of the medium between the object and the lens and α is the maximum acceptance angle of the optics, which is limited by the diaphragm in the focal point behind the lens (Fig. 2). In our case the medium was air, so the refractive index n is 1 and will be omitted in the following.
In Fig. 2, two point objects, M1 and M2, are shown on the optical axis. The observed volume is the height of the field of view times the depth of field squared. The point object M1, positioned at the center of the observed volume, is in focus on the CCD detector such that
 |
3 |
where f is the focal length of the lens, g is the distance between M1 and the lens, and b is the distance between the lens and the projected image on the CCD detector. The magnification V is given by
 |
4 |
where d is the distance between diaphragm and the CCD detector and β is the maximum angle between a ray from object M1 and the optical axis at the CCD detector. The second point object M2, positioned at the border of the observed volume on the optical axis at a distance of Δg to M1, was imaged at a distance of b plus Δb to the lens. In the following we assume Δg ≪ g, so
 |
5 |
where the angles α′ and β′ belonging to object M2 correspond to the angles α and β belonging to object M1. It can be seen from equations 4 and 5 that the object M2 will produce a circle with a radius ΔaΔg such that
 |
6 |
on the detector plane. For a given depth of field (DOF), this radius is largest at the point ΔaDOF as follows:
 |
7 |
A compromise between resolution and depth of field occurs as follows:
 |
8 |
For a desired depth of field, combining equations 1, 7, and 8 yields the optimum numerical aperture as follows:
 |
9 |
The numerical aperture of the described optical setup is determined by the aperture of the diaphragm. From equations 4 and 5, the radius r of this aperture is as follows:
 |
10 |
The actual resolution limit Δa for a given depth of field can be calculated by combining equations 1 and 9 as follows:
 |
11 |
Finally, the magnification is determined by the dimensions of the CCD detector in the cameras. As one camera's width of field should equal the other's depth of field (i.e., the cross-section of the sample volume is DOF2, as illustrated in Fig. 2), the magnification V is such that
 |
12 |
where D is the width of the CCD detector.
Typical values for depth of field in applications of the 3D-tracking system would be 1, 5, or 10 mm. If an illumination wavelength λ of 780 nm is used, this would imply a resolution limit Δa of 20, 44, or 62 μm, respectively (equation 11). This resolution limit does not mean that objects with a smaller diameter cannot be detected (see below). The limit defines the minimum distance at which two objects can be separated. However, the resolution of the positional information of an object itself is in principle not limited by this. Here the limitation is given by the pixel resolution of the CCD detector. If the CCD detector has N pixels in width, then the positional resolution limit Δx is calculated as follows:
 |
13 |
Typical CCD detectors have at least 500 pixels in width. If we again assume a depth of field of 1, 5, or 10 mm, this would yield a positional resolution limit of 2, 10, or 20 μm, respectively.
Illumination efficiency.
The light scattering of roughly spherical-shaped microorganisms with diameters of 1 to 100 μm can be approximated by Mie scattering. The scattering functions, Σ(θ), of spheres with diameters of 1, 10, and 100 μm were calculated numerically, where θ is the scattering angle. The step size of θ for the calculation was 0.1°. We assumed no absorption and an optical wavelength of 780 nm. The relative refractive index n was chosen to be 1.04, which was shown to be a good approximation for the refractive index of microorganisms relative to that of water (13). The scattering function (6) is related to the total cross section, ς, as follows:
 |
14 |
The fraction of the scattered light, which reaches the detector, is limited by the numerical aperture (NA = sin α) of the optical system; it can be shown that the part of the scattered light removed by the wire can be neglected. The cross section, ςdet, of this part is calculated as follows:
 |
15 |
The illumination efficiency, e(α), is calculated as follows:
 |
16 |
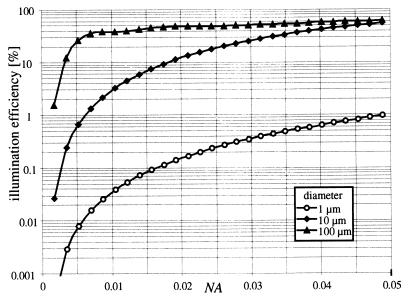
The illumination efficiency for the three different sizes of spheres is shown in Fig. 3 as a function of the numerical aperture (NA). Only NA values of <0.05 are shown, as this is the interesting region for large depths of field. A sphere with a 100-μm diameter can be detected at very high efficiency. With an NA value of >0.02 (corresponding to a depth of field of 4 mm), more than 40% of the scattered light reaches the CCD detector. This is due to the pronounced forward scattering in this case. The efficiency drops to about 10 and 0.1% for 10- and 1-μm-diameter spheres, respectively. For microorganisms with diameters of >10 μm, the proposed illumination method is much more efficient than standard dark-field illumination in microscopes, in which the forward scattered light is not exploited. Microorganisms with diameters comparable to the wavelength of the illumination light do not show pronounced forward scattering, and the illumination efficiency drops significantly. In practice, this limits our setup to observation of microorganisms with diameters of >10 μm. Smaller objects could be only detected with a much higher numerical aperture. But, this is generally not compatible with the need for a large depth of field for the 3D-tracking system.
FIG. 3.
Illumination efficiency as a function of the numerical aperture (NA). The three lines represent calculations for three model microorganisms of different diameters, as indicated in the legend.
The tracking system.
Video sequences were recorded on two separate video recorders, each connected to one of the two cameras. The light source was momentarily switched off at the start of a recording session to form a reference point for time synchronization. Alternatively, it is possible to make do with one recorder by combining half of the image from each camera into a single video channel (the images appear side by side) by using an editing box. We used digital tape recorders and transferred recorded video sequences to a computer via a standardized serial connector (IEEE 1394-FireWire) at 25 frames s−1 (PAL format). This technology is readily available at low cost. Digital video sequences were stored with QuickTime, which makes them compatible with most computer platforms.
Automatic tracking was performed for each of the two sequences representing the (x,z) plane and the (y,z) plane, in turn. The tracking software (LabTrack; DiMedia, Kvistgård, Denmark) is based on an algorithm which analyzes sequences one frame at a time while building tracks. Each video frame is thresholded and analyzed for objects. The algorithm searches around the end of each existing track, and any objects in proximity become candidates for continuing those tracks. The best candidate is chosen based on velocity and trajectory. Any object not associated with a track becomes the start of a new track. Tracking accuracy can be controlled by adjusting criteria, such as search radius, object size, velocity, and duration. The system can track several hundred objects simultaneously and has proved to be quite robust for tracking motile cells ranging in size from small bacteria to large ciliates (5, 7).
3D tracks were constructed from the two sets of 2D tracks, one of the (x,z) plane and the other of the (y,z) plane. A track in the (x,z) plane was taken to match a track in the (y,z) plane if the average difference in their common coordinate, z, averaged over time in overlapping segments, was below a defined threshold level.
A program for visualization of the obtained 3D tracks was written. The tracks are shown as either 3D projections or red-green images, which show real 3D impressions if viewed through red-green glasses. The tracks can be freely rotated and viewed from all directions. Additionally, an option for animation exists, in which single cells are represented by moving points on the screen. The program is available from the corresponding author.
Applications for 3D tracking of protists.
The complete tracking system was tested with three different cultures of protists: Euglena gracilis, Strombidium sulcatum, and Oxhyrris marina. Three milliliters of the liquid cultures was filled into a standard glass cuvette (10 by 10 by 40 mm) with four optically clear walls. The cuvette was placed on a Peltier element (10 by 10 mm, I = 1 A, MI 1060 T; RS Components) in order to prevent thermal convection in the cuvette. A steady-state temperature gradient was established after 30 min, with temperatures of 15°C at the bottom and 18°C at the top.
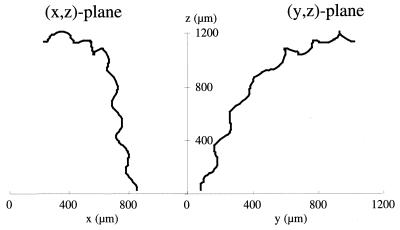
In Fig. 4, the 3D track of one swimming S. sulcatum cell is shown as projections onto the (x,z) plane and the (y,z) plane. The duration of the shown track is 4.0 s. The helical swimming pattern of the ciliate can be seen combined with a gradual change in direction.
FIG. 4.
Projections of the 3D track of one S. sulcatum cell onto the (x,z) and the (y,z) planes. The time duration of the shown track is 4.0 s.
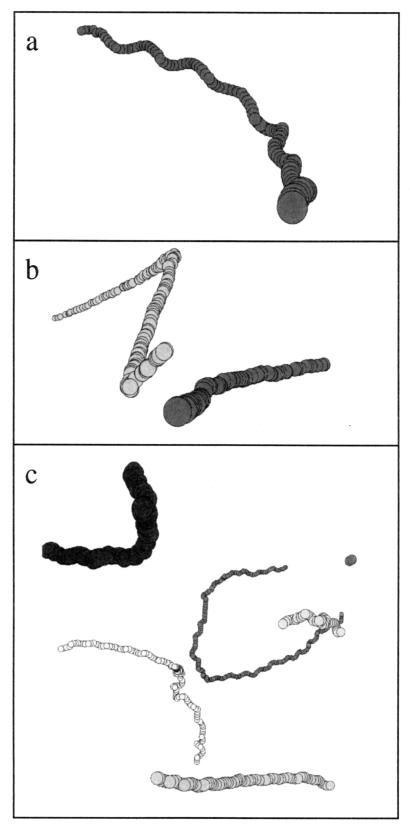
The 3D tracks obtained from all three cultures are shown in Fig. 5 as 3D projections. The circles indicate the positions of the microorganisms at successive time steps of 0.04 s. The depth information is indicated by the diameters of the circles. The S. sulcatum track (Fig. 5a) is the same as in Fig. 4. The 3D projection gives a good impression of its complex 3D swimming pattern. Tracks of two E. gracilis cells are shown in Fig. 5b. In this case, the cuvette was additionally illuminated by a standard incandescent bulb (60 W) producing a scalar irradiance of 25 μmol photons s−1 m−2. Tumbling of E. gracilis cells could be induced by switching off the illumination for 1 s, resulting in a change of swimming direction. The tracks consist of several straight-line parts interrupted by the tumbling. The last example (Fig. 5c) shows tracks of six O. marina cells swimming simultaneously in the observed volume.
FIG. 5.
3D projections of tracks belonging to different microorganisms: E. gracilis (a), S. sulcatum (b), and O. marina (c). The circles indicate the positions of the microorganisms at successive time steps of 0.04 s. The depth information is indicated by the diameters of the circles.
These first applications illustrate how this system can be used in future studies of microbial motility. Attractant chemical sources can be easily added into the cuvette, thus allowing detailed 3D studies of chemotactic behavior of protists. The cuvette can be illuminated by well-defined light fields (e.g., fiber optics), thus allowing studies of photosensory behavior. The possibility to track several microorganisms simultaneously allows studies of interactions between motile microorganisms, like swarming behavior or predator-prey interactions.
Acknowledgments
This study was supported by grants from the European Commission (MAS3-CT98-5054), the Swedish Foundation for International Cooperation in Research and Higher Education (STINT), and the Danish Natural Science Research Council (9700549).
We thank Tom Fenchel and Per Juel Hansen for providing cultures of S. sulcatum and O. marina.
REFERENCES
- 1.Armitage J P, Packer H L. Bacterial motility and chemotaxis. In: Soll D R, Wessels D W, editors. Motion analysis of living cells. New York, N.Y: Wiley; 1998. pp. 1–24. [Google Scholar]
- 2.Barbara G M, Mitchell J G. Formation of 30- to 40-micrometer-thick laminations by high-speed marine bacteria in microbial mats. Appl Environ Microbiol. 1996;62:3985–3990. doi: 10.1128/aem.62.11.3985-3990.1996. [DOI] [PMC free article] [PubMed] [Google Scholar]
- 3.Berg H C. How to track bacteria. Rev Sci Instrum. 1971;42:868–871. doi: 10.1063/1.1685246. [DOI] [PubMed] [Google Scholar]
- 4.Berg H C, Brown D A. Chemotaxis in Escherichia coli analysed by three-dimensional tracking. Nature. 1972;239:500–504. doi: 10.1038/239500a0. [DOI] [PubMed] [Google Scholar]
- 5.Blackburn N, Fenchel T, Mitchell J. Microscale nutrient patches in planktonic habitats shown by chemotactic bacteria. Science. 1998;282:2254–2256. doi: 10.1126/science.282.5397.2254. [DOI] [PubMed] [Google Scholar]
- 6.Born M, Wolf E. Principles of optics. 6th ed. Oxford, England: Pergamon Press; 1980. [Google Scholar]
- 7.Fenchel T, Blackburn N. Motile chemosensory behaviour of phagotrophic protists: mechanisms for and efficiency in congregating at food patches. Protist. 1999;150:325–336. doi: 10.1016/S1434-4610(99)70033-7. [DOI] [PubMed] [Google Scholar]
- 8.Frymier P D, Ford R M, Berg H C, Cummings P T. Three-dimensional tracking of motile bacteria near a solid planar surface. Proc Natl Acad Sci USA. 1995;92:6195–6199. doi: 10.1073/pnas.92.13.6195. [DOI] [PMC free article] [PubMed] [Google Scholar]
- 9.Garcia-Pichel F. Rapid bacterial swimming measured in swarming cells of Thiovulum majus. J Bacteriol. 1989;171:3560–3563. doi: 10.1128/jb.171.6.3560-3563.1989. [DOI] [PMC free article] [PubMed] [Google Scholar]
- 10.Häder D-P, Vogel K. Interactive image analysis system to determine the motility and velocity of cyanobacterial filaments. J Biochem Biophys Methods. 1991;22:289–300. doi: 10.1016/0165-022x(91)90035-u. [DOI] [PubMed] [Google Scholar]
- 11.Juel Hansen P, Calado A J. Phagotrophic mechanisms and prey selection in free-living dinoflagellates. J Eukaryot Microbiol. 1999;46:382–389. [Google Scholar]
- 12.Lipson S G, Lipson H S, Tannhauser D S. Optical physics. 3rd ed. Cambridge, England: Cambridge University Press; 1995. [Google Scholar]
- 13.Volten H, de Haan J F, Hovenier J W, Schreurs R, Vassen W, Dekker A G, Hoogeboom H J, Charlton F. Laboratory measurements of angular distributions of light scattered by photoplankton and silt. Limnol Oceanogr. 1998;43:1180–1197. [Google Scholar]


